Refining the Mite Wash: Part 3
Dislodgement, Precipitation, and Separation
Randy Oliver
ScientificBeekeeping.com
First Published in ABJ in September 2020
In my last article I showed how mites will quickly drop off the bees’ bodies if immersed in 91% alcohol. But there are still more steps remaining to separate the mites from the sample of bees.
I’m writing this series of articles as I’m doing the research, since I want to get my findings to you as quickly as possible. So please forgive me if this series seems disjointed. A number of my findings have surprised me, so I’m continually coming up with new questions, and thinking of ways to answer those questions.
Underside Inspection, Take 2
While working with volunteer beekeeper Michelle, we identified one of my test colonies with an extremely high mite infestation – around 100 mites per 300 bees. That works out to there being an average of 1 mite for every 3 bees. This presented a perfect opportunity for me to see whether the “clamshell method” of mite monitoring that I mentioned in my last article could be useful.
So we shook samples of those bees into plastic clamshell food containers, let them settle down for a minute, and took advantage of Michelle’s sharp young eyes (and my reading glasses) to see whether we could estimate the infestation rate by looking at the bees’ bellies (Fig. 1).
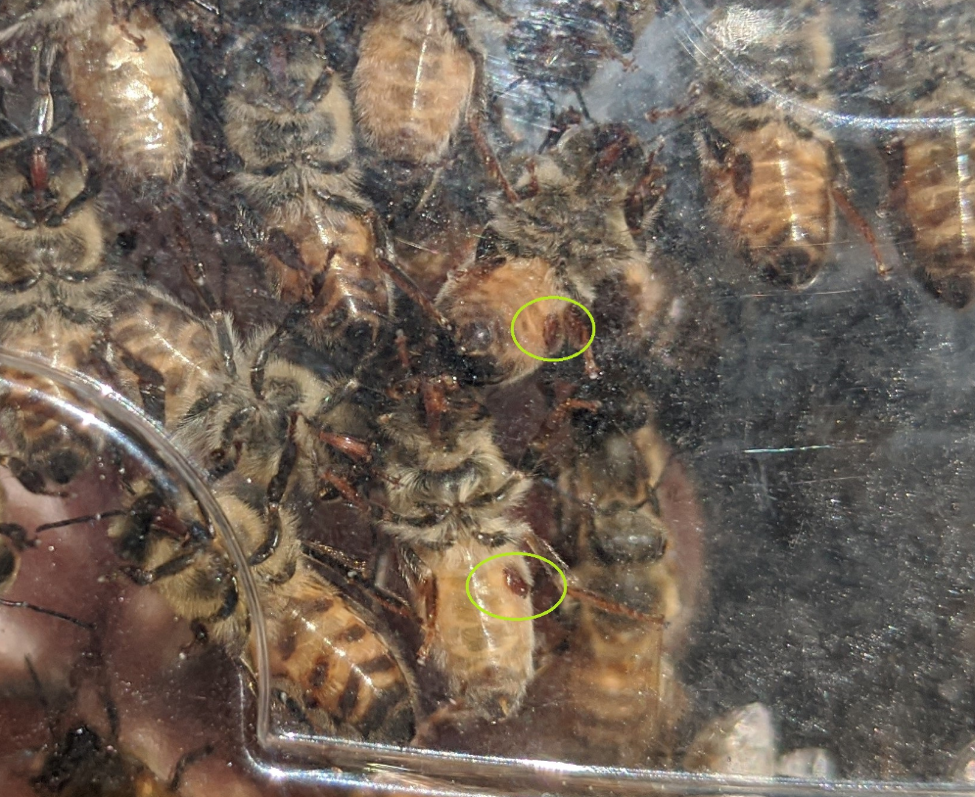
Figure 1. It was easy to spot mites on the undersides of the bees (two circled), but we were amazed at how few we saw – certainly not a mite on every third bee. We were lucky to see a single mite in 15 bees, and have no idea where the rest of the expected mites were. So although this technique initially looked promising, it needs to be validated, which will require first counting mites visually, then washing the bee sample to recover any unseen mites. I hope to collect that data soon.
Revisiting the Sugar Roll/Shake
Kamran Fakhimzadeh, from Helsinki, Finland, first brought sugar dusting to our attention back in the year 2000, in this very journal [[1]], with a photograph of how the sugar particles stuck to the mites’ empodia, causing them to lose their grip, and suggested it as a mite-control method [[2]]. Then in 2002, researchers in Dr. Marion Ellis’ lab tested using inert dusts to monitor for varroa [[3]], with the recommendation to use powdered sugar. This was followed by extension publications [[4]], where the term “sugar roll” was coined, due to rolling bees in a jar to coat them with powdered sugar. But Macedo and Ellis only suggested possible mechanisms for why the sugar roll worked.
As with many things in beekeeping, “common knowledge” takes on a life of its own, and nowadays, descriptions of the sugar roll technique often mention something to the effect that “The sugar acts as an irritant and bees will generate heat when trying the remove the sugar. It’s the heat that dislodges the Varroa mites from the bees” [[5]] (Fig. 2).

Figure 2. Rolling the bees in powdered sugar clearly bothers them, but does it bother them enough to make them heat up enough to make varroa mites abandon them?
The heating-up claim makes complete sense, until you think about it. Honey bees heat up their flight muscles to around 105°F, and return to the hive with thoracic temperatures above 102°F, and abdominal temps above 95°F [[6]], and can exhibit body temperatures on hot days of up to 113°F [[7]]. Thus, if a bit of heating was all that it took to get a mite to let go, a bee could lose attached mites by simply taking a flight on a hot day – an incredibly simple resistance mechanism.
It occurred to me that the “heating due to irritation” claim would be simple to test. So we scooped bees into a covered cup, rolled them in powdered sugar, and measured their temperature over 5 minutes as they struggled in a clump, using both a thermal probe and an infrared thermometer (Fig. 3).
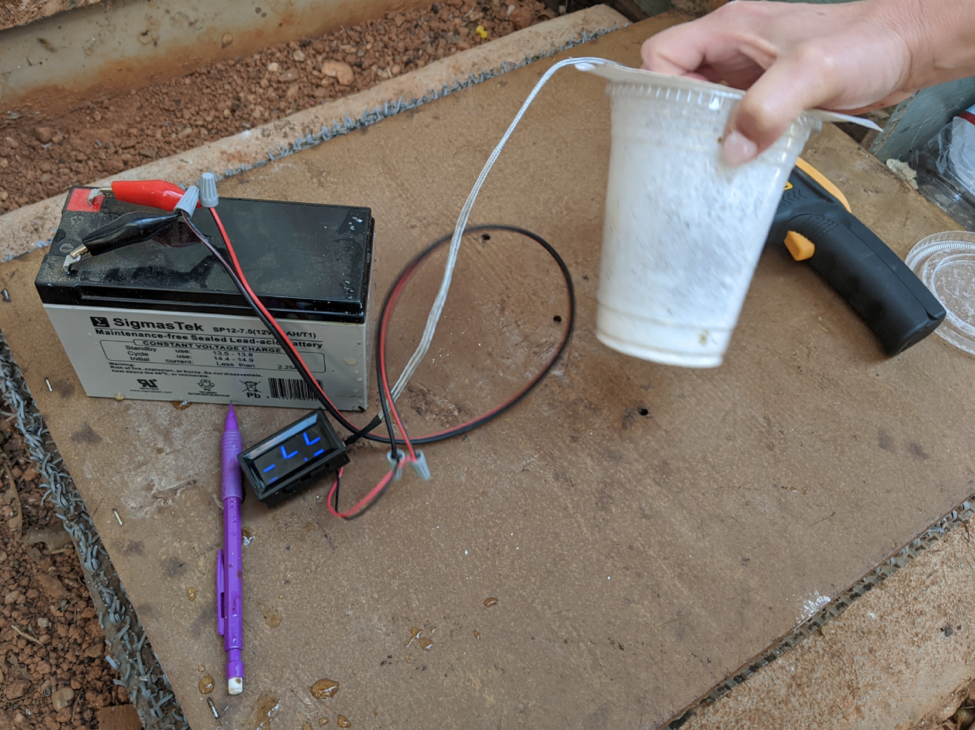
Figure 3. To our great surprise, the temperature of the pile of bees slowly warmed from around 86-90°F to a maximum of only 95-96°F – right at broodnest temperature! We got the same results in a second replicate. These results do not support the claim that mites release due to the heating of the bees after rolling them in powdered sugar.
So, if it’s not the heating, do you really need to beat the bees up with a hard shaking? We made a bunch of shaker jars to see. For our first test, we rolled a half cup of mite-infested bees in enough powdered sugar to thoroughly coat them (Fig. 4), then inverted each screen-topped plastic jar over a cup to catch any mites that dropped off of their own accord as the bees clambered around grooming themselves (Fig. 5).
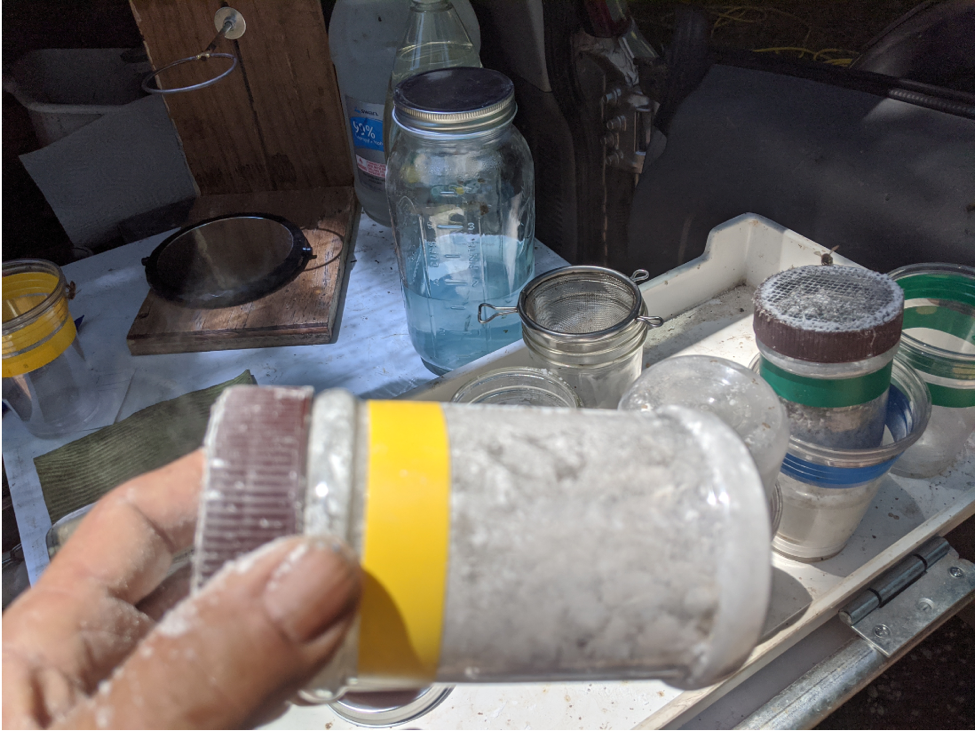
Figure 4. Rolling bees in powdered sugar to get the mites to release and lose their grip. Note the cup and magnifying mirror holder in the background, which we use for counting mites washed using detergent.
Practical application: I often see beekeepers using heavy glass Mason jars for the sugar shake. It’s far easier on the arm to shake a lightweight plastic jar, such as the peanut butter jar pictured above. You can cut the center of the lid out with a hole saw (or by other means), and then use hot glue to attach 1/8” hardware cloth.
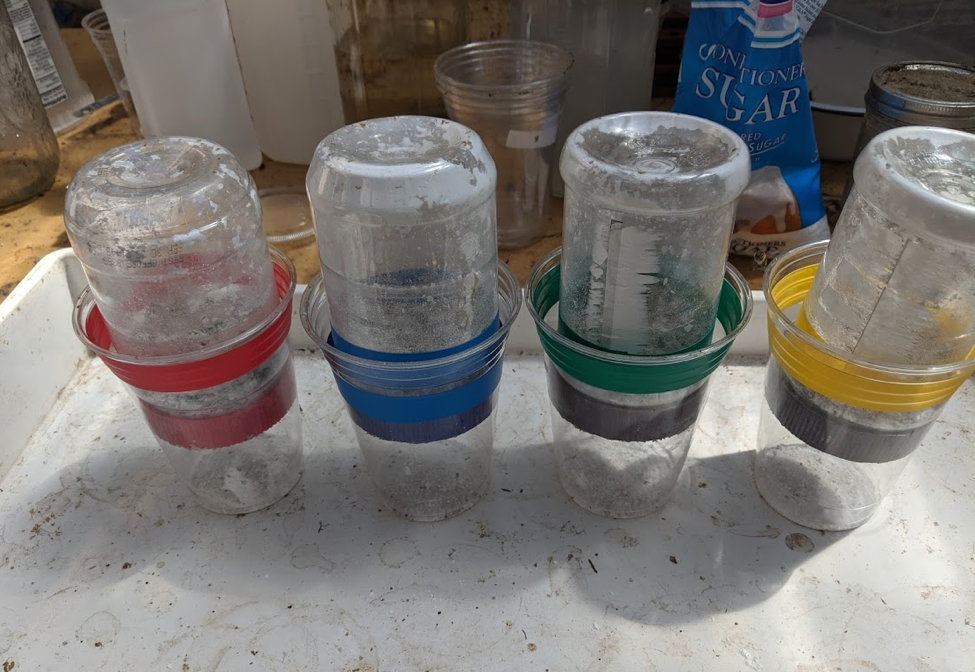
Figure 5. Once inverted, mites started dropping into the lower cups immediately. The photo above was taken after 15 minutes, by which time the bees had pretty well groomed the sugar dust off their bodies.
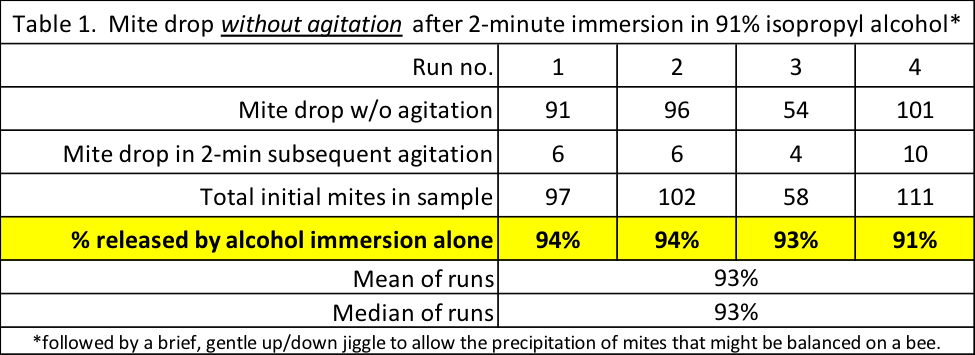
After allowing 15 minutes for the mites to drop, we washed the bees in detergent to recover any remaining mites (Table 1).
| Table 1. Mite drop from powdered sugar roll, no shaking. |
| Run |
1 |
2 |
3 |
4 |
| Drop from sugar alone |
58 |
48 |
75 |
62 |
| Drop from detergent follow up |
31 |
3 |
14 |
36 |
| Total mites |
89 |
51 |
89 |
98 |
| % drop from sugar dusting without shaking |
65% |
94% |
84% |
63% |
Wow, we thought – perhaps there’s no need to beat up the bees, slamming them up and down by hard shaking. There is clear release and dislodgement of the mites without any shaking, so maybe all that you need to do to sift them out is to just bounce the bees gently up and down a bit.
So I performed 15 sugar roll shakes — 5 gentle, and 10 vigorous. I allowed 60 seconds of rest after rolling the bees in powdered sugar, then immediately followed with 60 seconds of shaking, then a detergent “clean up” wash. I alternated hard and soft shakes, but since I was short on high-mite bees, after five disappointing soft shakes, I focused upon getting more data on the hard shake. Results: mite recovery was substantially better with a “vigorous” shake: giving a median 88% mite recovery in 60 seconds of banging the bees up and down in the jar (n=10), as opposed to only 59% for a soft shake (n=5) (I’ll show the histogram in my next article).
Practical application: as much as I hate to see bees being beaten by a hard shake, it appears that with powdered sugar, it is necessary in order to obtain decent mite recovery.
Michelle was curious as to whether the hard-shaken bees actually survive for long once returned to the hive. I’ve often watched powdery-white bees walk back into the entrance. Unfortunately, during our experiments, there was a weak nectar flow on, and after a shake, their disgorged nectar often left the bees sticky with dissolved sugar. I caged some of these bees, plus a control group, into the incubator. There was some mortality of the sticky shook bees held overnight, as opposed to zero mortality of sugared bees not shaken.
We realized that for a meaningful test, the bees would need to be returned to their hive, where their nestmates could groom the sugar from their bodies. So we paint-marked 600 bees shaken from a hive, 300 with yellow, 300 with blue. I then sugar rolled the blue bees and shook them for 60 timed seconds, by which time, they had gotten wet and sticky, and a number looked as though they were dying (Fig. 6). We then returned both groups back into their hive.
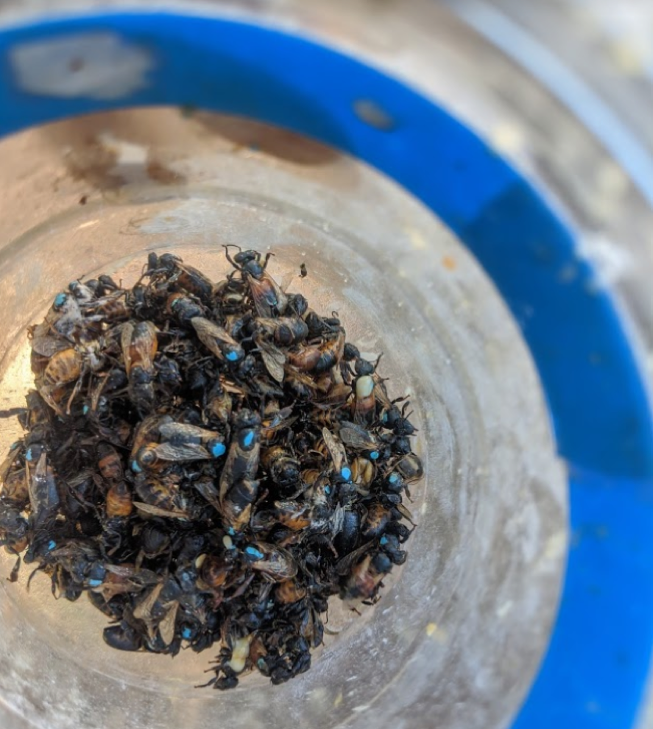
Figure 6. Marked bees after rolling in powdered sugar, then shaking vigorously for 60 seconds. Due to disgorged nectar, these poor bees look beat up, sticky, and bedraggled.
We placed a dead bee trap in front of the entrance, and checked it and the bottom board for casualties the next morning. Surprisingly, other than the three yellow control bees that we expected to find dead due to their having stung me as I put them into their container, I found no dead blue-marked bees. This experiment needs to be repeated.
Practical application: I’ve long wondered whether the traumatized hard-shook bees survive after you’ve returned them to the hive. It appears that they can, at least overnight.
Back to Mite Washing with Liquid Release Agents
Review of the steps
Allow me to refresh you on the four steps involved in a mite wash or sugar roll.
Step 1: To cause the mites to release their grip on the bees.
Step 2: To then dislodge the mites from the bees’ bodies.
Step 3: To then agitate or wash the bee sample enough to allow for the precipitation of the mites through the tangle of bee bodies, and finally
Step 4: To separate the mite sample from the bee sample, typically by allowing the much-smaller mites to drop through a screen.
During a sugar shake, the mites precipitate through air, and thus fall rapidly. No so when they must sink through a liquid, such as alcohol or water.
The Precipitation (Sinking) Rate of the Mites
In the first installment of this series, I showed how we obtained much better mite recovery in mite washes by using 91% alcohol rather than 50%. Was this due to the greater toxicity of the 91% alcohol, or because of its lesser density? Since alcohol is less dense than water, we’d expect mites to sink more quickly in alcohol of higher concentration.
If you’ve shaken mites into water while performing a sugar shake, you likely noticed that they will float for a while, but that is not because they are less dense than water, but rather because of their hydrophobic (water-hating) cuticle. If you add a bit of detergent to the water, they will immediately begin sinking, albeit not as quickly as they sink in alcohol (ditto for bees, which turns out to be important).
As I was typing this article, I wondered just how dense mites actually are, compared to water or alcohol. So I did my usual thing – got up from the keyboard and performed a kitchen investigation to find out. I washed some mites off of bees using detergent in water, then quickly rinsed and drained them on a sieve before they could absorb any water. I then filled a tall jar with water and a bit of detergent, and checked its density (actually specific gravity) with a hydrometer, confirming the instrument’s calibration [[8]].
I dropped mites into the water and watched them sink to the bottom. Then I added salt bit by bit to increase the density of the solution, dropping mites in again at each 0.01 increase in density. They kept sinking, although slower and slower, until I reached a specific gravity of 1.1, at which point they stayed in suspension or floated (Fig. 7).
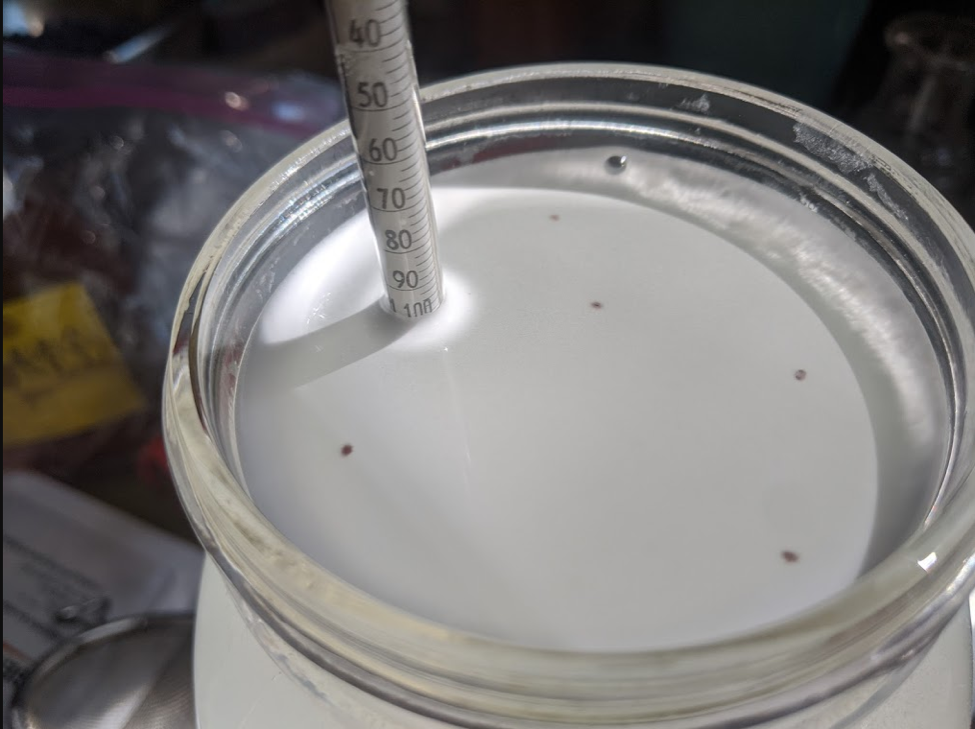
Figure 7. Ignore the tiny bit of foam at the top – it’s an artifact of dissolving salt in water. Once mites stopped sinking (you can see some floating, others hung suspended in the water column), I had a figure for their density which I could compare to that of water and alcohol (Fig. 8).
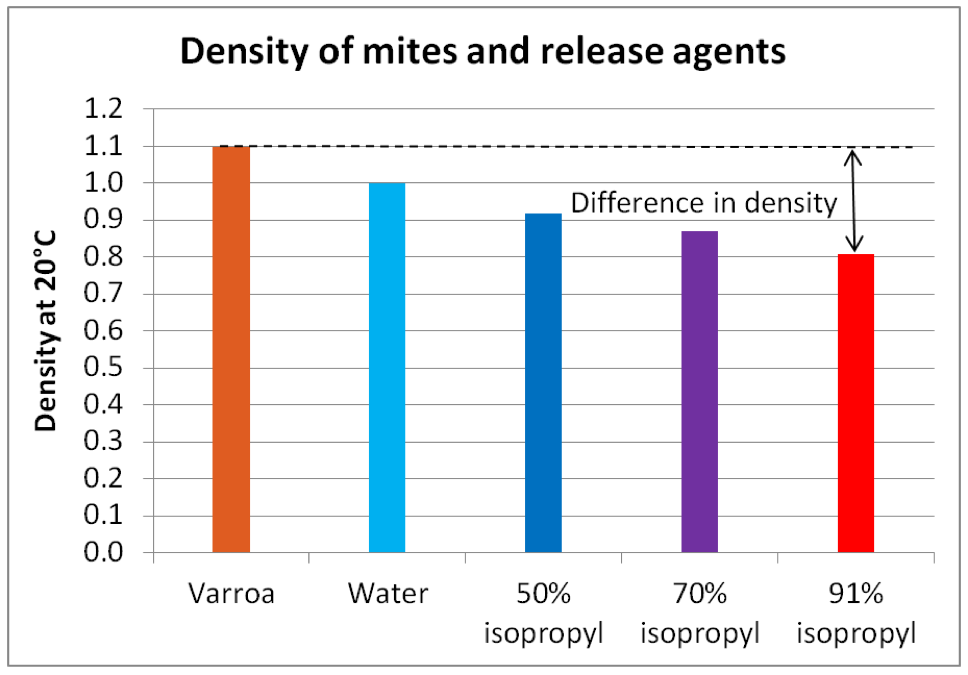
Figure 8. The greater the difference in density, the faster something will sink. Note that mites are not much denser than water, but considerably more dense than 91% alcohol [[9]]. This is confirmed by my field observations that mites sink more slowly in a detergent wash than in an alcohol wash.
But would the small differences in densities between the alcohols make much difference in the sinking rate of mites? Besides density, there is also the molecular attraction of mite cuticle to the alcohol or water, as well as viscosity (liquid “friction”). I needed to run a test. I first measured the maximum distance that a mite might need to precipitate through the alcohol (Fig. 9).
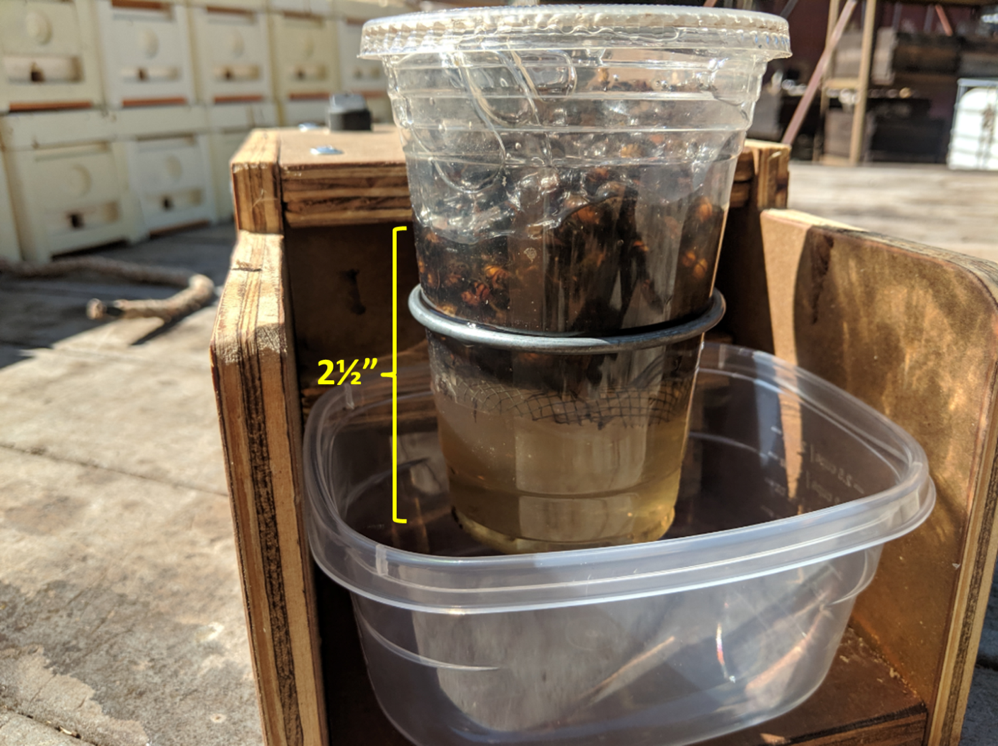
Figure 9. I live in California’s Gold Country, and have plenty of experience in precipitating gold flakes through gravel when panning or sluicing. The same principles apply to dropping varroa through bee bodies. In the mite wash cups that we use, a mite may need to sink as much as 2½ inches. I want them to do so in less than 60 seconds.
Assisted by my assistant Brooke Molina, I shook live mites from bees using powdered sugar. Using soft forceps, I dropped them one at a time into a graduated cylinder filled with a concentration of alcohol to be tested. We watched as the mite began to sink, the sugar dissolved, and the mite reached its terminal sinking velocity. Brooke would then hit the stopwatch as the mite passed the marked start and finish lines (Fig. 10).
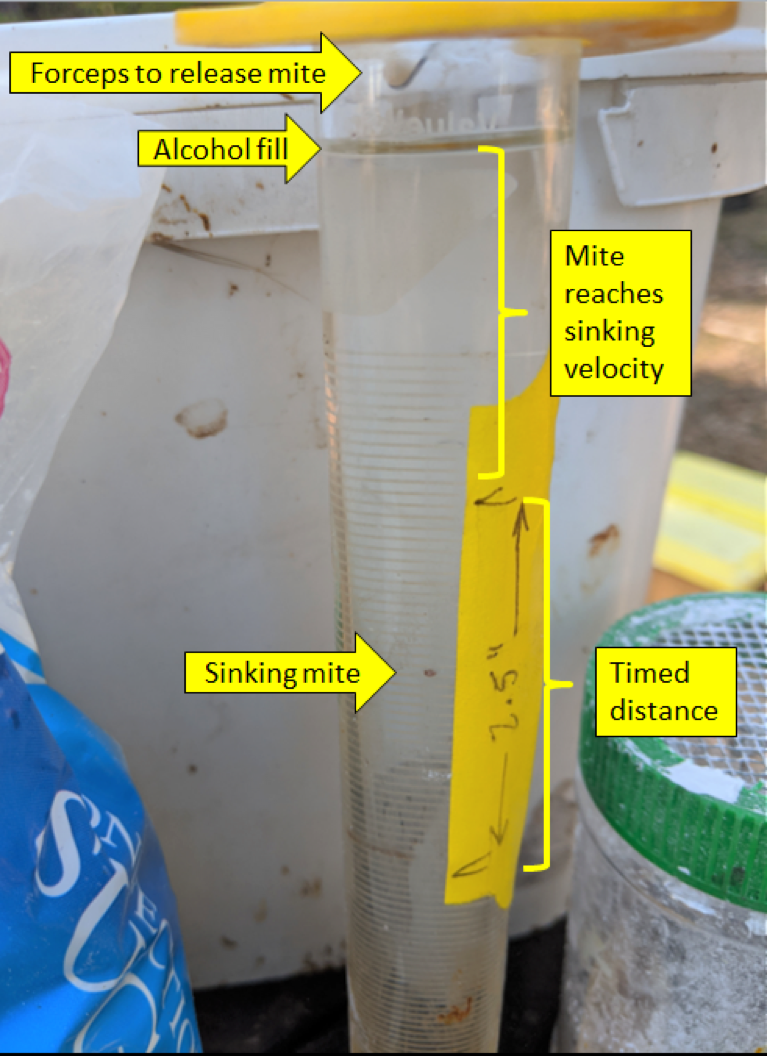
Figure 10. We timed the sinking rate of 51 mites in all. There was some variation, but a clear difference between alcohol concentrations.
Rather than showing you a bunch of calculated means and statistics, I feel that a picture is worth a thousand numbers. For this sort of information, I like histograms (frequency distributions), which allow your own brain to look for patterns (Fig. 11).
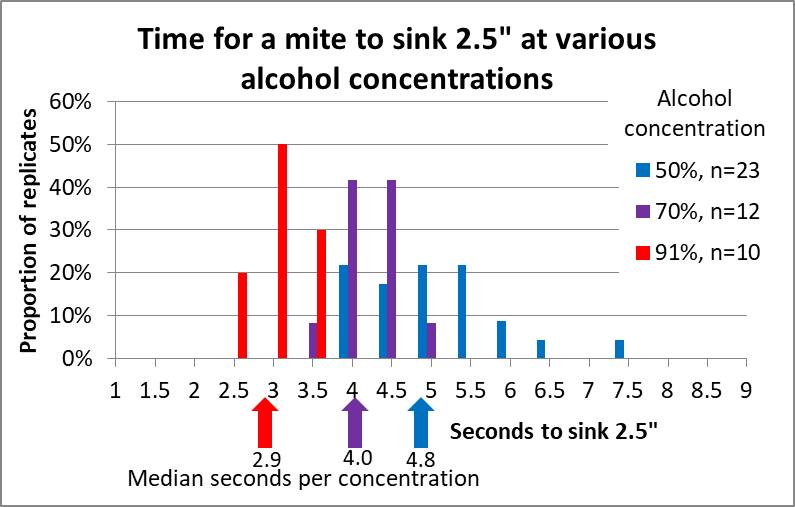
Figure 11. It only takes a mite around 3 seconds to sink 2½” in 91% alcohol (the clump of red columns), compared to nearly 5 seconds (on average) in 50% alcohol (with wider clump of blue columns).
Since I my agitators run for 60-seconds, the difference between sinking for 3 or 5 seconds is likely not going to make a huge difference – so long as there is no vertical agitation stirring them back up.
Practical application: When washing mites, swirl rather than shake up and down – up-and-down shaking simply keeps stirring the mites back up into the bees. When using 91% alcohol (or Dawn detergent), there is actually little need to agitate to achieve mite detachment – you only need to keep the bees in motion in the solution so that the mites can precipitate down through their bodies.
What I’ve learned so far
This has been quite a learning experience for me. I’ve now covered release and dislodgement of the mites, and their precipitation. The sugar shake requires hard agitation, whereas some of the liquid release agents require scant agitation. I’ve learned that with the better methods, that you can recover 95% of the mites in 60 seconds.
In my next article, I’m going to focus upon the liquid release agents, to try to figure out why some work well, and some don’t.
A Spoiler
Since alcohol is in short supply, I’ve been asked by many beekeepers what they can use for monitoring varroa, and I don’t want to make you wait until I publish my full results next month.
Practical application: I’ve switched to using Dawn Ultra dishwashing liquid (my data is from using the clear “Lemon essence” product), which works very well for mite washes, on par with 91% isopropyl, and better than any other release agent I’ve tested. Disclaimer: I have no connection with, or interest in, the manufacturer of any products. I’ve tested Dawn dishwashing liquid and two other detergents (which weren’t impressive); but other foaming detergents may work as well.
Dilute the Dawn at the rate of 1-2 tablespoons per gallon of water. A weaker solution is less efficacious, and there is no benefit to making it stronger.
Don’t agitate immediately – instead allow the bees to soak in the solution for a full minute before agitation, by which time most of the mites will have already dropped to the bottom of their own accord. Final agitation should be a swirl action, with no up and down shaking. Little agitation is required for basic mite monitoring.
For counting after agitation, a wonderful trick I’ve found is to build a stand to hold the mite wash cup 4 inches above the face of a 6-inch diameter, 10x magnifying mirror (makeup mirror) placed horizontally below the cup. 10x is the best magnification, and 6″ diameter the best size. Looking down, this gives you a greatly enlarged view of the mites (you can see their legs) and makes counting a piece of cake (Figs. 4 & 12).
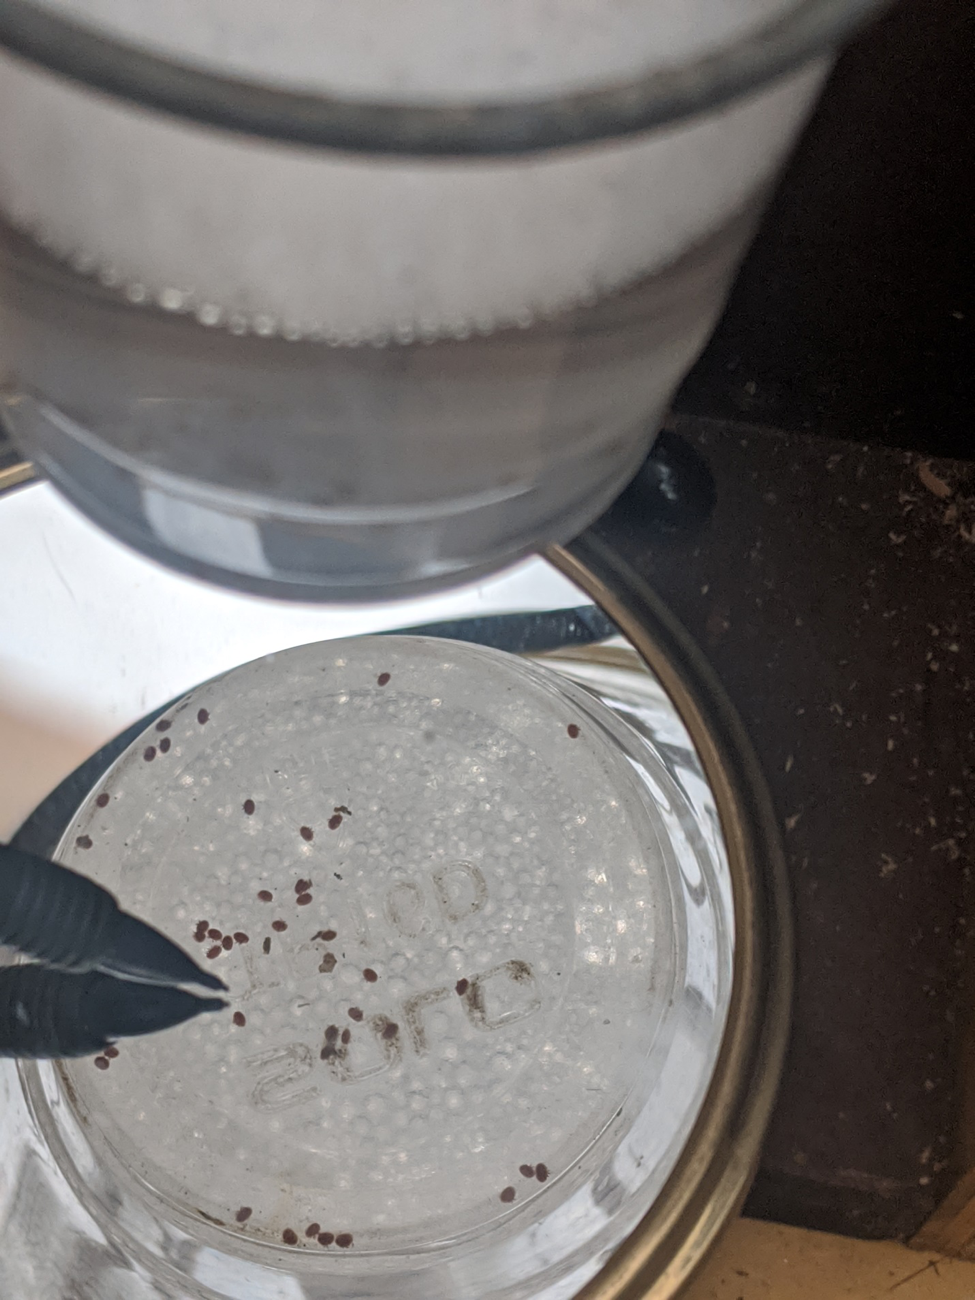
Figure x. Viewing from the bottom up means that the foam from the detergent is not a problem. Since your treatment threshold should be no more than 6 mites, counting is a breeze. Since I often count in the 50’s to 70’s for testing, I’ve found that it helps to close one eye for counting, and use a pointer.
Warning: a magnifying mirror, casually placed, can easily start a fire should the sun hit it. The focus point is a few inches from the mirror, and sunlight through a truck window is enough to start a fire within seconds (practical experience by my sons). ALWAYS place the mirror into an opaque holder when not in use!
Next month: the result of testing various solutions, and trying to understand why some work better than others.
Acknowledgements
My research is supported by donations from beekeepers. If you find it to be of benefit, I appreciate donations at ScientificBeekeeping.com. I also thank Peter Borst, Brooke Molina, and Michelle for their assistance.
References
[1] Fakhimzadeh K. (2000) Potential of super-fine ground, plain white sugar dusting as an ecological tool for the control of Varroasis in the honey bee (Apis mellifera), Am. Bee J. 140: 487–491.
[2] https://scientificbeekeeping.com/powdered-sugar-dusting-sweet-and-safe-but-does-it-really-work-part-1/
[3] Macedo, P, J Wu & M Ellis (2002) Using inert dusts to detect and assess varroa infestations in honey bee colonies, Journal of Apicultural Research, 41(1-2): 3-7.
[4] https://digitalcommons.unl.edu/cgi/viewcontent.cgi?article=2174&context=extensionhist
[5] https://gpmb.unl.edu/varroa-sugar-roll-sampling
[6] Cooper, P, et al (1985) Temperature regulation of honey bees (Apis mellifera) foraging in the Sonoran Desert. J. exp. Biol. 114: 1-15.
[7] Bernd Heinrich (1996) How the honey bee regulates its body temperature, Bee World, 77:3, 130-137.
[8] Before any nitpickers write to correct me, I converting all the specific gravity figures to densities with regard to temperature.
[9] Lebo, R (1921) Properties of mixtures of isopropyl alcohol and water. J. Am. Chem. Soc. 43(5): 1005–1011.
Refining the Mite Wash : Part 4
Comparing the Release Agents
Randy Oliver
ScientificBeekeeping.com
First Published in ABJ in October 2020
As I tested different release agents for varroa monitoring, I was often surprised by the results, which then raised new questions about why some worked better than others. So I ran a number of experiments in order to tease out possible answers.
Varroa Management is about Reducing Virus Transmission
Varroa mites build up in colonies at a predictable rate (easy to visualize with my recently-updated interactive mite model [[1]]). Similar to dealing with the coronavirus, an in-hive Deformed Wing Virus epidemic can be prevented by suppressing the transmission rate of the virus within a hive. That can be accomplished by keeping the varroa infestation rate (mites per hundred bees) low at all times of the year.
Practical application: The best way to deal with varroa is to be proactive rather than reactive — keep in mind that the main problem with varroa is that it is the vector for Deformed Wing Virus. Your colonies will be healthier and more productive if you never allow infestation rates to climb above around the 2-3% level (6-10 mites in a mite wash or sugar shake). As with the coronavirus, it’s easier to nip the epidemic in the bud, rather than trying to wrestle varroa/DWV back under control after they’ve established a raging infestation.
What with the coronavirus epidemic, we’re hearing about testing for the prevalence of infected individuals. This is exactly the same reason for performing mite washes — to determine the prevalence of mites in a sample of a half cup of bees. What we want is an “accurate” test — one that doesn’t miss any mites (its sensitivity), nor overcount mites due to misidentification.
There are two parts to the mite wash test:
- The mechanics — efficiently separating the mites from the bees with a release agent, agitation, and precipitation through a screen,
- Accurate counting (involving an error-prone human) — which involves putting on your reading glasses so that you don’t miss any mites (false negatives) or count hive trash as a mite (false positives).
Practical application: In my experience, beekeepers commonly fail on both counts — using poor method or technique for the wash, and then not correctly recognizing mites. When doing field demonstrations I often perform a mite wash, silently count the mites (let’s say 5), write it on my palm, and then pass the cup around for others to count out loud. I nod as I hear counts ranging from 1 to 15 mites from the same cup! Then I hand the cup to a twenty-something, who invariably calls out the same count as on my palm.
So test yourself. Put on your reading glasses, and run a few mite washes, saving the mites (Figure 1) until you have 10 in total. Then shake those 10 mites back on top of the last sample of bees, rewash them, and see if you get a count of 10 again. Repeat a few times until you are confident in your technique.
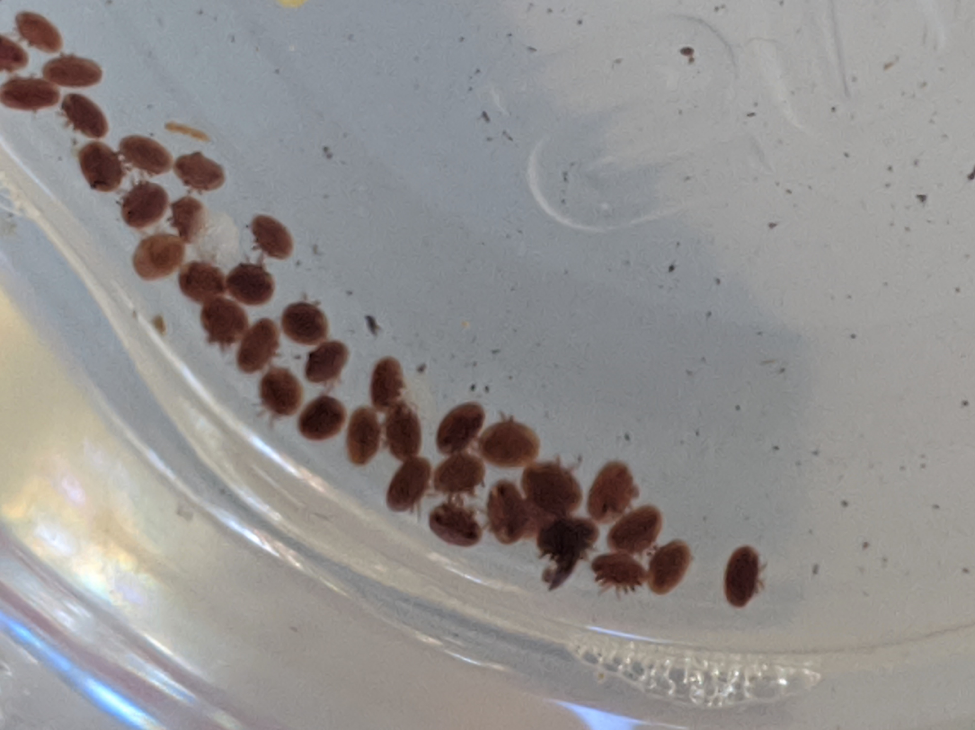
Fig. 1 Recovered varroa mites are brownish-orange, oval, with eight legs, and all roughly equal in size (smaller or larger objects are not mites). A magnifying mirror makes them easy to see from below. Note the mite on edge, the fourth in from the right.
Once you’ve gotten your mechanics and counting method down, now it’s up to using a good release agent (powdered sugar or a liquid). Since we do a lot of mite washes in our operation (well over 2500 a season), I personally want a release agent that consistently gives me at least 95% mite recovery with only 60 seconds of agitation (mechanical in my case). Since we reject potential breeder queens if their colony’s mite count is over 1 at the first assessment, it’s imperative that we recover every single mite.
So when alcohol became scarce due to COVID, I decided to test other release agents.
Questions Raised
After some preliminary testing, I had a number of questions about why certain liquid release agents worked better than others:
- How quickly does the liquid immobilize or kill the mites or the bees?
- Was the immobilization due to toxicity of the liquid?
- Do the mites release due to irritation by the liquid, or is it something else?
- Or is it due to the wetting (surfactant) action?
- Does it make a difference that bees float in some liquids, but sink quickly in others?
- Is there a value to delaying agitation once the bees are submerged?
In order to answer the above questions, I performed experiments involving over 400 washes in all (that’s over 30 pounds of mite-infested bees).
Practical application: In order to calculate sensitivity (or to test the efficacy of treatments) a common mistake is to use bees with low infestation rates. The problem in doing so is that the 100% difference between a mite count of 1 or 2 has far too much inherent error. So I perform my testing with bees from colonies with sky-high counts, from which I can determine meaningful differences in results. To that end, I ask my sons to intentionally allow some second-year colonies to go untreated, for me to use for testing and experiments. That means that we must sacrifice many colonies each year, and appreciate the donations from beekeepers to help us to cover that cost.
Testing of Release Liquids
In order to answer the above questions, I chose for preliminary testing liquids that had different alcohol concentrations, degree of toxicity, strong or weak surfactant value, or contained known mite irritants (Figure 2).
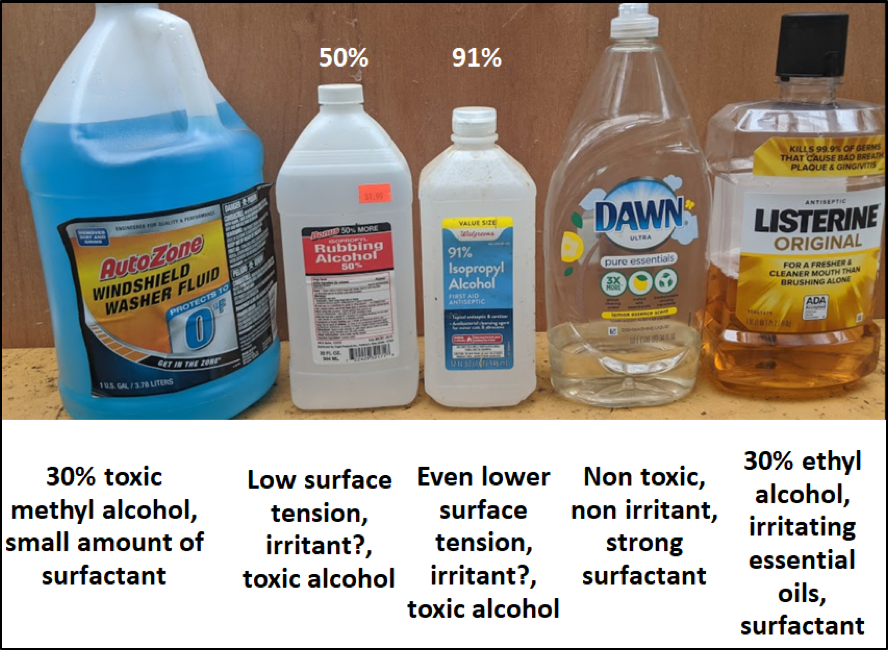
Fig. 2 I chose a range of liquids for my preliminary testing, each with different properties. Not shown are additional liquids added after the preliminary testing (-15°F windshield fluid, and two additional detergents).
Surfactants, Detergents, and Foaming Agents
Due to their water-repellent exoskeletons, bees or mites dumped into plain water float on the surface for a while. So we need a release liquid that deals with that. Alcohol is not only a great solvent, but it also reduces the surface tension of water, thus acting as a wetting agent (proportional to its concentration). This wetting action causes bees and mites to quickly sink, and is likely responsible for disrupting the grip of the mites’ empodia upon the bees.
There are other agents that reduce surface tension, collectively called surfactants. Surfactants may act as detergents, wetting agents, emulsifiers, foaming agents, or dispersants. The foaming agents allow bubbles to form at the air-water interface, with Dawn dishwashing liquid being well known to soap bubble aficionados [[2]]. (Note that alcohol does not cause foaming.)
Other detergents are known for their cleansing properties or ability to suspend oil and grease in water by forming micelles (such as low-foaming Cascade automatic dishwasher detergent). This property also disrupts cell membranes (the industrial detergent Triton x-100 is commonly used for this purpose).
In Part 1 of this series of articles I mentioned previous research by De Jong [[3]] and Rinderer [[4]] that indicated that one could successfully use detergent for mite washes. But not all detergents are the same. I had no idea whether it was the foaming action, wetting action, “cleansing/oil emulsification” action, or cell membrane destruction that most affected mite drop, so I eventually tested a variety of detergents, each with different properties (Figure 3).
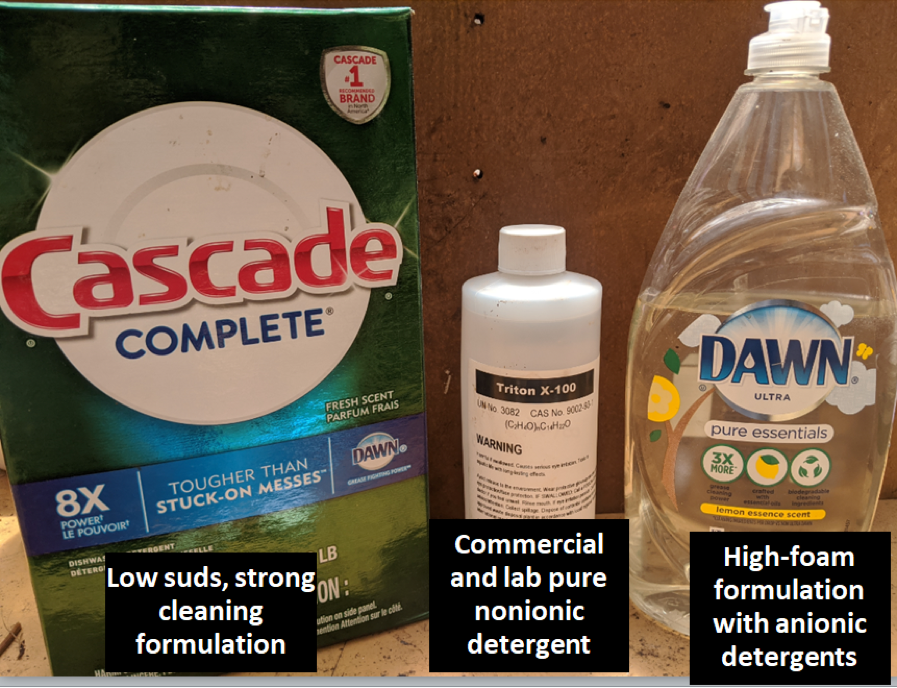
Fig. 3 In addition to Dawn, I tested Cascade and Triton x-100 (widely used in labs and industry).
Practical application: I performed a number of runs to determine the optimal dilution of Dawn Ultra (I used the clear Lemon Essence). At less than 1 tablespoon/gallon, mite recovery dropped off. Above 2 Tbl/gal, it didn’t improve. So the optimal dilution appears to be in the 1-2 Tbl/gal range. For the others, I used 2 Tbl/gal of Cascade, and the 2% solution of Triton x-100 recommended for general use.
Dawn Ultra contains two surfactants [[5]], sodium laurel sulfate and sodium laureth sulfate (both have a number of alternate chemical names). These surfactants are commonly used as foaming agents and detergents, and are relatively safe to use (they are common ingredients in toothpaste and shampoo) and biodegradable [[6]]. Just don’t dump them directly into waterways, as any surfactant can harm aquatic life.
Irritants
I was curious as to whether adding an irritant would improve the mite drop due to a surfactant. Listerine fit the bill, since it contains not only alcohol and a surfactant (Figure 4), but also four compounds known to be irritating and toxic to varroa (Figure 5).
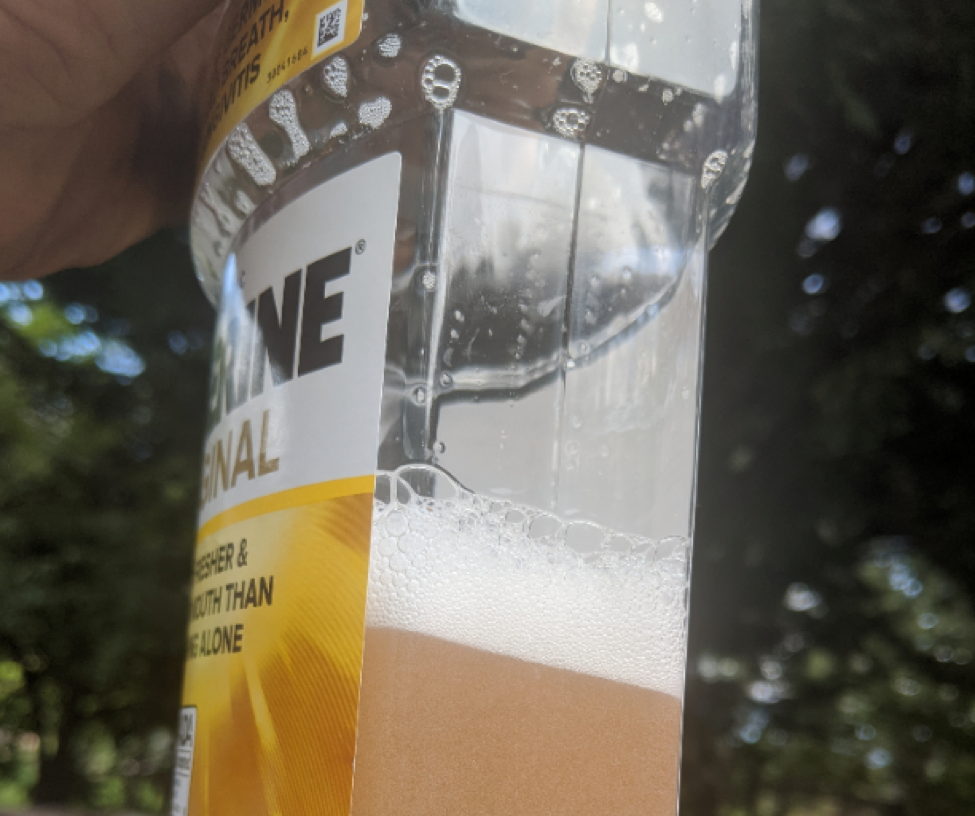
Fig. 4 Listerine clearly contained a foaming agent.
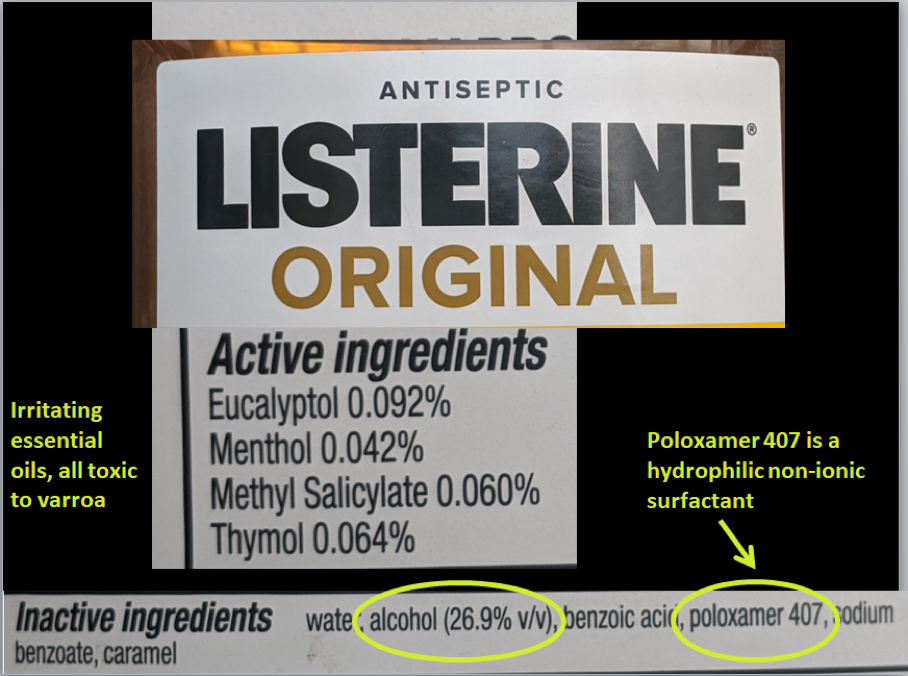
Fig. 5 Listerine also contains a goodly amount of ethyl alcohol, which allows it to dissolve small amounts of the oils of eucalyptus, mint, wintergreen and thyme, all well-known to be irritating and toxic to varroa mites. I wondered whether they would cause the mites to release and/or die.
Windshield Washer Liquid
Although not all the ingredients are listed on the bottle, low-temp windshield washer fluid is said to be typically made of distilled water, methanol as a solvent and antifreeze, a surfactant or detergent for cleaning, and coloring. Approximately 20-25% methanol is typically added to keep the fluid in liquid form at 0°F (-18°C). I was surprised by the minimal foaming action of the two types that I tested (Figure 6).
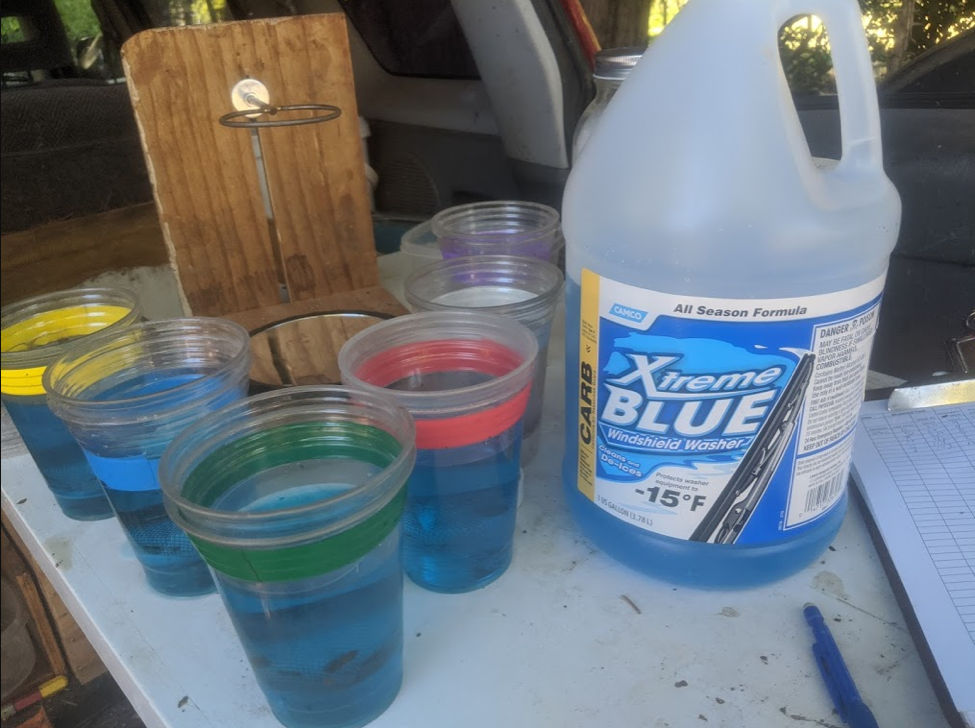
Fig. 6 In California, the lowest temperature windshield fluid allowed for sale is -15°, which it took me a while to find. In this photo, you can see the stand for counting mites with a magnifying mirror in the background (the wash cup fits into the ring above the mirror). The windshield fluids that I tested exhibited little wetting action on the bees.
Instructions for fabricating the wash cups shown above can be found at [[7]].
Immobilization Action and Toxicity to the Mites
Is it important to kill the mites to get them to release? In order to determine the toxicity of the liquids to varroa, I agitated bee samples for 60 seconds in each liquid, then poured the dropped mites into a sieve and immediately rinsed them with water (Figure 7).

Fig. 7 Rinsing the mites with water after a minute of agitation in the test liquid.
I then shook the mites onto filter paper and allowed them to air dry, inspecting them at regular intervals for signs of movement (Figure 8).
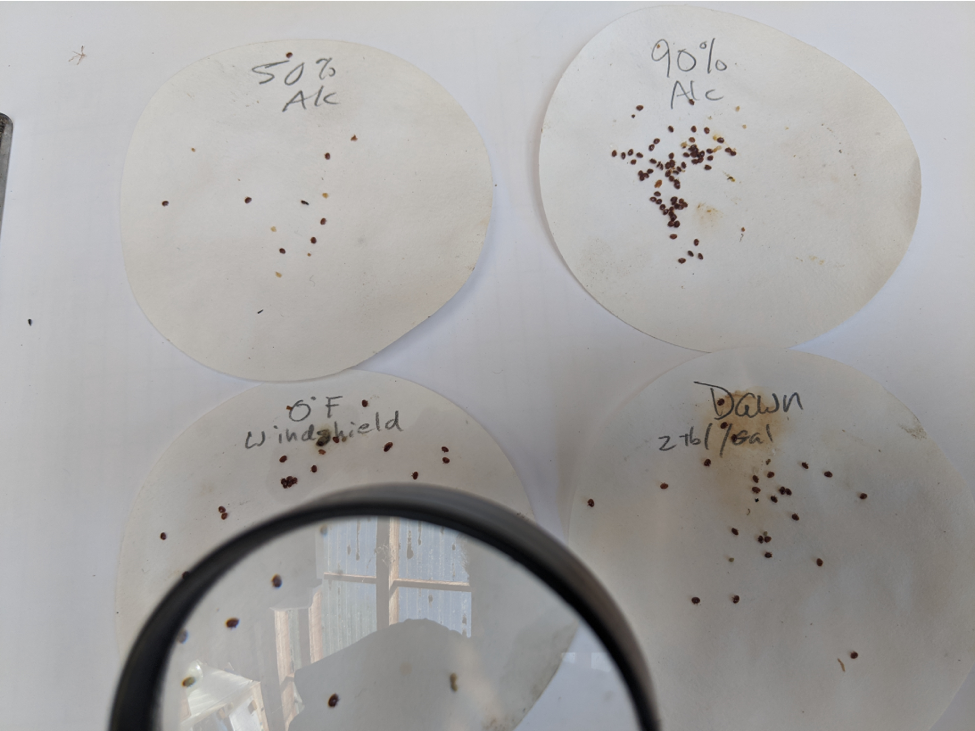
Fig. 8 There were large differences in the degree of immobilization of the mites, as well as in how long it took any survivors to recover and walk away.
The results are summarized below (Figure 9).
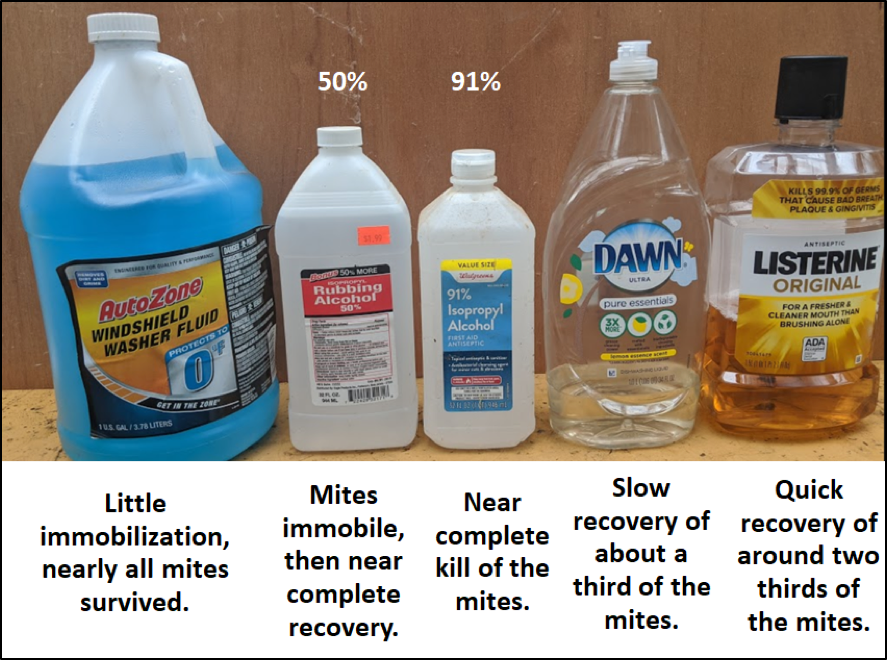
Fig. 9 The mites laughed at the windshield fluid and 50% alcohol, died in 91% alcohol, very slowly recovered after immersion in Dawn, but surprisingly, most quickly recovered from Listerine.
Practical application: My testing indicated that killing the mites does not appear to be critical to getting them to release.
Do the Bees and Mites Drown?
It is commonly said that one can use a soap or detergent solution to drown bees. But that didn’t make sense to me, since the bees die in less than a minute in a solution of Dawn, whereas I knew that bees could hold their breath for much longer. So I dumped equal amounts of bees into diluted Dawn or plain water, and held them underwater with a screen, jiggling them to remove air bubbles. After 60 seconds of immersion without access to air, I dumped them out on paper (after quickly rinsing the Dawn-exposed bees with water), and waited to see how many of each group survived (Figure 10).
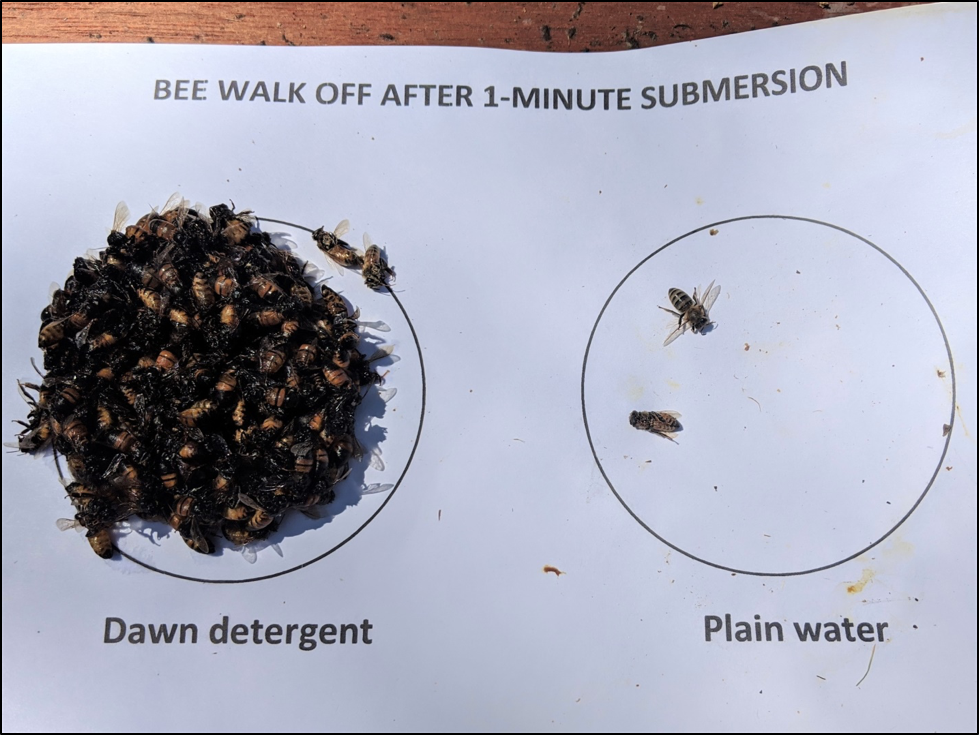
Fig. 10 I dumped equal amounts of bees, at the same time, into the rings, and placed the paper over the top bars for several minutes to allow any live bees to return to the hive. I didn’t run statistics, but there was a dramatic difference between the two test groups. Bees in Dawn clearly don’t die due to “drowning.”
As explained by Colorado State Extension [[8]]:
How soaps and detergents kill insects is still poorly understood. In most cases, control results from disruption of the cell membranes of the insect.
I suspect that the surfactant action of detergents allows the solution to penetrate the bees’ and mites’ spiracles, and then once inside their trachea, disrupt their cellular membranes, causing rapid death. A search of the literature found a study that came to a similar conclusion [[9]]:
Mites immersed in 0.2% Triton X-100 died rapidly … We postulated that the hypo-osmolarity of the distilled water caused an osmotic influx of water into the mite tissues and this was exacerbated in the presence of Triton X-100 which may have allowed water to enter through the spiracles more rapidly with the reduced water tension.
So at this point, I needed to run more tests.
Mite Release without Agitation
Still curious, I tested Dawn, Listerine, 91% isopropyl alcohol, and windshield fluid for the degree of mite release without agitation. I set up a row of six cups, filled each with whatever fluid I was testing, and then sequentially immersed the same sample of about a quarter cup of bees 10 seconds at a time down the row of cups (Figure 11).
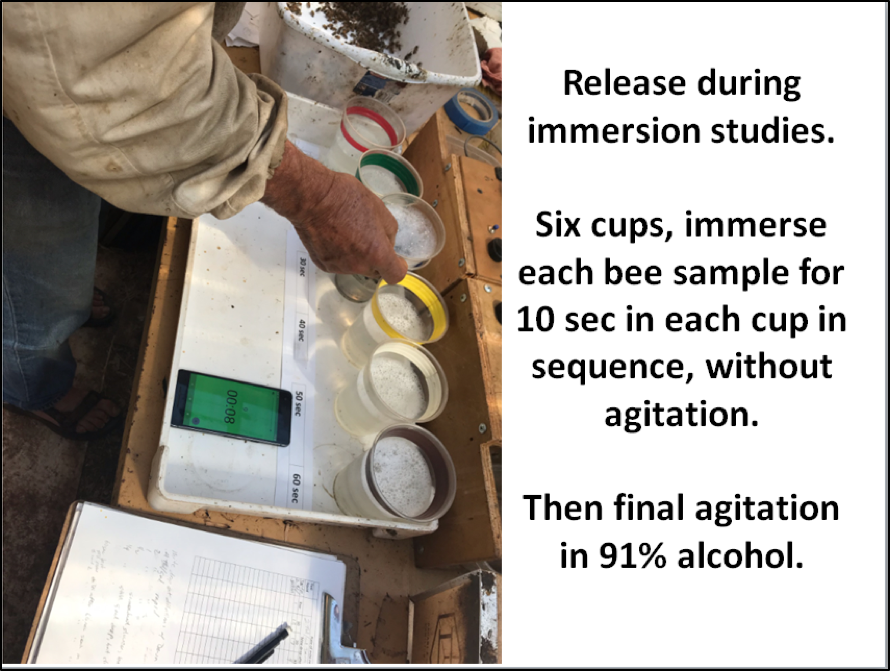
Fig. 11 After the bee sample had gone through the six cups, for a total of 60 seconds of immersion, I agitated them for 300 revolutions in 91% alcohol for final mite recovery. The results are shown below (Table 1).
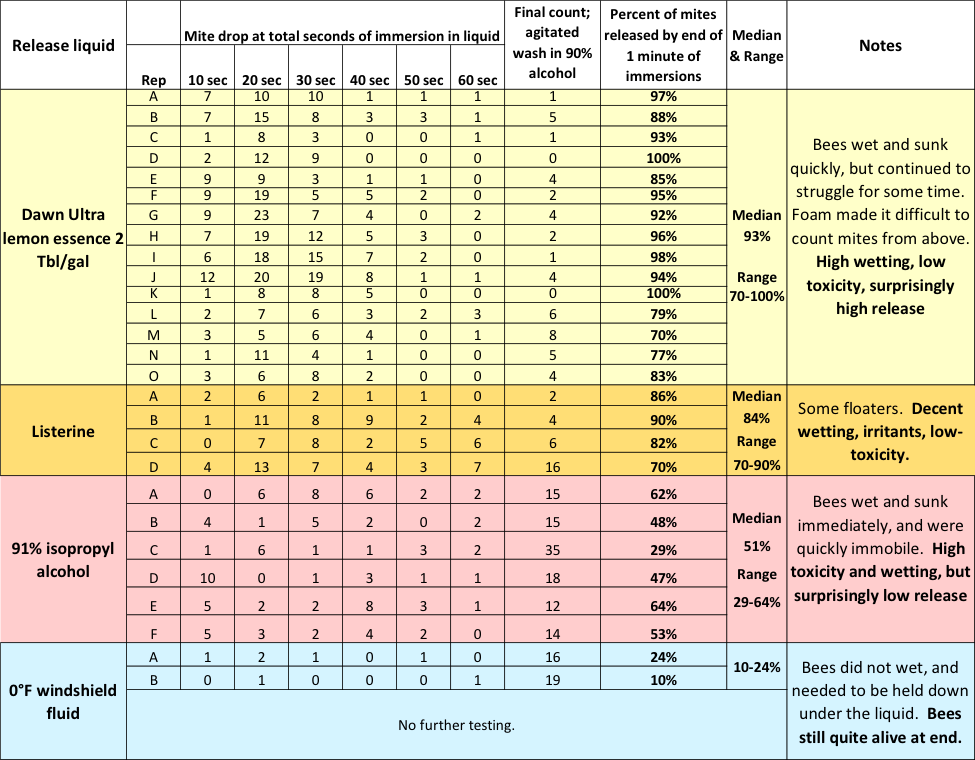
Table 1 Note the progression of mites dropped during each 10 seconds, without agitation, over the course of a total of 60 seconds of immersion in different liquids. With Dawn, I obtained a median total mite drop, without agitation, of 93%. The detergent considerably outperformed 91% alcohol (median 51% drop), which greatly surprised me.
So could Dawn actually outperform 91% alcohol? Incredulous, I ran another test, this time allowing the bee sample to sit in the 91% alcohol for a full minute at a time, repeating for a total of 3 minutes of immersion (Table 2).
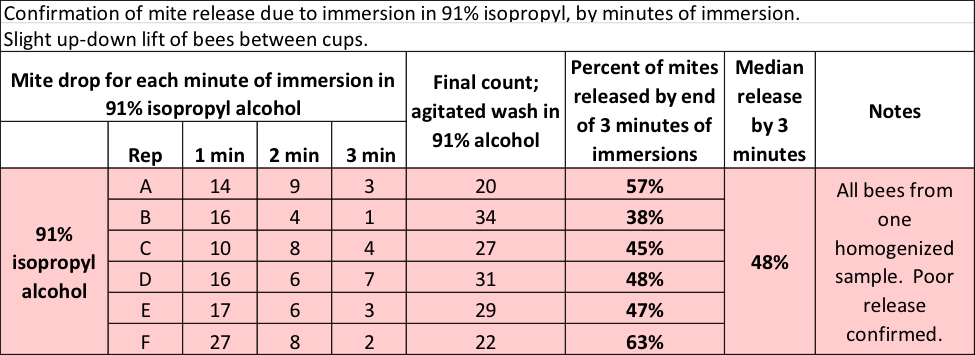
Table 2 Even with three minutes of immersion in 91% alcohol, only half the mites hit the bottom.
It was clear that Dawn was outperforming alcohol. But how?
Why the Difference in Results with Alcohol?
I was flummoxed by why 91% alcohol performed so poorly, after getting nearly twice the rate of mite drop in a previous test. And then I realized that in my previous test, the bees were only one layer deep. The difference was apparently due to how thick the layer of bees is that the mites need to precipitate through after they release their grip.
- In 91% alcohol, the bees and mites wet quickly and sink until they hit the screen, where they lie immobile. As the mites continue to release, half of them drop through the screen, but those that drop from the upper layers of bees get stuck in the bee bodies below.
- In Dawn detergent, the bees wet, but take a while to sink. During the first 30 seconds, they move around. That apparently allows the mites to precipitate down through the moving bees. When I do the math for the Dawn test in Table 1, a median of 88% of the mites dropped from the bees without agitation in the first 40 seconds.
Practical application: When using Dawn, most of the mites drop to the bottom of the cup in the first 60 seconds, due to the movement of the bees themselves. After that, only minimal agitation — swirl action, not shaking — is necessary to precipitate the rest of the mites. Take-home: Allow the bees to set in the cup for at least a minute before you begin agitation.
Results of the Tests
OK, now to the real meat of the issue — how do the various liquids compare when you add agitation? I used my mechanical agitators to provide a standardized circular agitation of 300 revolutions over 60 seconds.
The graphs below summarize over 130 different mite agitations. Rather than giving you a bunch of numbers, box plots, and statistical analysis, I decided to present the data as normalized histograms (so each color of columns adds up to 100% of the reps for each release agent). A histogram is a frequency distribution, allowing anyone to use their own eyes to detect a pattern, and to see the amount of variation. The more sensitive the release agent, the further to the right the columns will be. I’ve included for reference a vertical dotted line to indicate recovery of better than 95% of the mites (Figures 12-15).
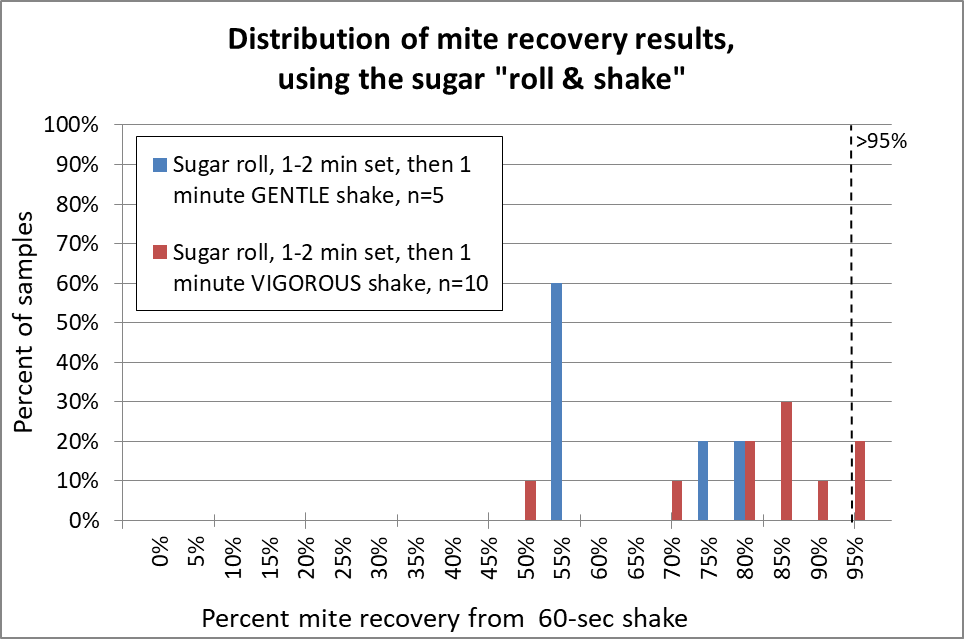
Fig. 12 The sugar roll clearly requires vigorous shaking (red) in order to recover a high percentage of the mites; gentle shaking (blue) doesn’t do it. Note that even when I carefully performed sugar roll/shakes with very vigorous up-down shaking, in two of the samples I obtained 70% or less mite recovery, which might seriously underestimate the actual infestation rate. In only two of ten reps did I obtain 95% mite recovery.
My recovery was not nearly as good as that of Vesco [[10]], who claimed 94% mean (instead of median) mite recovery, but from low-mite colonies. My results were more in line with those of Macedo [[11]] for high-mite samples, but much better than that of Flores [[12]]. Anyway, I really gave the sugar shake a good shot, but was not impressed. So how about alcohol?
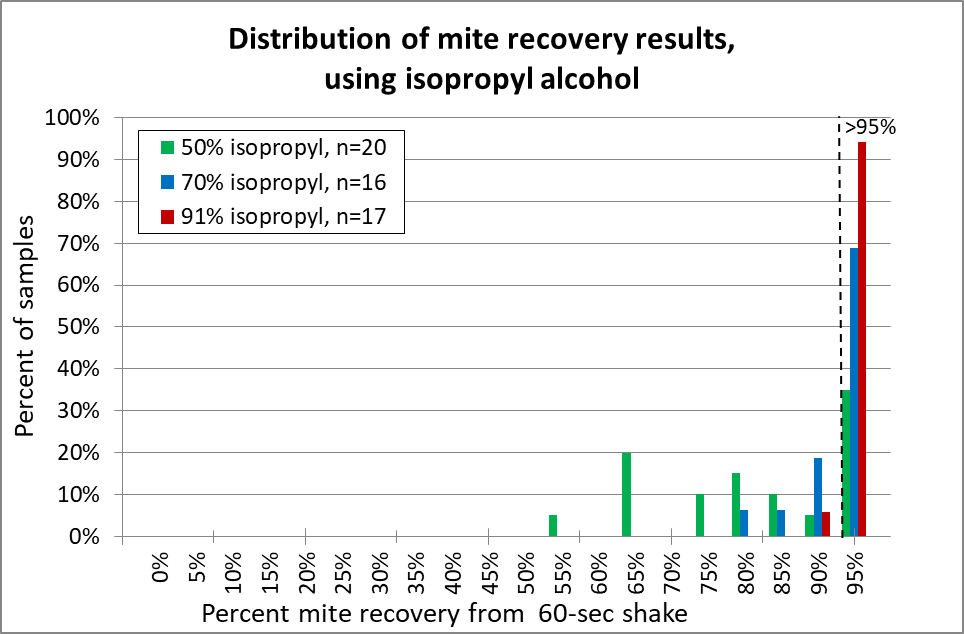
Fig. 13 With isopropyl alcohol, 91% (red) was the clear winner. I suggest that it be the standard (as opposed to 70% alcohol (blue) to which other release agents should be compared. 50% alcohol (green) is unreliable.
Practical application: 91% isopropyl alcohol is a bit pricey, is restricted for “organic” certification, and is flammable. So it’s worthwhile to look for alternatives.
How about two home products — windshield fluid or Listerine?
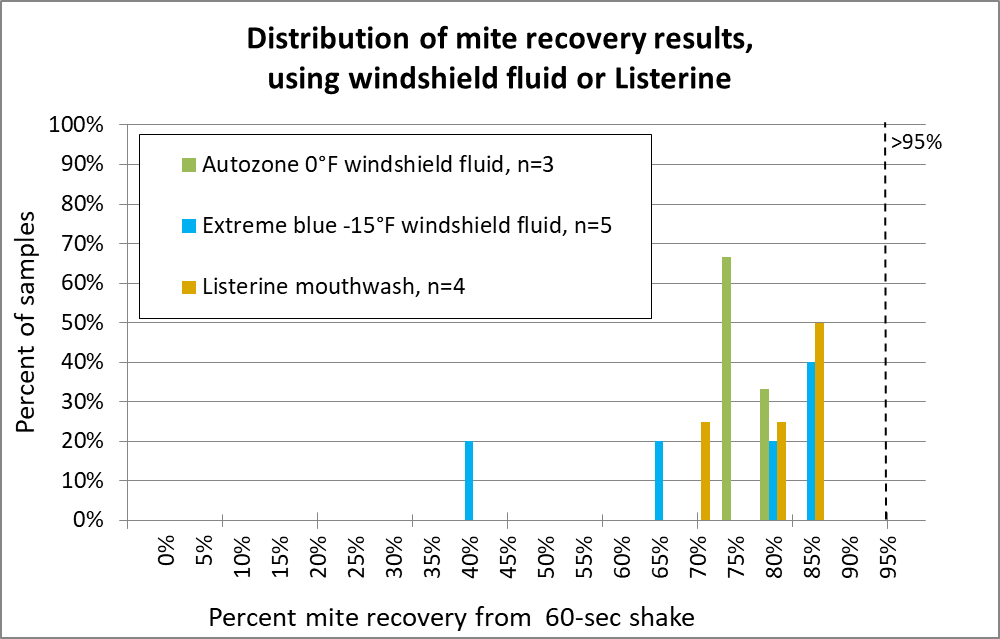
Fig. 14 I wasn’t impressed enough by windshield fluid to run many samples. And Listerine, despite its four irritating essential oils, also fared poorly. Canadians use a lower-temp windshield fluid, but one researcher told me that it was necessary to add additional alcohol for good performance.
So let’s move on to the detergents that I tested (no need to ask me about others, since I haven’t tried them). I allowed the bees to soak in the detergent first for a minute before agitation, and also compared Dawn with immediate agitation to see how much difference it made to wait.
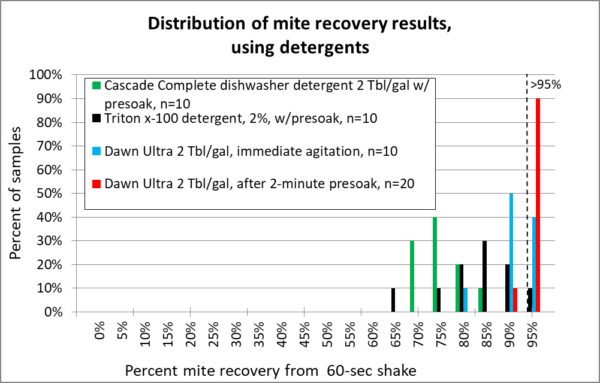
Note: Thanks to the keen eye of reader ShawnM, the concentrations used for the Dawn runs have been corrected from the original article. They are only 0.8%.
Fig. 15 The detergents. Low suds Cascade (green) really cleaned my equipment, but provided poor mite recovery. Triton x-100 (black) was a bit better, but didn’t make grade. For Dawn, note that I ran two different tests — one with immediate agitation (blue), the other after allowing the bees to first soak for two minutes (red). The presoak made quite a difference!
These results confirm those of De Jong and Rinderer that detergent can work well for mite washes, provided that you use the right detergent, and allow enough time for the mites to release [[13]].
The Winners
Isopropyl alcohol at 70% concentration has long been considered to be the “gold standard” for mite washes. But the 91% concentration is clearly more effective.
To my surprise, one dishwashing liquid, Dawn Ultra, not only performed equally as well as 91% isopropyl alcohol, but requires less agitation, is cheaper, and is non-flammable. We’ve now performed well over a thousand mite washes with Dawn, and are very pleased with it. I’m not stuck on Dawn — I suspect that any foaming detergent containing enough sodium lauryl and laureth sulfate would work well.
Practical application: For best results, allow the bees to sit in the detergent solution for a minute or two before agitation — most of the mites will have by then dropped to the bottom of their own accord. Then agitate by swirling, not shaking.
To avoid peering through foam to count mites, use a 10x magnifying mirror (6-inch diameter) placed about 4 inches below the bottom of the cup. Remove the bees above the mites, so that you are looking up at a white background (the sky through the solution) (Figure 16).
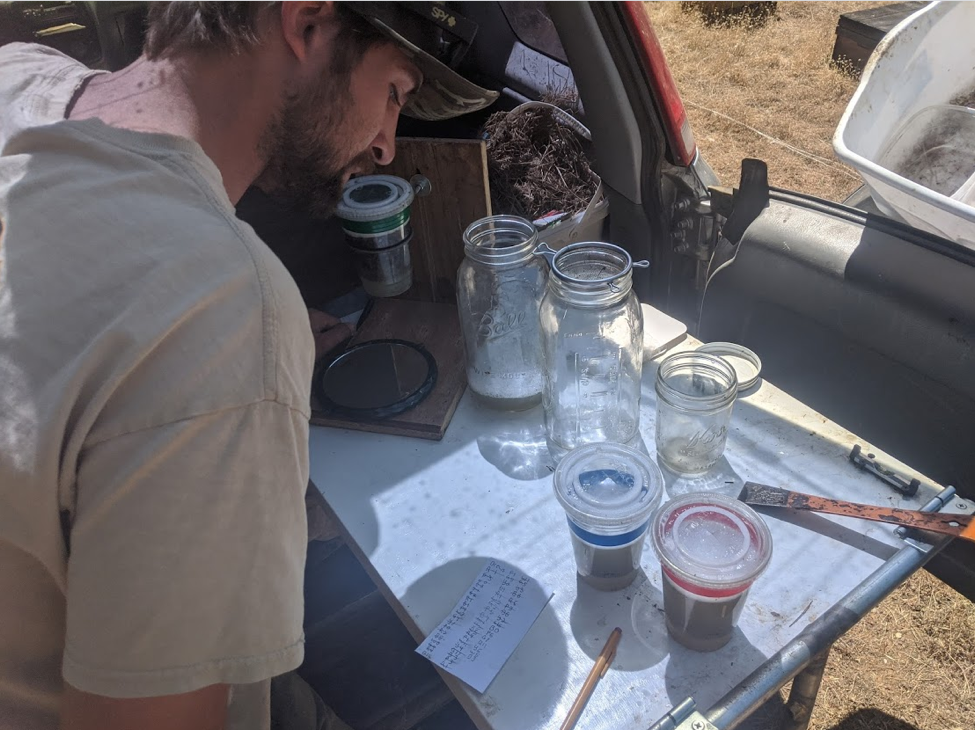
Fig. 16 One of our crew, Thomas McCluskey, at the mite wash table with a magnifying mirror stand. We use color-coded cups with matching hive markers to keep track of which count goes with each hive (the temporary checklist in front of him helps greatly to avoid confusion, as we routinely perform more than 50 mite washes at a sitting). We’ve developed a tried and true system, the details of which I’m happy to share with other beekeepers and researchers.
Being a penny-pinching beekeeper, I reuse the Dawn solution so long as it is foamy. It gets cloudy, but that’s not a problem if you are counting mites looking from the bottom up. I simply pour the used solution through a tea strainer to remove the mites.
Practical application: While performing mite washes today, my son Eric told me today that he prefers the scent of Dawn Lemon Essence over Lavender. I’m sure that this will be yet another subject of debate for beekeepers.
It takes only minutes to monitor your hives for varroa. You’ll enjoy healthier and more productive colonies if you maintain a low level of this virus vector in your colonies at all times.
Updates: Mites drop more slowly in detergent/water, so if you use my two-cup design for mite washing, be sure to lift the screened cup out slowly. We find that most mites have already dropped within a minute, even without agitation. I have not yet had the opportunity to quantify how little agitation is actually required.
References
[1] I’ve recently updated the model to make it more user friendly. Download it at https://scientificbeekeeping.com/randys-varroa-model/
[2] https://arstechnica.com/science/2020/02/physicists-determine-the-optimal-soap-recipe-for-blowing-gigantic-bubbles/
[3] De Jong, D, et al (1982) A comparative analysis of shaking solutions for the detection of Varroa jacobsoni on adult honeybees. Apidologie 13(3): 297-306.
[4] Rinderer, TE, et al (2004) Re-examination of the accuracy of a detergent solution for varroa mite detection. American Bee Journal 144(7):560-562.
[5] They are both anionic surfactants, having a negatively-charged oxygen molecule from the sulfate at the end of a carbon chain. Although they work well to “dissolve” fats into water, I suspect that it is their foaming action that is important.
[6] Bondi, CAM, et al (2015) Human and environmental toxicity of sodium lauryl sulfate (SLS): Evidence for safe use in household cleaning products. Environ Health Insights 9: 27–32. doi: 10.4137/EHI.S31765
[7] https://scientificbeekeeping.com/an-improved-but-not-yet-perfect-varroa-mite-washer/
[8] https://extension.colostate.edu/topic-areas/insects/insect-control-soaps-and-detergents-5-547/
[9] Ewan M Campbell, EW, et al (2010) Gene-knockdown in the honey bee mite Varroa destructor by a non-invasive approach: studies on a glutathione S-transferase. Parasites & Vectors 3: 73.
[10] Vesco, U & G Guido (2014) Sugar shaking for varroa monitoring: verifying repeatability, mite recovery rate and bee sample precision. 3rd World Symposium of Organic Beekeeping.
[11] Macedo, P, J Wu & M Ellis (2002) Using inert dusts to detect and assess varroa infestations in honey bee colonies, Journal of Apicultural Research, 41(1-2): 3-7.
[12] Flores, JM, et al (2015 ) Reliability of the main field diagnostic methods of Varroa in honey bee colonies. Archivos de Zootecnia 64(246): 161-165.
[13] Thanks to Dr. David De Jong for personal communication regarding details of his study.
I wrote about initial colony buildup at https://scientificbeekeeping.com/modeling-nuc-buildup/
I created a spreadsheet model that allows you to estimate and visualize how different methods of starting colonies affects the colony age structure and growth. I works for package, nucs started with laying queens, queen cells, or walkaway splits.
Nuc calculator May 2022
Refining the Mite Wash- Part 2
Mite Release
Randy Oliver
ScientificBeekeeping.com
First Published in ABJ in August 2020
The high efficacy of hand dishwashing detergent at getting mites to release their grip on bees bestirred me to investigate this finding more deeply. What I’ve come to realize is that there are four steps involved between dumping the bee sample into the agitation vessel, and the counting of the mites.
Mite release, dislogement, precipitation, and separation
We use the term “mite wash,” but that “washing” actually involves four discrete steps:
Step 1: To cause the mites to release their grip on the bees.
Step 2: To then dislodge the mites from the bees’ bodies.
Step 3: To then agitate or wash the bee sample enough to allow for the precipitation of the mites through the tangle of bee bodies, and finally
Step 4: To separate the mite sample from the bee sample, typically by allowing the much-smaller mites to drop through a screen.
So let’s go through these four steps one at a time, since each is important.
Getting mites to release their grip
As pointed out by Dr. David de Jong back in 1982 [[1]], mites attached superficially to a host bee are relatively easy to remove by shaking the bees in a liquid, but mites that are embedded deeply in the intersegmental membranes for feeding may be more difficult to dislodge. Curious to determine exactly how varroa mites hold onto a bee, I spent some time looking closely at them under the ‘scope.
Mites moving on the surface of a bee’s “hairy” body are able to get a tight grip by inflating sticky pads called “empodia” at the ends of their feet (Figure 1).
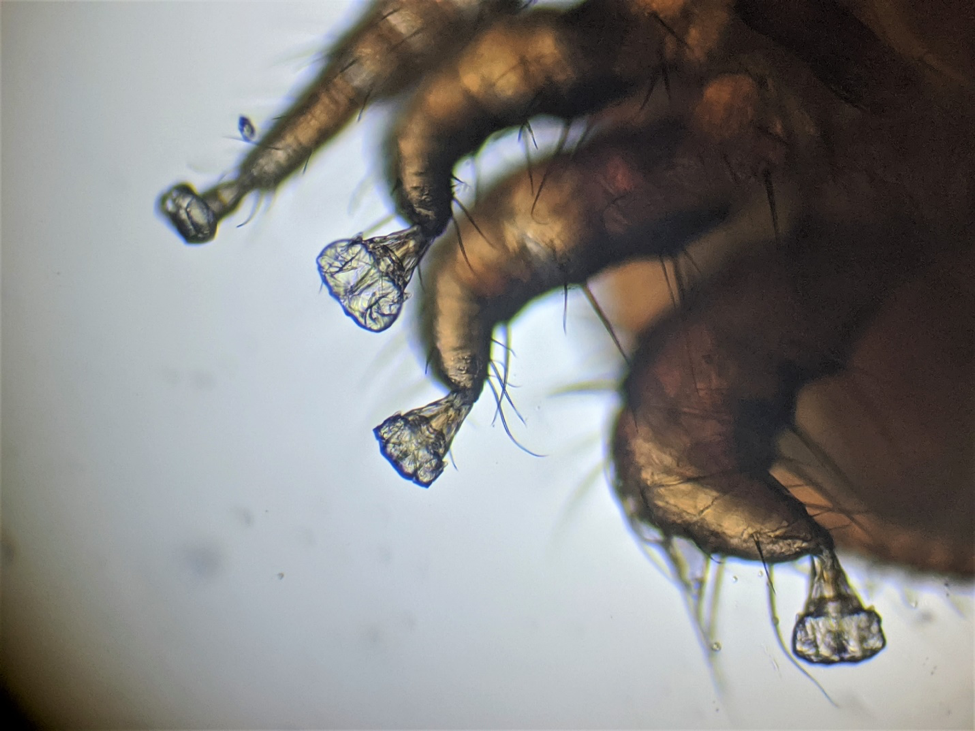
Figure 1. It’s fascinating to watch a mite walking across glass. At each step the mite inflates a sticky empodium. For the above photo I placed a live mite on its back on a microscope slide, and then dropped a thin glass cover slip over it. The mite will then walk upside down across the glass. The empodium of the uppermost leg in this photo is just starting to unfold; the next one down is fully extended on the glass.
The connection with oxalic acid treatments
I’m very much involved in experimentation on how best to use oxalic acid to control varroa. One poorly understood aspect is the exact mechanism by which the acid gets into the mites’ bodies. It appears that one main pathway is through their feet. The question then is, why would the feet be more permeable to the acid than the rest of the mite’s body? So I searched the literature for clues.
Of great interest is an important study by Peattie [[2]]. They found that arachnids (spiders, mites, and their kin) can secrete a thin film of sticky liquid on the surface of their empodia. I strongly suspect that it is this damp surface that allows the acid crystals to dissolve and thus make their way into the mite’s body tissue and/or hemolymph.
Practical application: the required stickiness of the empodia may be varroa’s Achille’s Heel, as far as oxalic acid is concerned. This is because in order for the mite to evolve resistance to the acid, it would need to come up with a new mechanism for getting a grip on the bee.
But I digress – let’s get back to mite washes.
Practical application: In order to break the adhesive force between the mites’ empodia and the bees’ exoskeletons, any mite wash fluid would need to act as a surfactant. Both detergents and high-proof alcohol act in this way. Powdered sugar also disrupts the grip, but requires the mite to first step on the sugar crystals to gob up its empodia [[3]].
It’s not just the feet
The empodia are clearly important to allow a mite to walk over the surface of a bee, but more often a mite is more firmly attached to a bee, with its head thrust deeply between the abdominal sclerites (the plates that cover the abdomen). To see this, you need to view bees from the underside (Figure 2).
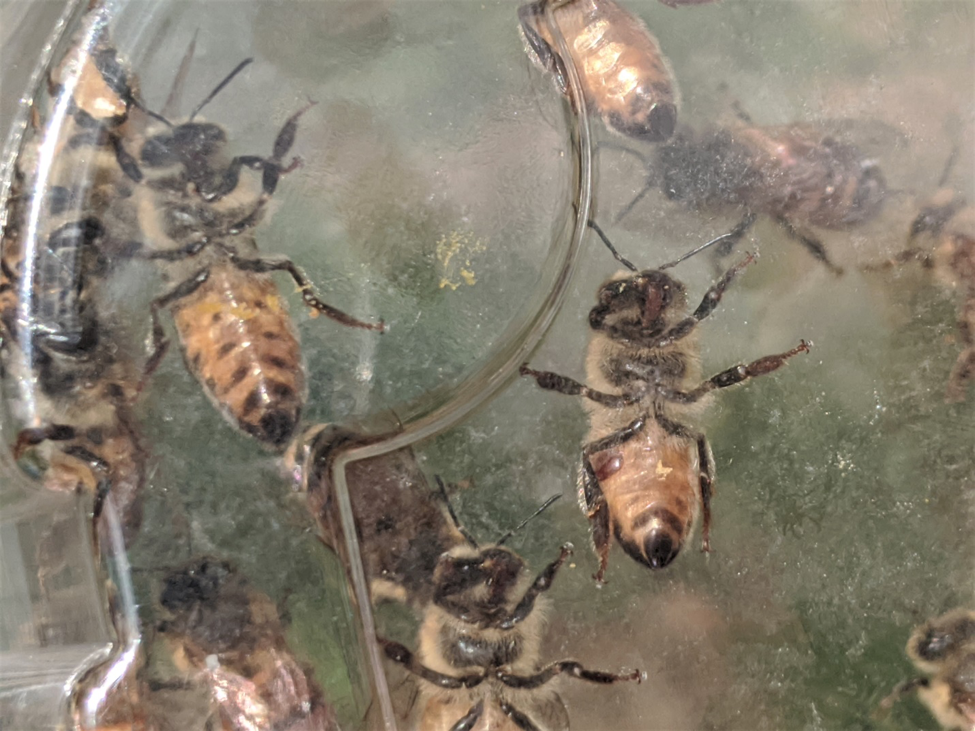
Figure 2. I shook some bees into a clear plastic clamshell food container so that I could view their bellies as they walked inside. Note the mite clearly visible on the underside of the bee to the right. I’ve gently lifted the sclerites on live bees, and am amazed at how deep a protective cavity they provide for a mite.
An alternative method for varroa monitoring?
While looking for attached mites, using the plastic clamshell food container, it occurred to me that this might actually be an alternative method of mite monitoring for those loathe to sacrifice bees in a mite wash (hey, I don’t like to kill bees either). While not as quick or accurate as a mite wash, this method certainly could be used for monitoring the infestation level of the adult bees.
Practical application: If you’ve got good eyesight and good light, you could dump a scoop of house bees into a clear plastic clamshell food container [[4]], and then scan the bellies of the bees to get a rough idea of the infestation rate. Allow any older bees fly off, close the lid, and give the remaining bees several seconds to calm down and spread out. I have no data as far as accuracy, but was easily able to differentiate an infested hive from a number of others in which I couldn’t find a single mite. As you’re likely used to hearing, more research is needed (any grad students listening?).
The anchoring of feeding mites
A bee clearly notices when a mite is walking over their body “hairs,” and generally responds by trying to groom it off. But once a mite gets its head under a sclerite, and appears to be firmly anchored in place, the bee seems to ignore it. My question then is, is there additional anchoring involved in addition to having sticky feet?
Ticks, which are related to mites, are often difficult to dislodge once they’ve drilled into your skin (personal observation). This is due to them having saw-like mouthparts (some photos worth viewing at [[5]]). Some ticks also secrete a bonding glue [[6]]. So I wondered what kinds of adaptations varroa has to anchor itself to a bee while feeding. I pulled out my microscopes and used my cell phone to take some crude photos. Figure 3 shows a ventral (bottom) view of a mite, showing its eight walking legs, and its sensory pedipalps between the front legs.
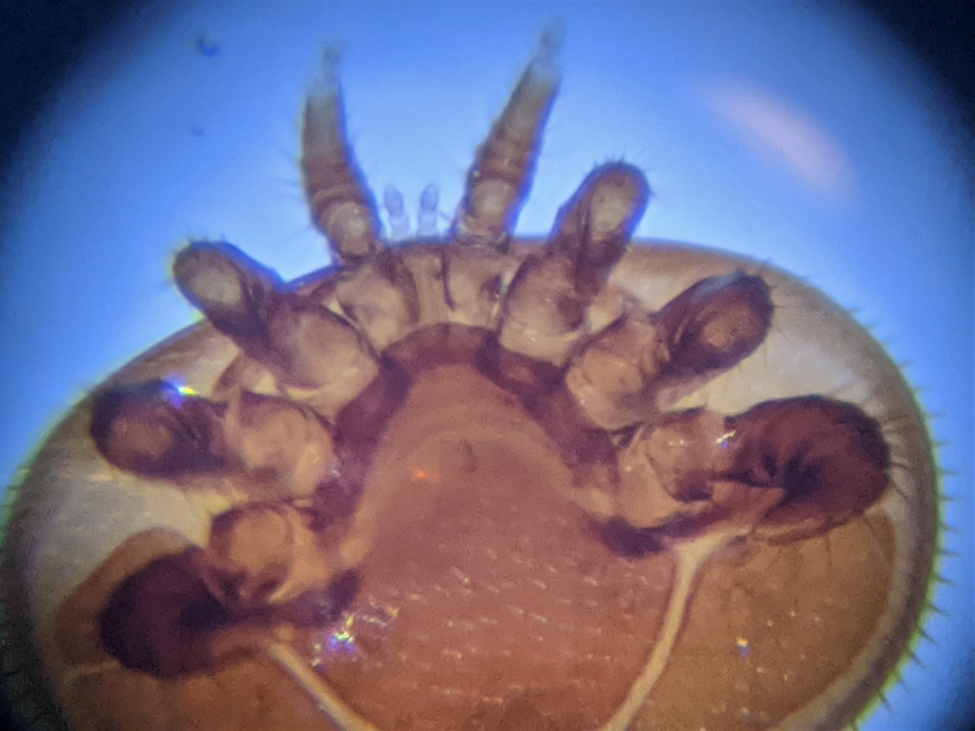
Figure 3. A ventral view of a female mite, with its pedipalps visible between the front legs. Between the pedipalps lie the chelicerae (mouthparts), not visible in this photo.
Let’s take a closer look at those palps, since they have curved, fanglike spikes near their tips (Figure 4).

Figure 4. A closer bottom view of the tips of the pedipalps, with the nasty-looking curved claws clearly visible. It’s apparently not yet completely clear just how the mites use those hooks. I wish to thank Dr. Samuel Ramsey for helping me with the identification of mite anatomy and function in these photos.
Between the pedipalps are the paired chelicerae – the mite’s mouthparts. There are also spines in the bottom of the chelicerae that appear to help anchor the mite into the feeding wound (Figure 5).
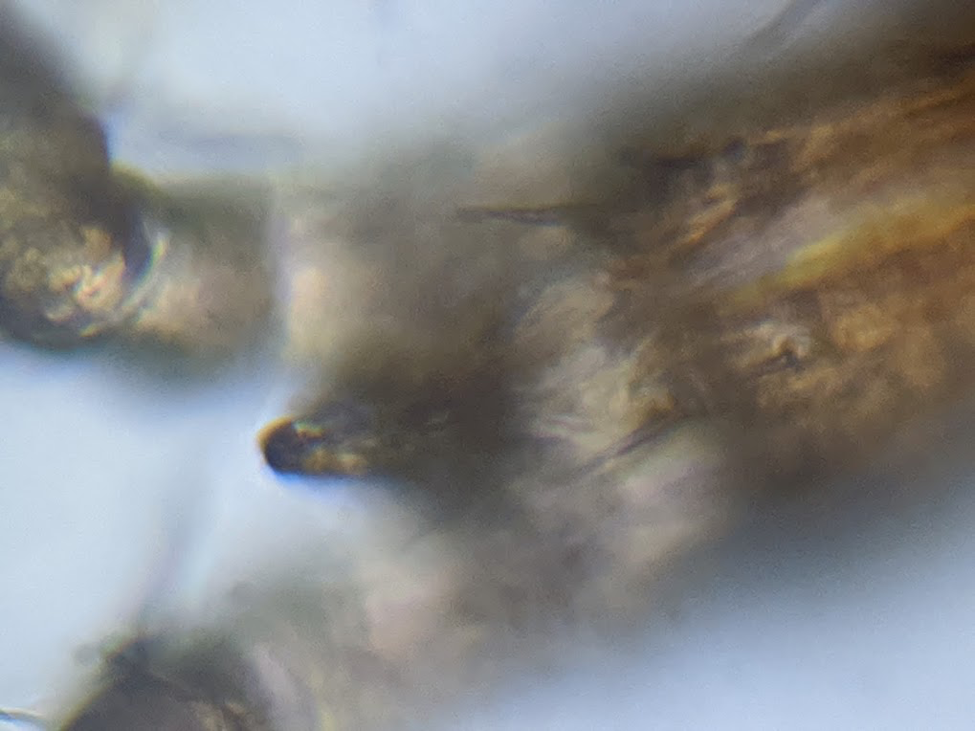
Figure 5. Note the two wicked-looking spines on this bottom view of a mite’s chelicerae (the dark pointed ends of the chelicerae are to the left). These spines appear to help to lock the mite’s chelicerae into the feeding wound.
I wanted to get a side view of the mouthparts, so I tried my hand at dissecting the pedipalps and chelicerae from some mites. I now have the greatest respect for Dr. Lilia De Guzman and other researchers who routinely dissect organs from a mite. My finest forceps and needles looked like blunt shovel handles under the ‘scope. But I was able to clumsily rip the mouthparts off an alcohol-killed mite and take a picture (Figure 6).
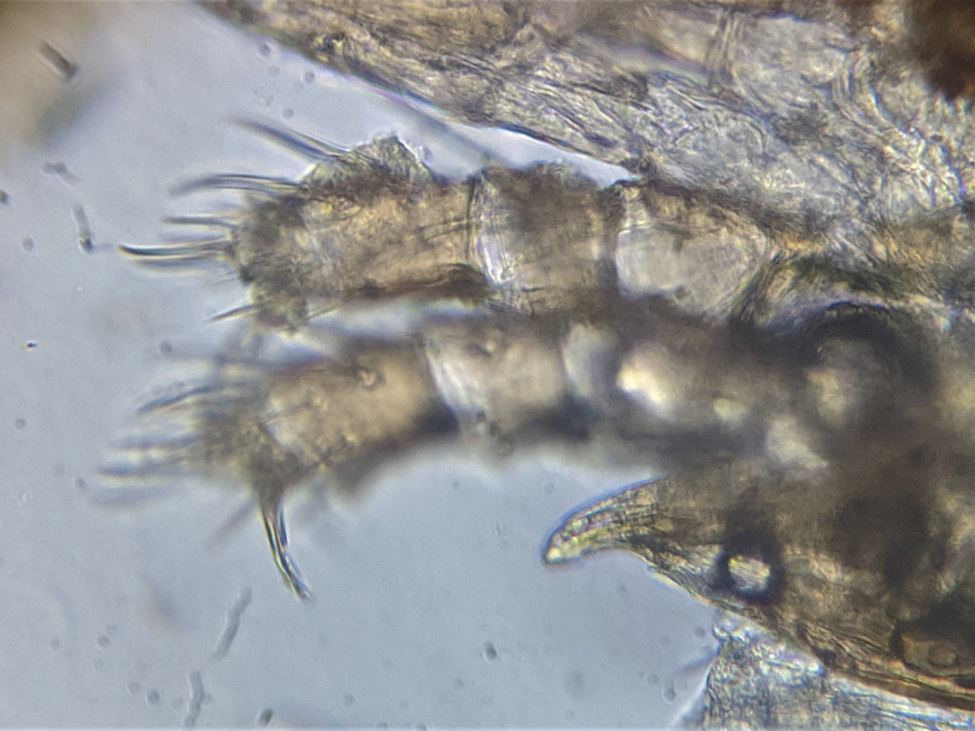
Figure 6. A side view of the feeding apparatus of a varroa mite. At the top are the two pedipalps, one with the curved spine partially in focus. Below is the blade-like end of one of the chelicerae (mouthparts) that penetrate the bee’s soft integument (the anchoring cheliceral spines are folded back in this image).
Ticks are able to alternately extend and retract their toothed cheliceral shafts to pull themselves into the feeding wound, analogous to how the reciprocating lancets of a bee’s stinger drives it through your skin. I’m not clear whether varroa does so, or to what extent it uses its hooks for anchoring.
It makes me cringe to think of having a parasite the size of a Dungeness Crab rip and stab its feeding apparatus between my ribs, but that’s what varroa does to the poor honey bee. So back to my question, how firmly are feeding mites anchored to the bee? To answer that, I needed to collect infested bees that had mites well-buried between their abdominal sclerites. Using the clamshell container described above, I identified some bees carrying mites. I then prodded, stroked, and tugged on several mites with forceps to see how firmly they were anchored (Figure 7).
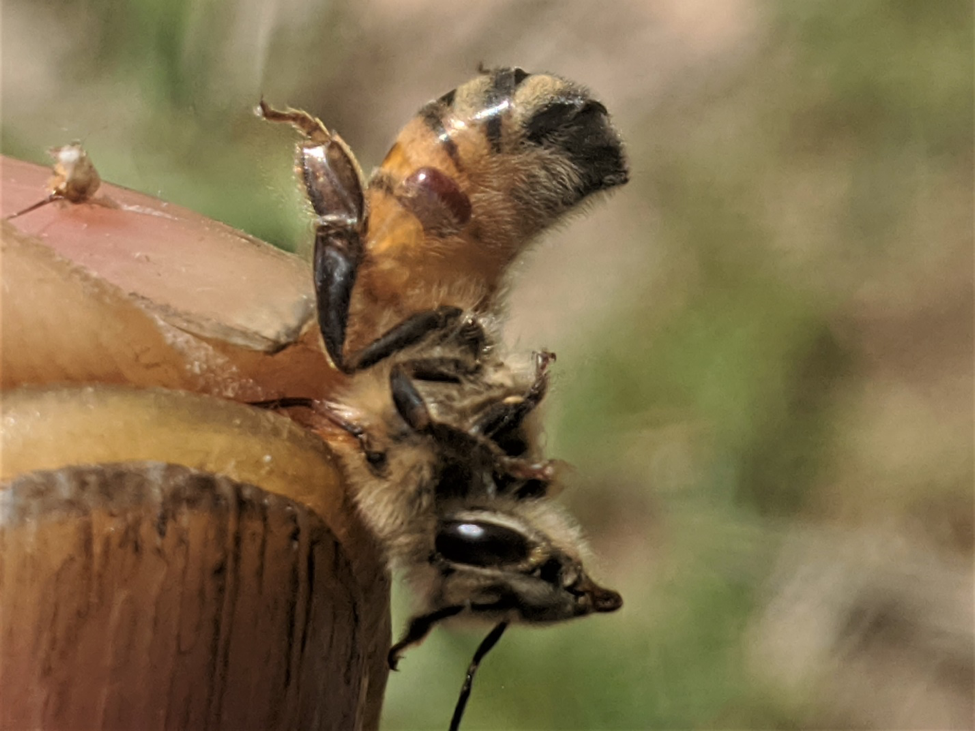
Figure 7. I’m holding a bee by the wings so that I determine how firmly the mite was attached (yes, the bees were uncooperative and some stingers were shed). Upon first touch, the mites, such as this one, responded by quickly wedging themselves even more deeply under the translucent sclerite. I couldn’t dislodge them by stroking them with forceps, but unlike as with a tick, I could easily pull them from the bee.
Result: mites are clearly not ticks, and although they strongly resisted being removed, their mouthparts did not appear to be locked in place, and they could be easily pulled from the bee.
Practical application: I’ve noticed that alcohol rapidly kills bees upon immersion, but not so with varroa – they can stand several minutes of immersion and walk away. Could it be that alcohol functions as an irritant that gets the mites to release their grip? Or on the other hand, could strong alcohol kill or paralyze the mites so quickly that they would remain locked in their feeding wounds? This question led me to bunch of additional tests.
How much agitation is necessary?
It’s commonly assumed that one must vigorously agitate the bees to separate the mites from them (Figure 8). But in order to “thresh” (to separate the grain from the chaff), do we really need to “thrash” (to beat mercilessly) the bee carcasses (or live bees in the case of sugar dusting) to do so?
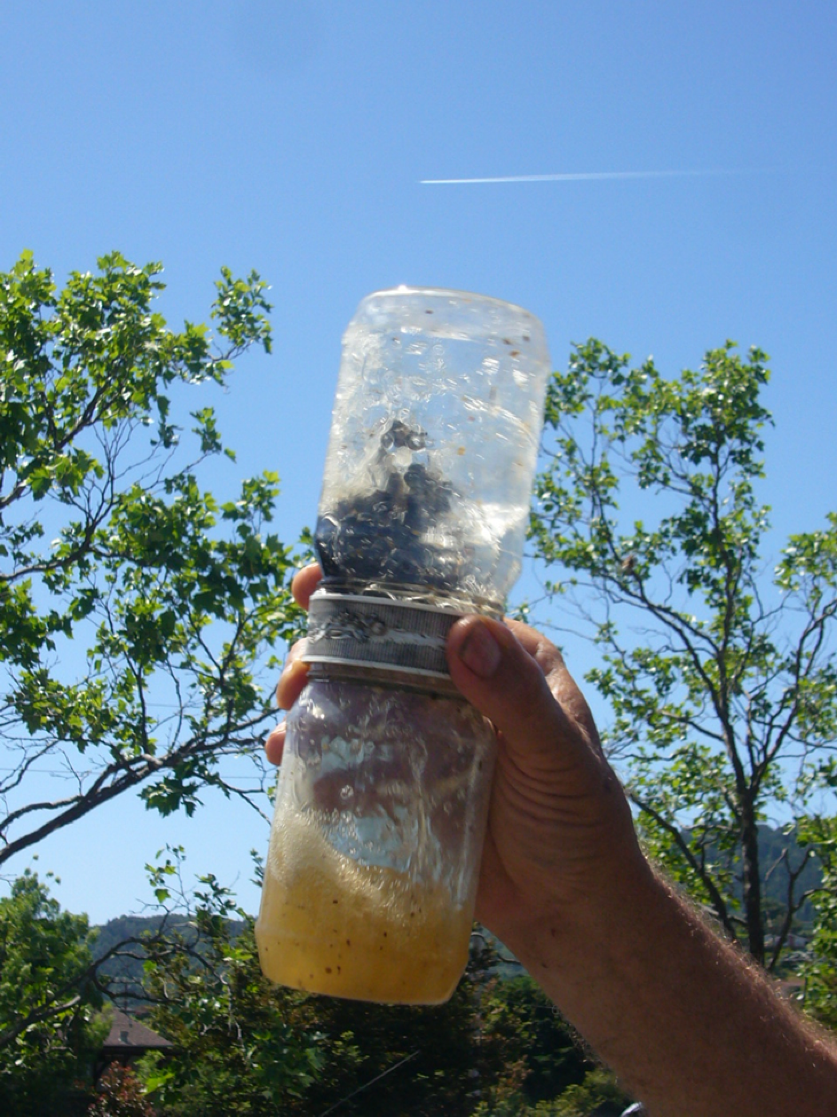
Figure 8. The standard recommendation is to vigorously shake the bees to dislodge the mites. My question is just how much agitation is actually necessary for dislodgement. Once dislodged, further up-and-down agitation just keeps stirring the mites back up into the bees. With the above style of hand agitator, I found that around 15% of the mites in a sample get stuck again in the bees’ bodies as the final shake filters back down.
I performed a small exploratory study to see whether and how quickly mites would release from bees if immersed in 91% isopropyl alcohol, without agitation. I set up a row of 6 cups of alcohol, placed a single-deep layer of bees in a cylinder with a screened bottom, and immersed the cylinder of bees sequentially in each cup for 10 seconds, giving a slight jiggle to allow any loosened mites to drop off as I moved the cylinder from cup to cup. After six 10-second immersions, I then mechanically agitated the bee sample to recover any remaining mites. In this small study of 15 samples, on average 83% of the mites dropped off by 60 seconds (Figure 9).
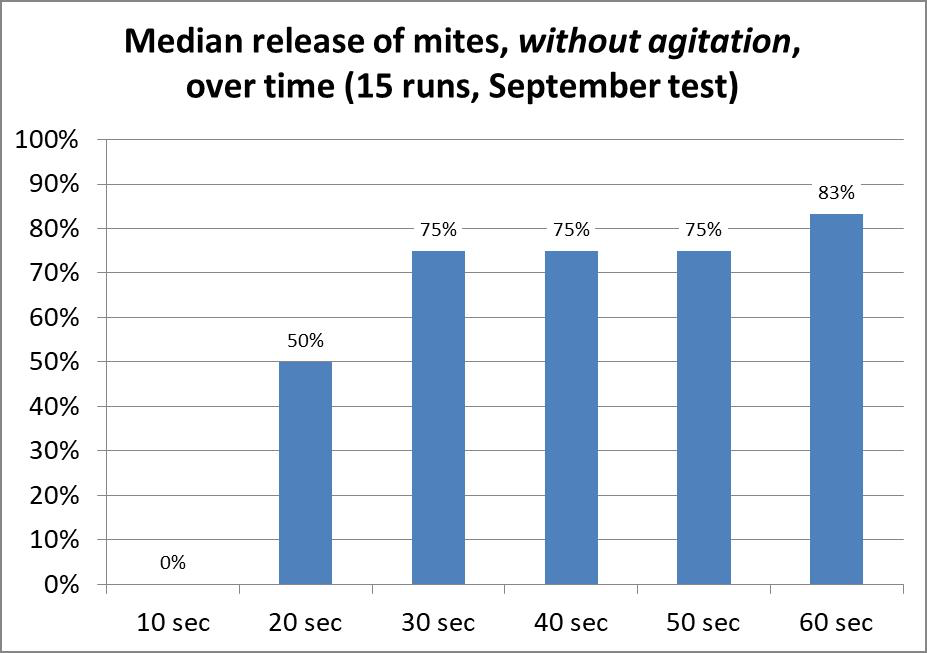
Figure 9. Mite release without appreciable agitation after seconds of immersion in 91% isopropyl alcohol. Although the median release by 60 seconds was 83%, please note that there was considerable variation (not shown), ranging from 20% – 100% (there were not enough mites per sample for anything other than suggestive findings).
The results of this preliminary mite-release data made me wonder how many mites would release of their own accord if I were to extend the immersion period to two minutes? So I fabricated a larger flat-bottom sieve that could hold up to 500 bees in a single layer. I placed the sieve in a white tub containing fresh 91% alcohol, and sampled bees from a collapsing high-mite hive. I first shook the bees from the frames into a dry tub, and then quickly sprinkled them a single layer deep into the alcohol in the sieve, at which point I started the stopwatch.
Sample size varied since these bees were very flighty and defensive; the first two samples were of about a half cup of bees (~300 bees), the third somewhat less, and the fourth of over a full cup (that final sample consisted largely of lower-mite bees that had previously returned to the hive).
It was amazing to observe how quickly the mites released from the bees and dropped through the screen of the sieve without any agitation at all. Within seconds there were dozens on the bottom of the tub (Figure 10). After two minutes were up, I very gently lifted the sieve up and down slightly to jiggle any released mites through the screen, and then dumped the bees into cups for final vigorous agitation to recover any remaining adhering mites (Table 1).
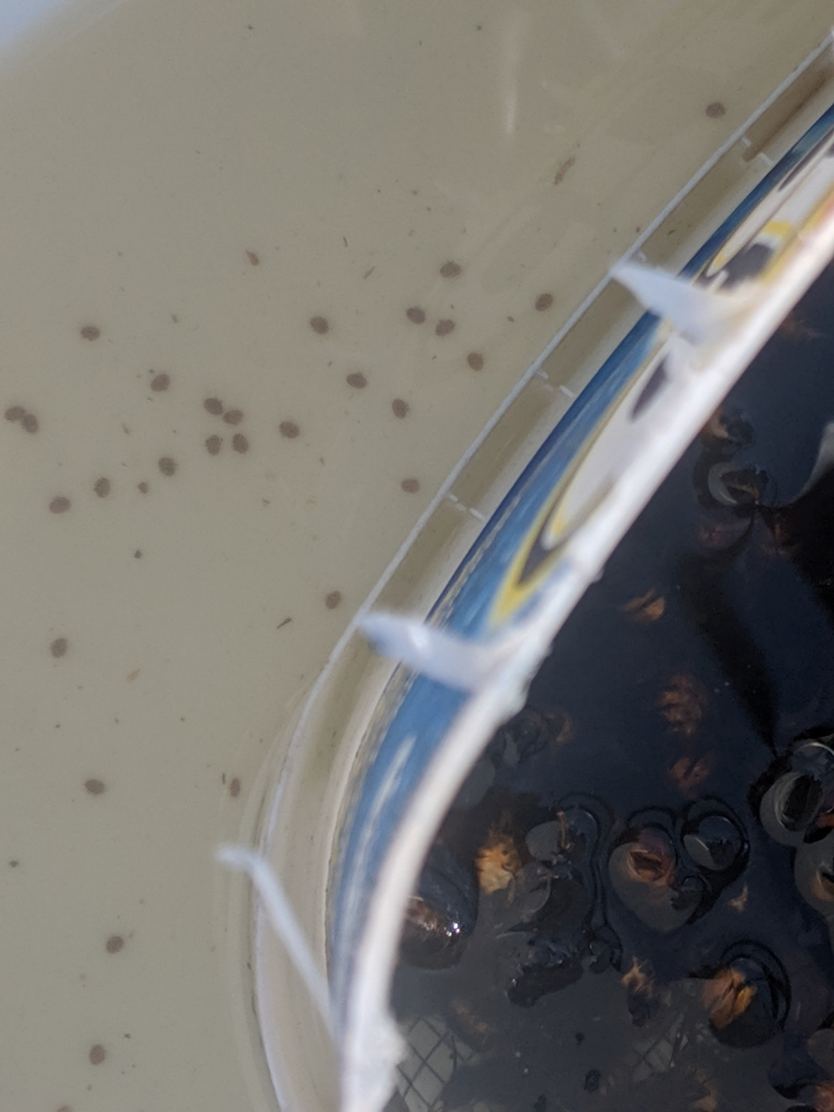
Figure 10. A view from the top. To the right is the sieve full of bees gently immersed in 91% alcohol. The mites begin dropping en masse several seconds after the bees hit the alcohol – without any agitation whatsoever.
Table 1 below shows the results. After 2 minutes immersion in 91% alcohol, most of the mites had already released of their own accord.
Practical application: Patience, patience, patience. In high-proof alcohol, nearly all of the mites released from the bees of their own accord within two minutes. By allowing the sample to set for a couple of minutes before beginning agitation, you can save your wrist. This does not mean that you don’t need to agitate – if the bees are deeper than one layer thick, not all mites drop to the bottom (more results to follow).
Next month
At this writing, alcohol is still in short supply, and lower proof alcohol doesn’t work very well, so let me jump ahead and present a follow up on last month’s findings re Dawn Ultra dishwashing liquid: the optimal dilution appears to be 2 tablespoons per gallon. More findings on using Dawn and other solutions and methods to follow.
Citations
[1] de Jong, D, et al (1982) A comparative analysis of shaking solutions for the detection of Varroa jacobsoni on adult honeybees. Apidologie 13(3): 297-306.
[2] Peattie AM, et al (2011) Arachnids secrete a fluid over their adhesive pads. PLoS ONE 6(5): e20485.
[3] Fakhimzadeh, K. (2001) Effectiveness of confectioner sugar dusting to knock down Varroa destructor from adult honey bees in laboratory trials. Apidologie 32 (2): 139-148.
[4] The Genpak AD16S works very nicely. And a headband magnifier.
[5] Richter, D, et al (2013) How ticks get under your skin: insertion mechanics of the feeding apparatus of Ixodes ricinus ticks. Proc Biol Sci. 280(1773): 20131758. Open access.
[6] Medical University of Vienna (2017) “Tick ‘cement’ as a potential bioadhesive for human tissue.” www.sciencedaily.com/releases/2017/02/170220085116.htm
The math is sometimes confusing for the mixing of sugar syrups.
I’ve created a calculator that allow you to quickly determine how much granulated sugar or commercial 77% solids sugar syrup to add to create a specified amount of sugar syrup at any desired concentration.
Download the spreadsheet here: @Syrup calculator
Refining the Mite Wash
Part 1
Treatment Threshold and Solutions to Use
Randy Oliver
ScientificBeekeeping.com
First published in ABJ July 2020
Once you’ve shaken a sample of bees, you then need to separate the mites from them. There are various recommendations for using alcohol, detergent water, powdered sugar, ether, or CO2. I’ve been using inexpensive rubbing alcohol, but wondered whether the strength of the alcohol makes a difference?
But before I move on to answering that question, I need to transition from my previous article, in which I provided information on which frame to take a bee sample from, but didn’t tell you how to then handle that sample.
Tips on shaking a sample of bees
- Use an 18-quart tub and a stainless steel half cup (125 mL) measuring cup. For measuring live bees, a deep cup is more accurate than a shallow cup (I prefer the “Good Cook” brand from Ace Hardware).
- Use a snap shake to dislodge the young bees from the frame into the tub (young bees hang on tighter than do old bees).
- Wait about 30 seconds while the older bees fly off, shaking the tub, if necessary, to distribute the bees evenly. Although the flying bees have no propensity to sting, you can avoid the cloud of them returning to the hive if you don’t stand in front of the entrance.
- If more than a cup of bees still remain in the tub, scoop some of the excess bees out, otherwise it’s difficult to spot a queen.
- The young bees will generally spread out evenly over the tub, often all walking in the same direction for several seconds, at which time it’s easy to spot a queen (Figure 1).
- Tap the tub firmly to shake the bees into a pile, and tip them into the cup (rather than scooping them). You can then use your finger to level them off before dumping them into the alcohol (I never get stung when doing this).
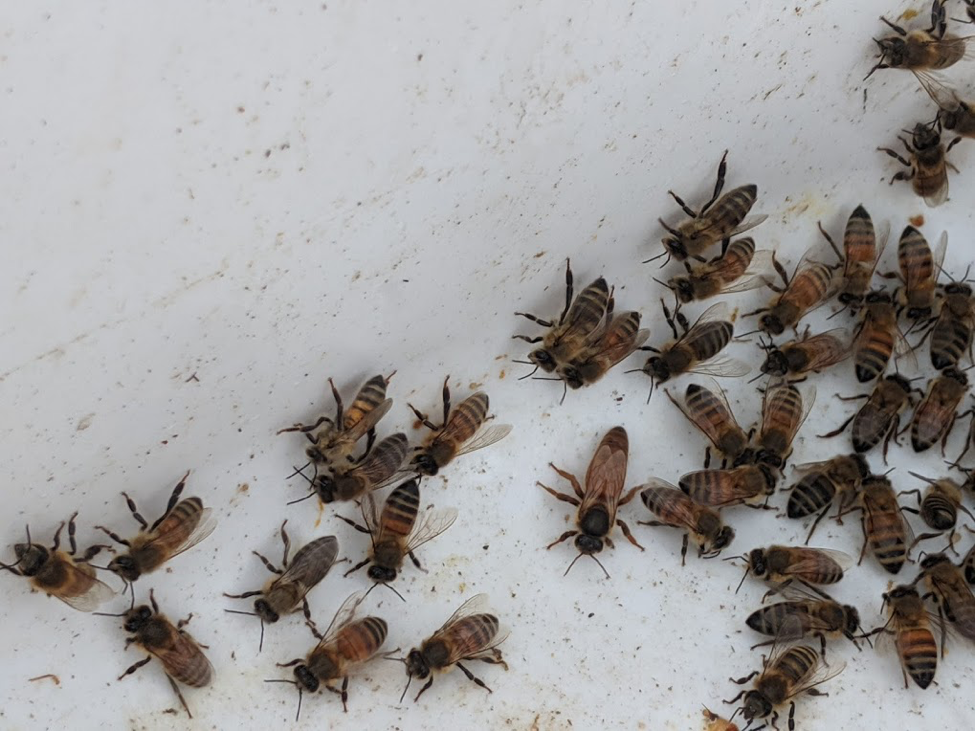
Figure 1. Most of the time, after the older bees have flown out of the tub, the remaining bees will spread out in a single layer for several seconds, often marching in the same direction. At this time a queen is easy to spot, and can be safely returned to her hive.
Determining the infestation rate
An infestation rate is the ratio of mites per worker bee (often given as a percent, meaning mites per hundred bees). But as I’ve already pointed out, a sample of only 100 bees (should you be willing to count out exactly that number) is not enough to avoid false negatives. So you really want to take a sample of a few hundred bees.
Practical application: Here’s the thing — I’m obsessed with perfecting my mite monitoring method, so that it is quick, accurate, precise, and most critically, has a high degree of “sensitivity” [[1]]. In both our selective breeding program and with early-season mite management in the rest of our operation, we want to detect infestations well before they reach the 1% level (a mite count of 3 per half cup of bees). So we want to avoid misleading “false negatives” that didn’t detect very low infestations. I want an in-field monitoring method that can consistently recover at least 95% of the mites in a sample within a minute.
Once you’ve used an alcohol wash (or other method of choice) to separate the mites from the bees, you can simply count the mites one by one (after you’ve put your reading glasses on). But then you need to know the number of bees in the sample. Ideally you’d count the number of bees in every sample, but unless you have grad students at your disposal, that gets old pretty quick. Or you can count out 100 bees, calculate the average weight per bee, and then weigh the bee sample and calculate the approximate number of bees – also tedious.
But for most purposes, that sort of accuracy is entirely unnecessary. A level half cup holds around 315 bees. So many people then calculate the approximate infestation rate to come up with a percentage, by dividing the number of mites by three (since there are approximately 300 bees in the sample). In my experience, every time a calculation is involved, there’s a chance of a mistake or confusion, plus you’re then dealing with an abstract calculated quotient, rather than what you actually observed.
So I just use actual mite counts per half cup of bees – no calculations. From this point on, if I refer to a mite count, I mean the number of mites per level half cup of bees.
Practical application: Keep it simple! Look at the simulation below (Fig. 2) to see what actual count you want to use as a treatment threshold as the season progresses. Important note: Always carefully level the cup so that you are comparing a consistent number of bees in the sample. There is no rush, since once you’ve allowed the older bees to fly off, the remaining young bees are amenable to being leveled off.
When to take action
Your colonies will be much healthier and productive if you never allow the mite infestation level to exceed 6 mites per half cup of bees. But 6 mites in May means that your colony will soon be in trouble, so better to be proactive and treat when you observe a much lower infestation rate in springtime.
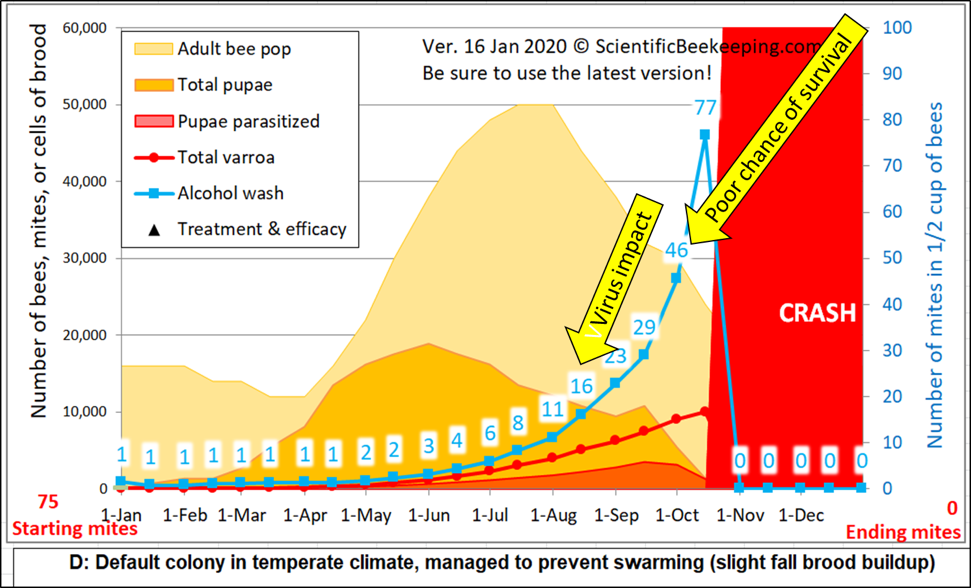
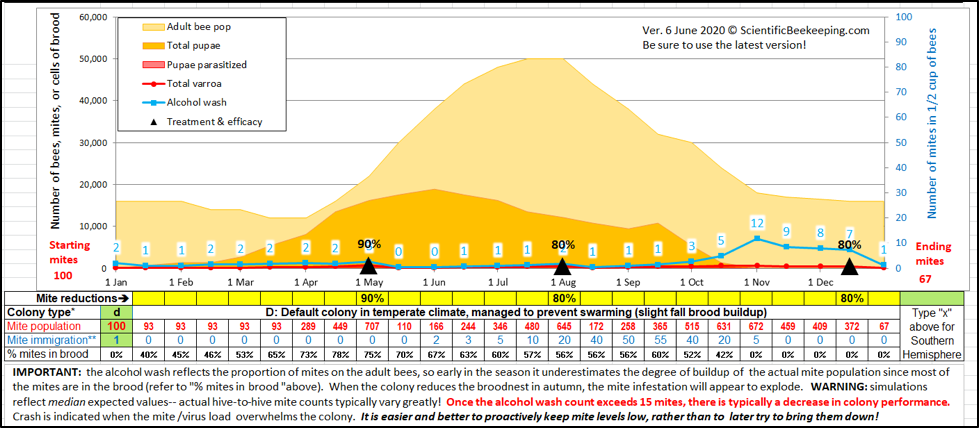
Figure 2. I adjusted the starting number of mites for the above simulation [[2]] to show a mite wash count of 1 in January (and set mite immigration to zero). At a mite count of 15 (blue numbers), viruses typically start to noticeably impact colony health, and by a count of 45 it’s generally too late to save the hive. Note how sampling underestimates mite buildup when there’s lots of brood for the mites to hide in (orange area), so a mite count of even 1 in April would be cause for treatment. For comparison, I ran a simulation (not shown) with a mite count adjusted to 6 on May 1st. It predicted that the colony would start to crash in late August, full of dying brood.
Practical application: Be proactive rather than reactive – it’s much harder to bring the mite count down than to keep it continually in check. In springtime, when 80% of the mites may be in the brood, you want to see mite counts of zero or 1. The mite count may rapidly rise in late summer/fall as the amount of brood and adult bees decreases (in addition to mite immigration from other colonies) – my sons and I don’t like to see counts rise above 10. And we always end the season with an oxalic acid treatment as winter approaches, once most of the brood has emerged.
Note: I’ve recently revised my varroa model in order to make it more user friendly. I moved the inputs for treatment, as well as other important figures, in alignment directly below the graph. Always use the latest version (you may need to hit the reload button on your browser).
So let’s get back to the alcohol wash. As I type these words, alcohol is in short supply on the shelves – I sure hope that it soon becomes more available. But which alcohol to use? The standard recommendation is to use 70% rubbing alcohol [[3]], but based upon previous findings by others, I’ve been using the cheapest 50% isopropyl alcohol from dollar stores.
Practical application: Yes, I save a few pennies by using a lower-proof alcohol. But by doing so do I sacrifice the accuracy of the mite wash? I needed to investigate.
Previous research on agitation liquids
Way back in 1982, Dr. David de Jong, concerned about a recommendation to use gasoline for mite washes (not really a good idea around lit smokers), tested a number of alcohol types and concentrations, as well as hot water, detergent and other solvents [[4]]. His data suggested that alcohol concentrations as low as 25% gave excellent mite recovery (about 95% in a 1-minute hand wash), as did detergent in water.
Then in 2004 Dr. Tom Rinderer’s team re-examined the accuracy of detergent wash compared to 70% ethyl alcohol, and found them to be roughly the same [[5]]. A few years later Dr. HR Azizi compared various methods of mite separation from bee samples [[6]]. Again, 70% alcohol, powdered sugar, and detergent scored well (Table 1), although the paper lacked experimental details.
| Table 1. Mite recovery by various methods.
After Azizi 2008. |
| Release/separation agent |
Mite recovery |
| 70% ethanol |
95% |
| Powdered sugar |
90% |
| Hot water with detergent |
87% |
| Gasoline |
83% |
| Hot water |
69% |
| Ether roll |
58% |
| Heat |
57% |
Practical application: Gasoline is dangerous; ether roll and CO2 give unreliable results [[7], [8]]. Three methods that do provide good separation of mites from bees are alcohol and detergent-water washes, or the sugar roll (if properly performed).
My own testing
Alcohol wash
Since I’m now performing over 2000 alcohol washes a year, I wanted a field technique that would very quickly and consistently result in at least 95% separation of mites from a bee sample in the least amount of time. The 12-sample home-built mechanical agitator that I’d been using gave me confirmed 100% recovery when I allowed the wash cups to agitate for several minutes, but was cumbersome to haul around. I needed to design a smaller and quicker agitator that ran on a rechargeable battery.
I built and tested a number of prototypes, and finally arrived at a model that has worked very well for thousands of washes (Figure 3). Having a few of these identical agitators on hand allowed me to test alcohol concentrations against each other, since I could eliminate the variation inherent in hand agitations.
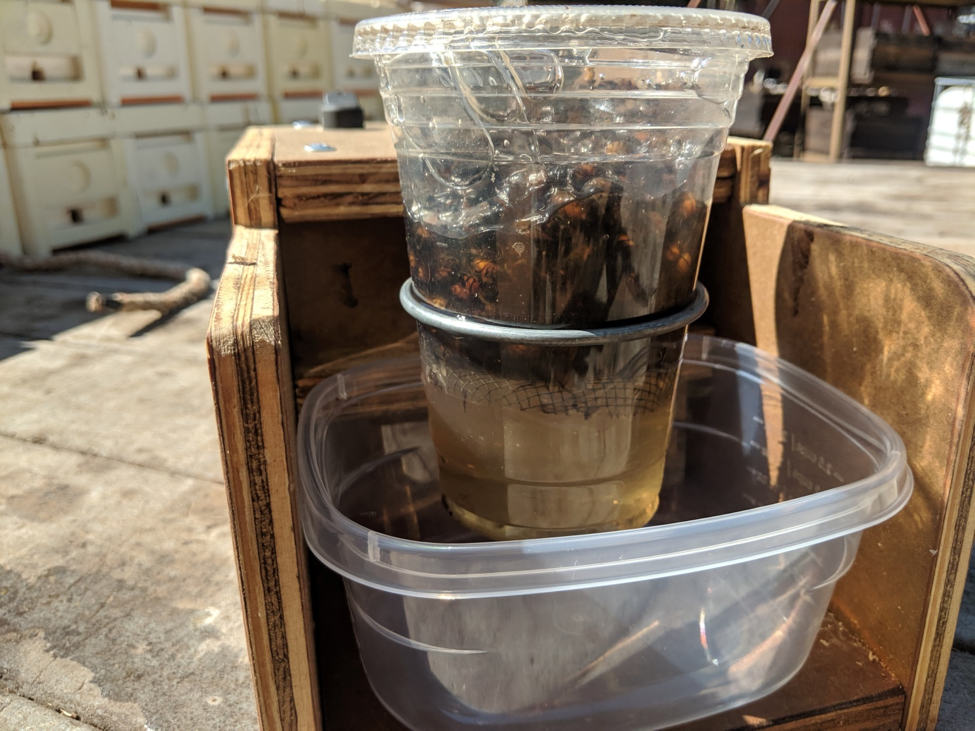
Figure 3. My portable hand agitators allowed me to perform standardized tests in the field. At the press of a button, they perform 300 swirls in 60 seconds (tumbling the bees), and then automatically shut off. We could then count the mites separated, and run additional agitations on the same bee sample until we’d recovered all the mites.
confirming the degree of mite recovery
Assisted by Brooke Molina, I went out to some high-mite hives late in the season, and collected mite recovery data on repeated washings of 69 bee samples, using either 50%, 70%, or 91% isopropyl alcohol. I made up data sheets for the field, not realizing that it would sometimes take up to 8 agitations until we got two washes in a row with zero mites, at which point we assumed complete recovery (Figure 4). I then added up all the mite counts in order to calculate the percent recovery of the first 1-minute agitation.

Figure 4. A shot of the top of our first field data sheet. I erroneously assumed that we’d get 100% mite recovery by the third agitation, so had to modify the sheet in order to enter counts until we got two zeroes in a row. Note in the “Total count” column that we were getting mite counts from some hives in the 50’s to 80’s (each hive’s samples are circled). I look for such high-mite hives, since bee samples from them allow for robust calculations of efficacy.
I worked up the data, and summarized it in Figure 5.
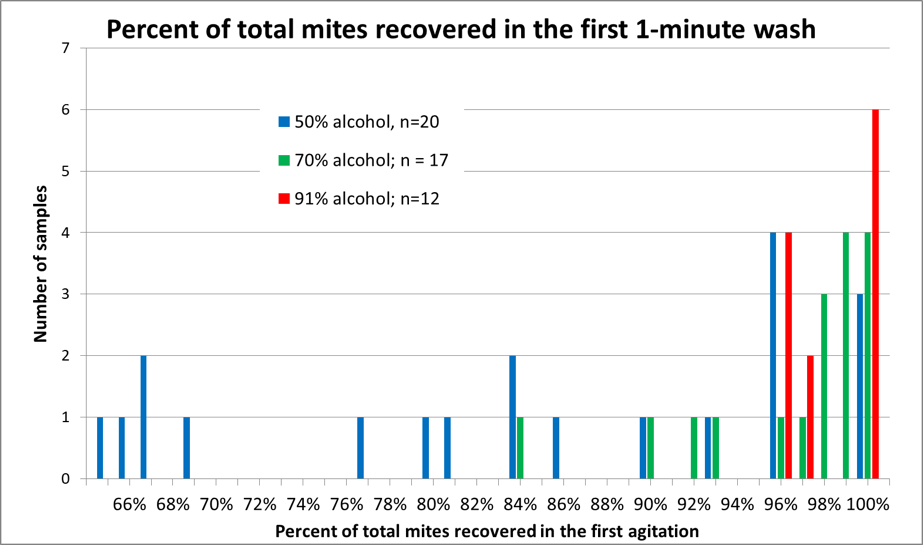
Figure 5. A histogram of mite recovery at various alcohol concentrations. Each column represents the number of samples by recovery rate and alcohol concentration. Note that in half the samples agitated in 50% alcohol (blue columns), that the recovery rate was less than 85% of the mites in the first wash, as opposed to those agitated in 91% alcohol (red columns), in which at least 96% of the mites were recovered in the first 60 seconds (with 100% recovery in half the replicates).
Practical application: The recovery with 91% isopropyl alcohol was impressive – enough for me to switch to paying a little extra for alcohol.
I wondered why higher-proof alcohol appeared to make such a difference, and I’ve discussed with Dr. de Jong plausible reasons that we got different results. In my next articles, I’ll detail how I investigated the reasons.
Issues with alcohol wash
It’s not only bees and mites in a bee sample – sometimes there are flakes of beeswax, notably when colonies are building comb during a nectar flow (Figure 6).

Figure 6. I try to avoid mite monitoring during heavy nectar flows for two reasons: (1) The shook bees get drenched with nectar, which makes it hard to scoop them into a measuring cup, and (2) they will be producing wax flakes from their wax glands. The flakes can make it difficult to count the mites.
Practical application: I noticed one minor issue when switching from 50- or 70% to 91% isopropyl – the higher proof alcohol dissolves something off the bees (perhaps wax), and gunks up the wash cups. This is no big deal – we simply wipe them clean from time to time with a paper towel. The other issue is that sometimes bees get stingy next to the agitation station. Could it be that they are smelling alarm pheromone in the recycled alcohol?
Although I’ve long favored the alcohol wash, I’m wide open to using other methods, although I find the sugar roll to be too time consuming, and requiring far too much muscular effort for the number of mite counts that we perform.
Detergent wash
I’d tried detergent wash some years ago, but had not resonated with it. But in light of the current alcohol shortage, I took a break from typing this article, went out in the rain and located a high-mite colony (~45 mites per sample), and performed several dozen mite washes to compare the efficacy of two dishwashing detergents to that of 91% isopropyl alcohol.
I tried a low-suds automatic dishwasher detergent (Cascade® Complete), and found that although it was great for dishes and less messy for mite washes, it was lousy for mite recovery – taking several repeated washings to get even most of the mites to release. The final alcohol wash of one bee sample dropped up to a third as many mites as did five previous 1-minute detergent agitations in total. Very disappointing.
So I then tried high-suds Dawn® Ultra, diluted to a bit less than de Jong’s 1% dilution of the detergent he tested, but stronger than used by Rinderer (~0.3%). It was foamy and slippery (Figure 7), but commendably worked about as well as 91% alcohol as far as mite recovery in 60 seconds of agitation (Table 2). It was a bit more difficult to count mites looking down as I usually do, but I could easily count a low number of mites by lifting out the bees and looking up from below.

Figure 7. Bubbles, bubbles, everywhere! Although a bit foamy and slippery, Dawn Ultra quickly separated the mites from the bees, and is a good alternative to alcohol, especially if you’re only performing a few washes. And your hands wind up nice and clean.
| Table 2. Test of mite recovery with Dawn Ultra (lemon essence scent), diluted 2 tablespoons per gallon of cool water (0.8%). |
|
Mite counts per agitation |
|
|
| Sample # |
Agitation #1 |
Agitation #2 |
Agitation #3 |
Agitation #4 |
Agitation #5 |
91% alcohol |
Total mites recovered |
% mite recovery, first agitation |
| 1 |
29 |
0 |
0 |
0 |
0 |
0 |
29 |
100% |
| 2 |
21 |
1 |
0 |
0 |
1 |
0 |
23 |
91% |
| 3 |
52 |
1 |
0 |
0 |
0 |
0 |
53 |
98% |
| 4 |
51 |
1 |
0 |
0 |
0 |
0 |
52 |
98% |
| 5 |
55 |
8 |
1 |
2 |
0 |
0 |
66 |
83% |
I have no idea why there was poorer recovery with Sample #5, since the last three samples were shaken from the same tub of bees, and all processed at the same time.
Practical application: It’s so easy to convince yourself of something. It made total sense that a high-strength automatic dishwasher detergent would be as effective at removing mites as a gentle hand dishwashing liquid. It wasn’t. Don’t assume anything!
I’m quite impressed by the mite recovery with detergent, and plan to investigate ways to improve the method. I haven’t yet tested to determine the optimal dilution.
Discussion
Hand agitation or shaking of bee samples for varroa monitoring, either with alcohol, powdered sugar, or detergent water is tedious, and if you have a number of hives it’s really tough on the wrist and arm. Sixty seconds of rapid agitation seems like an eternity after a few samples, and I doubt that most beekeepers use a stop watch, thus adding a great deal of variability to the amount of agitation applied to each sample.
I found that having portable agitators changed everything! Performing a hundred alcohol washes after lunch is now no big deal, and has unblinded us to what is occurring in our hives. My intent was to make my portable agitators available to all, but additional findings that I will be writing about has made me rethink mite washing and agitator design and action completely – so it’s back to the drawing board and testing bench.
I’ll be madly performing more tests for inclusion in my next article. Stay tuned!
References
[1] These are all medical terms, well-explained at https://www.labtestsonline.org.au/understanding/test-accuracy-and-reliability/how-reliable-is-pathology-testing
[2] https://scientificbeekeeping.com/randys-varroa-model/
[3] Shimanuki, H; Knox, D A (2000) Diagnosis of honey bee diseases. Agriculture Handbook No. AH690. US Department of Agriculture; Beltsville, MD, USA; 53 pp.
[4] de Jong, D, et al (1982) A comparative analysis of shaking solutions for the detection of Varroa jacobsoni on adult honeybees. Apidologie 13(3): 297-306.
[5] Rinderer, TE, et al (2004) Re-examination of the accuracy of a detergent solution for varroa mite detection. American Bee Journal 144(7):560-562.
[6] Azizi, HR, et al (2008) The comparative evaluation of the laboratory methods of separation mite varroa from the mature honeybee. Research Journal of Parasitology 3(4): 123-129.
[7] Delaplane, KS & WM Hood (1997) Effects of delayed acaricide treatment in honey bee colonies parasitized by Varroa jacobsoni and a late-season treatment threshold for the south-eastern USA. Journal of Apicultural Research 36(3-4): 125-132.
[8] https://scientificbeekeeping.com/a-test-of-using-co2-for-bee-friendly-mite-monitoring/
2009 Almond Pollination Outlook
Randy Oliver
ScientificBeekeeping.com
First published in ABJ November 2008
This is again the time of year when beekeepers want someone to look into the crystal ball and make predictions about the upcoming pollination season. No one that I know of has such a clairvoyant device, but we can certainly discuss the potential effects of factors involved this year.

Few sights are as beautiful to a beekeeper as an almond orchard in full bloom on a sunny winter day! Photos by the author.
Last February the growers got lucky. Despite widespread colony collapses, barely enough bees got set in the orchards to take advantage of the good flight weather during bloom. And despite early wind damage, and a later chilling frost, the trees produced yet another record yield! The market is now flush with a crop of rather small nuts, as the trees begin to show the strain of three consecutive heavy harvests.
So let’s look at the factors involved in the supply and demand market that sets almond prices. There are some potential changes for next year—some fairly predictable, some are wildcards. First, we’ll look at the demand side from the growers’ perspective, which is based upon the profitability of growing almonds.
Almonds enjoy privileged status as a premium nutmeat, both for flavor, and for their health image due to their content of vitamin E and mono-unsaturated fats. Indeed, US domestic per capita consumption doubled between 1999 and 2007!

Smoke from a warehouse fire in Orland, California, September 23 that destroyed some $10 million dollars worth of stored almonds. That’s a lot of nuts, but only a minute fraction of the massive crop of nearly a billion and a half pounds.
In the world market for nutmeats, growers have benefited from the weak dollar, which has helped with shipments to lucrative foreign markets (which account for nearly two thirds of sales). These growing overseas sales have a robust future, due the Almond Board’s legendary promotion of almonds (funded by a by a 3¢ “checkoff” for each pound of almonds entering the marketplace), and to rising personal incomes in developing countries.
However, the large harvest will likely soften the price a bit, especially for smaller nutmeats. But there is no sign of the growers’ greatest fear, which would be a nosedive in almond prices due to overproduction. Such an event is unlikely for the foreseeable future, as the Almond Board can recommend in any year that excess nuts be diverted to a “reserve” in order to support prices. This provision has not been necessary for several years, since there has been minimal “carry-in” of nuts from the previous harvest for several years, despite the record crops.
A reasonable price for nutmeats is good news in two ways: it means that growing almonds will still be profitable for growers, yet not turn away buyers due to excessively high prices. However, it will not be too profitable for the growers, since their production costs are skyrocketing. Profitable operations are willing to pay for good bees, but expect growers to be watching every penny!
The planting of almonds has greatly slowed of late, which may allow the bee industry to catch up with demand in the future. However, due to heavy planting in previous years, there will be an expected net additional 30,000 or so acres of trees coming into production this coming season (this figure may vary greatly depending upon the number of trees pulled due to water supply or other issues).
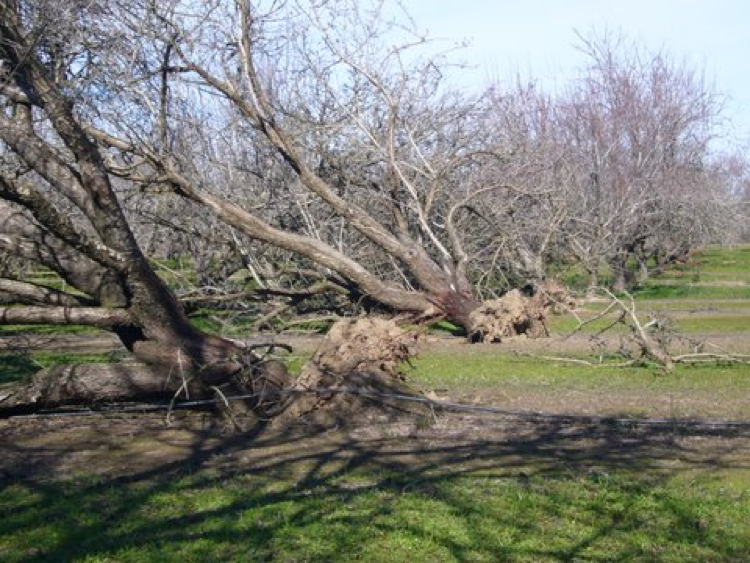
Old almond trees blown over by the January wind blast. Many of these old orchards have been, or will be, pulled from production this year. Some will be replanted with more densely-spaced almonds, others into more wind-hardy walnuts.
Crystal Ball: The long-term outlook for nut sales looks good, especially as long as the dollar remains relatively weak compared to foreign currencies. Profitable orchards support the demand for bees for pollination. There will likely still be a net increase in acreage, but the headlong expansion of almond plantings has slowed.
The agricultural side does not look quite as rosy. I mentioned earlier that there have been three consecutive record crops. Almond trees, like other organisms, need a rest from time to time. The question is whether they will hold back next year. If the bloom looks weak, or if growers expect a short crop, they may cut back on pollination demand. This will be especially true for growers who are unable to purchase water for the critical post-harvest irrigations this fall. This irrigation is critical to prepare the trees for a good bloom come February.
And this brings us to the water issue—the 800-lb gorilla! California is a thirsty state suffering from drought. I drove up the South Valley at harvest time, and simultaneously saw trees so laden with nuts that their branches had to be propped up, yet nearby orchards brown and dying due to lack of irrigation! Unless California gets major rain, some growers (even in North Valley) will be forced to either buy exorbitantly expensive water, or cut back on irrigation. In either case, this would force down the demand for bees, as growers either forego a crop, pull trees, or do not have the money to pay for multiple colonies per acre.
The second factor is fuel costs. Five dollar diesel hurts both farmers and beekeepers. It adds a few dollars per colony for a trip to and from the Midwest, and crimps the grower’s budget for bee pollination. High fuel costs also add to the sale price for nutmeats, which then effect market demand.
Now how about the supply of bees? Many beekeepers, due to supplemental feeding or good honeyflows, report strong colonies. A number of beekeepers made increase this spring, only to later combine their colonies when a good honeyflow, coupled with a high price for honey, materialized. But some areas, such as the Southeast, have experienced drought or flooding, and beekeepers there are struggling. Many beekeepers reported queenlessness problems this summer. It is too early at the time of this writing to see if there will be the sort of colony collapses experienced the past two seasons.

Some local boys dropping off bees before bloom last winter. Not all bees are hauled into the orchards on semis! Some are even hand unloaded.
The price of honey has finally climbed to a level where honey production is again profitable. This will likely dry up a part of the supply of bees as out-of-state honey producers go into the black, realize that they don’t need to go through the hassle of hauling bees to California, and simply stay home. Some who found out that the streets of California are not lined with gold are fearful of gambling on the trip west again. Many out-of-state beekeepers have no direct relationship with the growers, and have no compunction against not returning to the orchards that they pollinated last year.
This brings up the “Elk Hunting Factor” (from a Joe Traynor newsletter). Beekeepers are not afraid of hard work, and generally enjoy the challenge of the business. But the challenge has become a tedium these last few years as we work more and more days to keep our colony numbers up. Many of us longingly remember such niceties as days off and vacations (the elk hunting). It is becoming harder and harder to rationalize such hard work if we’re not making a profit. Brokers are finding that they need to pay beekeepers more to get them to supply the strong colonies desired by growers (yes, recent research by Dr. Frank Eischen confirms that an 8-frame colony collects twice as much, and a 12-framer three times as much, pollen as a 4-framer).
As you can see, my Crystal Ball is a bit cloudy—there are just too many unknowns at this time. So much hinges on the water supply and number of healthy, strong colonies available come midwinter. If the prices of honey and diesel remain high, heavy colony losses occur, and California gets some rain, expect the rental price per colony to rise. If the inverses occur, prices will likely hold steady. The buzz that I’m hearing, though, is that the general expectation is that colony rental prices will likely rise a bit. This is of course speculation, and only time will truly tell.
Nosema ceranae update: I’ve discussed with Dr. Higes my observation that some colonies appear to be able to thrive with low-level N. ceranae. He feels that colonies can handle moderate infections as long as the queen is able to sustain egglaying to offset the continued premature death of infected foragers. Collapse may not occur for months, or maybe more than a year after the colony becomes infected. A new young queen, or supersedure queen, may give the colony a “second wind,” but if the queen begins to fail, the colony will succumb. Surprisingly, N. ceranae does not appear to infect queen bees unless the infection level in the colony is quite high. His recent studies (in Spain) have found that during the period of inapparent infection, colonies may exhibit a 50-70% loss of honey production.
Re-Evaluating Varroa Monitoring
Part 4
WHAT ABOUT LETTING THE SHOOK BEES FLY OFF?
Randy Oliver
ScientificBeekeeping.com
First appeared in ABJ June 2020
In my previous article I showed how the varroa infestation rate of bees varied by comb type, with those on brood frames having higher mite counts, but those on storage frames, despite showing lower counts, appearing to perhaps be more consistent. Is there a way to strike a happy medium?
In order to collect a sample of bees, some beekeepers drag a bottle over the comb to cause the bees to drop in. Others, including myself, prefer to first shake the bees into a tub (Fig. 1) for a few reasons:
- So that I can check for the queen in the tub before I scoop up the bee sample, and
- I find that after the older bees have flown off, the remaining young bees are much easier to level off in a measuring cup (they have zero interest in stinging), and thereby allow me to get a consistent number of bees in the sample, and
- By allowing the older bees to first fly off, I’d have only nurse bees left — those which should have the most biologically relevant varroa infestation rate.
I have no doubt about the first two reasons, but in my process of questioning every assumption regarding alcohol washes for mite monitoring, I felt that I should confirm the last.
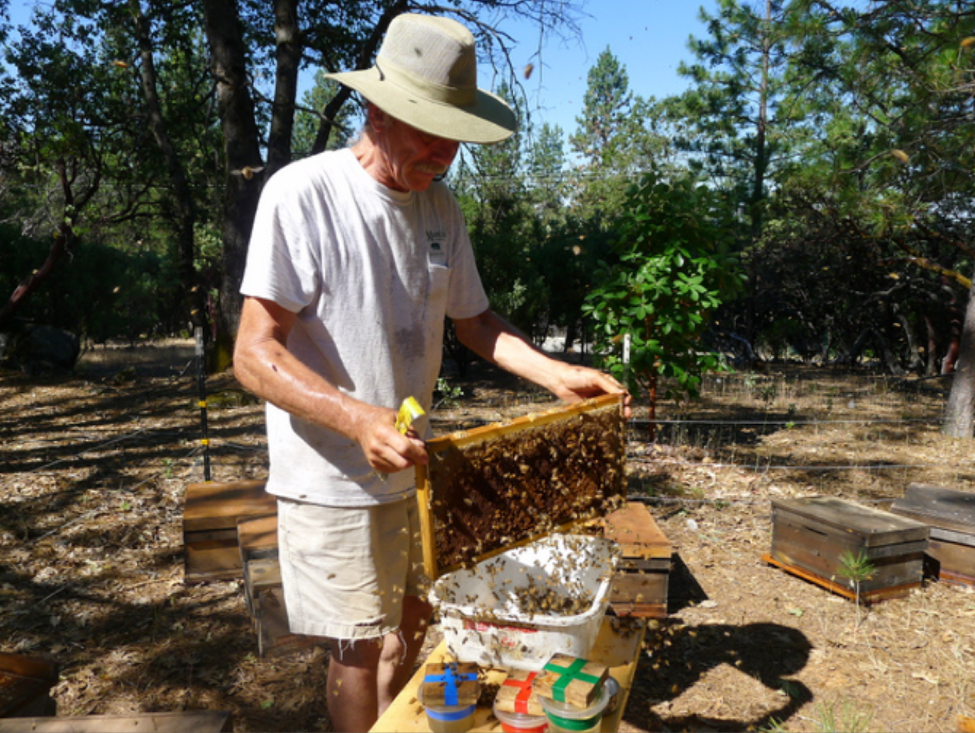
Figure 1 Shaking the bees from a comb into a tub does not elicit any noticeable defensive behavior (at least with my bees) — I use this method at all times of the day, and in all sorts of weather and temperature. Tip (thanks to Dr. Jeff Pettis): use an 18-qt dish tub rather than a 12-qt, since you can then hold the comb diagonally and get most all the bees into the tub with less chance of spilling a queen (yes, I’ve seen it happen a number of times).
Older bees with flying experience will immediately fly toward light (Fig. 2), and then back to the hive entrance. Younger bees avoid light, and remain temporarily stunned in the tub. After several seconds, they spread out and form an even layer over the bottom and sides of the tub, making it easy to spot a queen. Those remaining bees are as gentle as pussycats, and can be comfortably handled and measured.
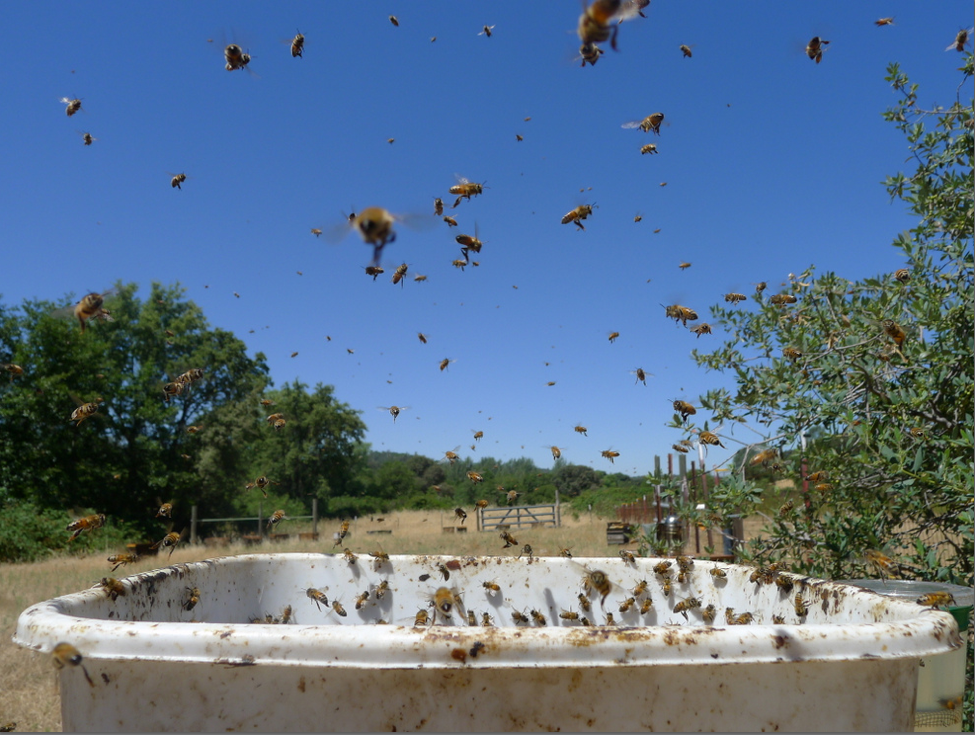
Figure 2 Older workers fly towards light; younger workers stay in the tub. My question is, do the remaining younger bees consistently exhibit a higher mite infestation rate than the bees that flew off?
If the bees that fly off indeed have a lower infestation rate, then waiting to scoop the sample will result in a higher, and perhaps more biologically relevant, mite count.
Analysis of a previous study
In the second article of this series, I presented somewhat conflicting data regarding worker distribution on the combs by age class. One data set was collected by J.B. Free [[1]]. He marked bees by age class, and inserted combs of even-aged larvae into hives. He later removed the frames, and counted the number of bees of each age class on each type of comb. He found that a goodly proportion of nurse bees were distributed even over the storage combs of a hive (Fig. 3).

Figure 3. I worked up Free’s raw data. Notice the greater proportion of older bees (blue) relative to nurse bees (green) on the storage combs, especially those in the upper boxes. It seems to reason that those older bees would lower the overall mite infestation rate of a bee sample taken from those combs. But what if you first allowed the older bees to fly back?
Fortuitously, Free had also measured something else: he counted the number of bees of each age class that flew from the combs back to the hive. He found that 95% of bees over 22 days of age would fly back to their hives (Table 1).
| Table 1. Fly-off of bees by age class. After data from Free, 1960. |
|
|
| Age of bees |
% that flew back |
|
| 2 & 3 day |
2% |
|
| 4 & 5 day |
7% |
|
| 8 & 11 day |
18% |
|
| 15 & 18 day |
39% |
|
| 22, 25,29,33,36 day |
95% |
|
So I adjusted the data for Figure 3 to estimate what the proportional age groups would be in a shook bee sample after allowing for fly-off (Fig. 4).
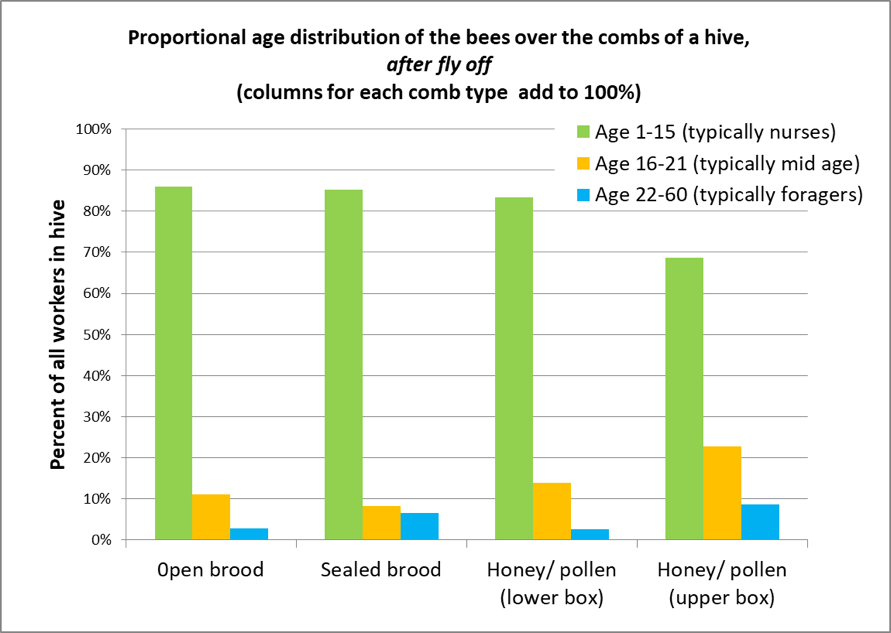
Figure 4. This calculated projection shows the expected age class distribution in samples of shook bees from the different comb types, after allowing for fly-off. This may explain why mite counts are so much higher on bee samples taken from brood combs if the older bees are allowed to fly off. Note that on honey and pollen frames taken from the upper brood chamber, even after fly-off, only about 70% of the remaining bees are nurses, as opposed to 85% on brood combs.
My own field study
In his study, Free did not shake the bees from the combs, so I’m hesitant to extrapolate with confidence regarding the effect of fly-off upon shook bee samples. So I performed a field study of my own.
Materials and methods
I shook bee samples from high-mite hives at the end of the California season while there was still some brood in the hives to provide young workers (on October 31 and November 1). The hives were not especially strong, so I often shook bees from more than one comb (some containing brood) into a tub. I took photos of each step (Figures 5-11).
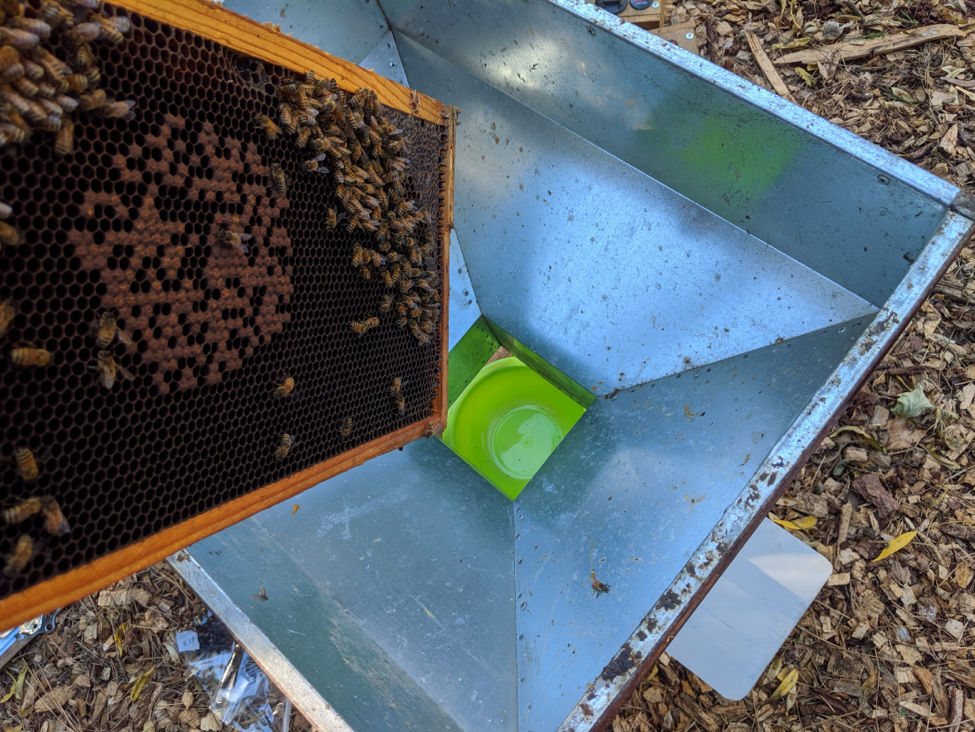
Figure 5. I set a plastic bowl (green) beneath a funnel used to shake package bees. I gave the combs a snap shake. The bees dropped directly into the bowl with a negligible fly-off. I then immediately slid the aluminum sheet at the right across the bowl to trap all the bees inside.
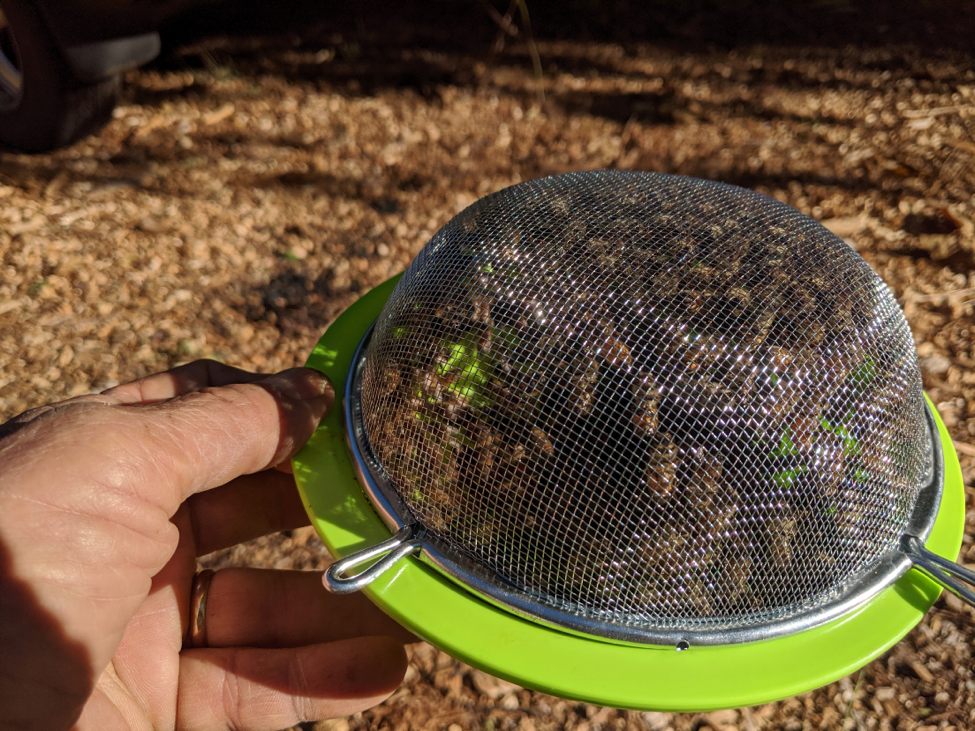
Figure 6. I then placed a sieve above the aluminum sheet, and withdrew the sheet to allow any bees that wanted to fly to go up to the screen. I watched their behavior as I tapped the bowl — the bees that went up stayed up, the bees that stayed down stayed down.
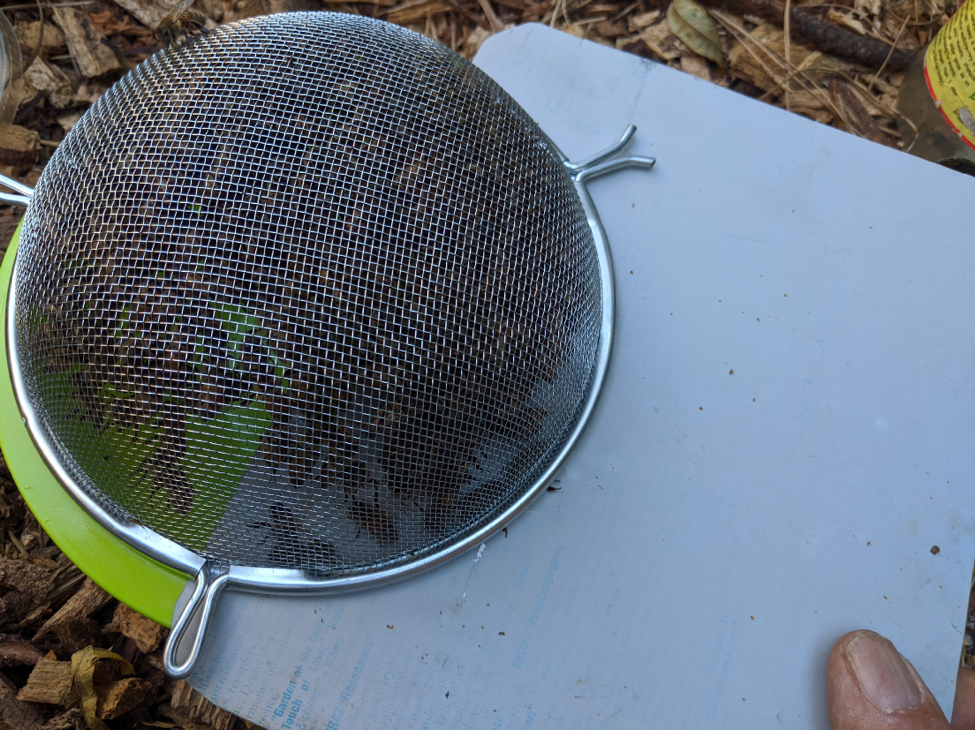
Figure 7. I then slid the aluminum sheet back between the bowl and the sieve, thus separating the bees of each shook sample into two groups: those that wanted to fly, and those that didn’t.

Figure 8. I performed alcohol washes on each group of bees, using color-coded cups for the flyers and remainers. I performed two timed and calibrated washes of each sample to obtain 100% mite recovery.
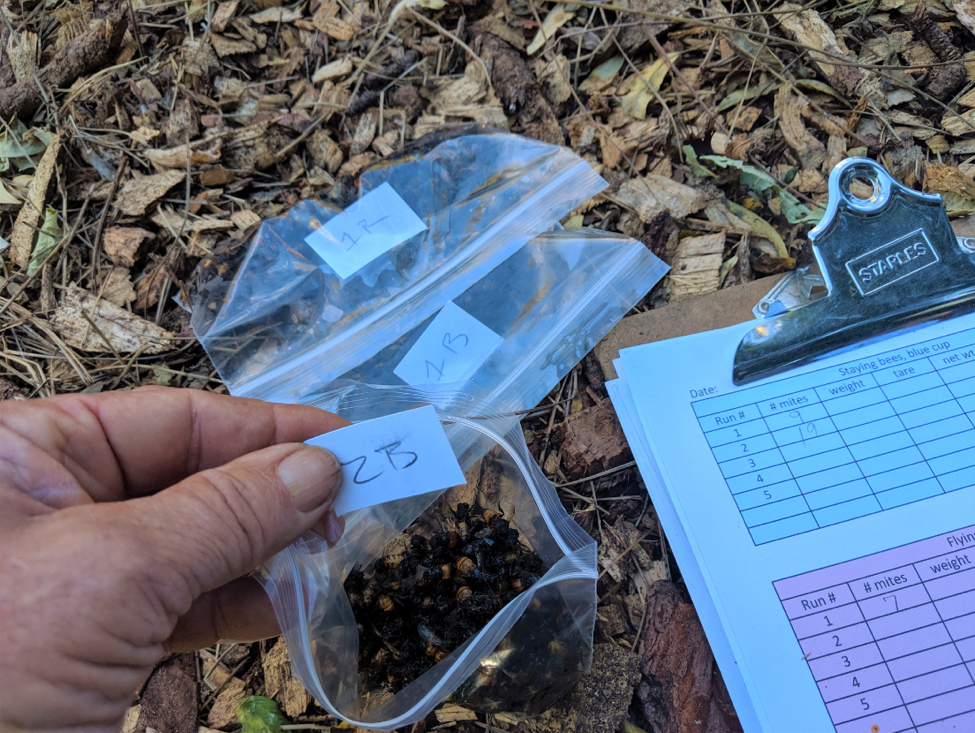
Figure 9. After washing, I drained each bee sample equally, and placed it in a bag for weighing back at home.
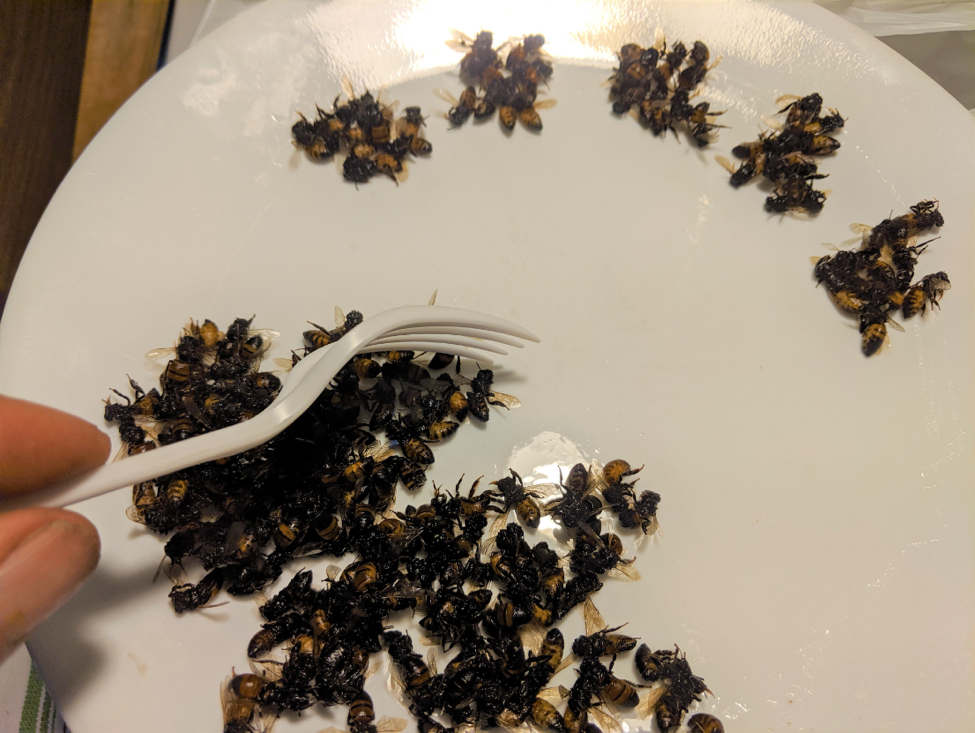
Figure 10. Back at home I counted several samples of 100 bees to determine the average weight per bee, so that I could then estimate the number of bees in each sample.
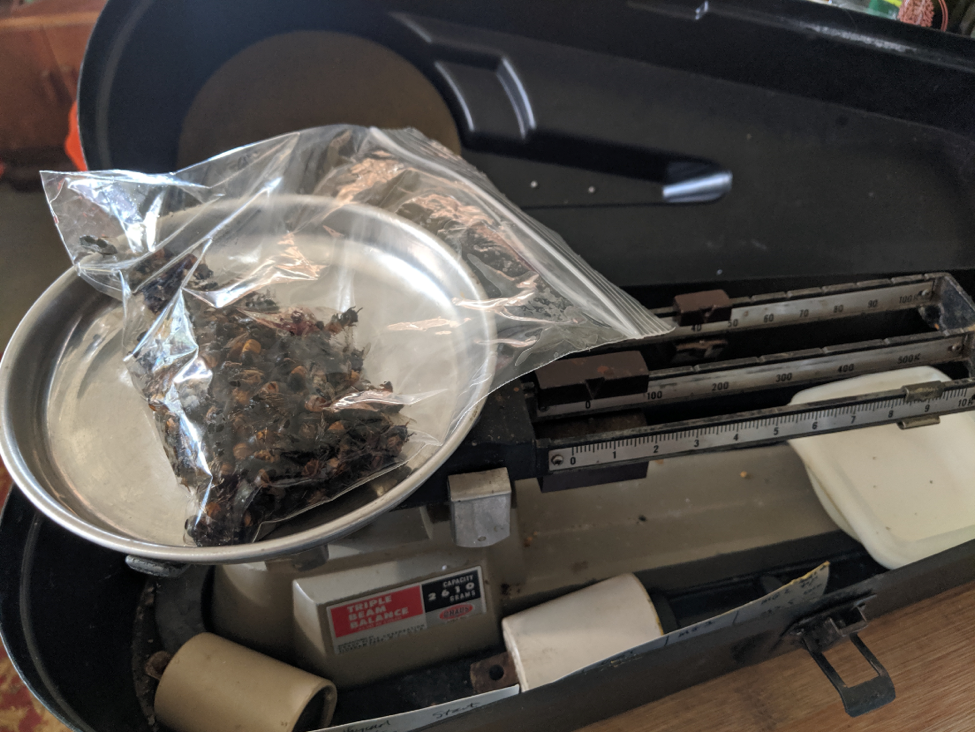
Figure 11. After subtracting the tare weight of the plastic bag, I calculated approximately how many bees were in each sample.
Results
The results are shown in Fig. 12 below.
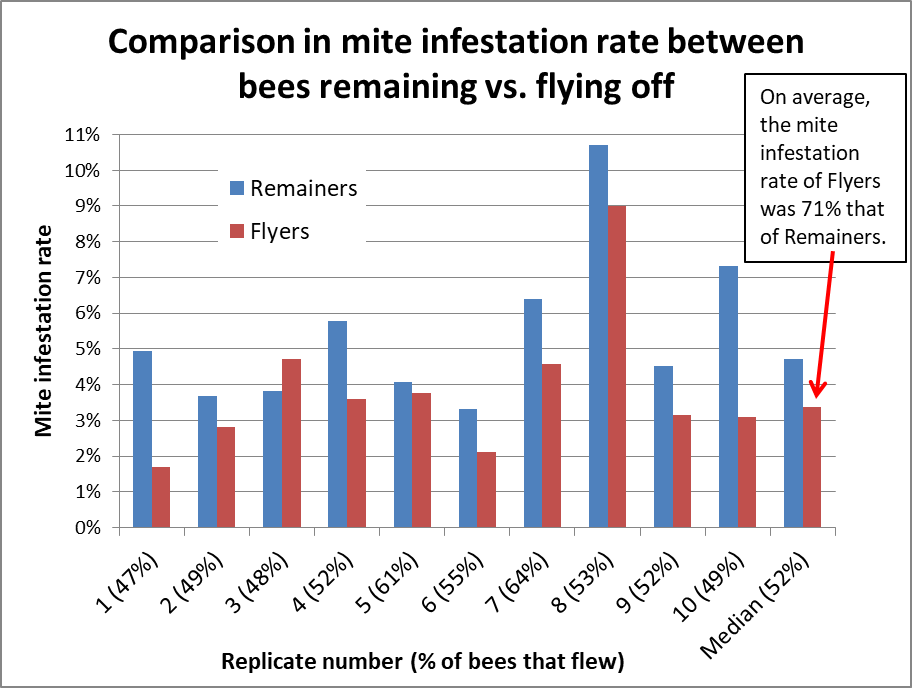
Figure 12. I shook 10 samples of bees, allowing each to divide themselves into “Flyers” and “Remainers.” The percentage of bees that flew is shown in parentheses (averaging 52%). The varroa infestation rates of the remainers are shown in blue, those of the flyers in red. In all but one case, the infestation rate of the Remainers was higher than that of the Flyers (sometimes appreciably so).
I then calculated what the infestation rates would have been of the original unseparated samples, and compared them to the rates of the bees that remained in the tub after fly off. The remaining bees had ~1.2x higher infestation rate than the original sample before fly off.
Discussion
I appears that you can consistently get a higher (and perhaps more representative) mite count by allowing the older bees to fly off.
Of interest is that Lloyd Harris’ data on bee longevity [[2]] suggests that during the spring and summer, over half the workers in the colony would be of “nurse bee” age. My own observation when I shake bees from the upper brood chamber of growing colonies in full brood production, based upon the proportion of bees that fly from the tub, is that the majority are often nurses. However, when I worked up Harris’ raw data to produce the chart of colony demographics over the season [[3]], it indicated that when colonies slow down their brood rearing, that a greater proportion would be expected to be older. My field observations also support this, since later in the season, after peak brood rearing, a greater proportion of bees typically fly out of the tub (in broodless colonies, they may all fly out). Surprisingly, in the late-season colonies used in this study (with minimal brood rearing), half the bees still flew — perhaps diutinus “winter bees,” similar to nurses, don’t tend to fly off.
So what practical advice can come from these quick and dirty field studies? The question, of course, is which comb is the most appropriate comb from which to take the bee sample. So I went back to my frame-by-frame sampling from last month. I had shaken most of the bee samples when it was cool and the colonies well settled, so there was not a great deal of bee fly off, other than in hive #6. I noticed that in that hive the mite counts from the frames adjacent to the brood were fairly consistent.
Since I nearly always take my bee samples from a comb in the upper brood chamber, I worked up the frame-by-frame sampling data for those combs alone, in order to see if comb placement relative to the broodnest made a difference. I sorted the combs by their distance from the nearest brood comb, and then normalized them all by dividing them by the colony average mite count. I also averaged the brood comb counts for comparison. The results are below (Fig. 13).

Figure 13 The black columns represent the average mite count for all frames in each hive (normalized to a value of 1). The green columns indicate the average mite count from the brood frames. The columns representing the storage combs range from orange (closest to the brood, and sometimes containing beebread) to yellow (furthest, and typically containing honey or drawn comb). The Average is for all hives.
Note that a sample of bees taken from a brood comb will contain around half again as many mites as a sample taken from a storage comb, at least under conditions of minimal fly-off. By allowing older bees to fly off, you may be able to decrease that difference. But perhaps the most important takeaway from the graph above is that samples taken from a comb adjacent to a brood comb always fairly closely represented the colony mean mite count. Caveat: not shown is that there was still a goodly amount of variation in the same hive even for combs in similar positions.
Practical application: Lo and behold, my assumption proved correct. So I will continue to take my samples from a comb adjacent to the brood. Such a comb appears to provide a consistent and representative sample, plus the queen is seldom on it. Then I let any shook bees that want to fly off to do so. But keep in mind that there is considerable variation in mite counts from the same hive — don’t trust any single mite count, and sample a large number of hives in each apiary.
I hope that the field data that I’ve presented will allow you to make informed decisions as to which comb types to sample. The main thing to keep in mind is to be consistent — you can’t compare samples taken from brood combs to those taken from storage combs.
Practical application: In my own operation, colonies perform well so long as mite counts (mites per half cup of bees) from storage combs are in the 0-1 range in springtime, do not exceed 6 during summer, don’t peak over 10 in autumn, and drop back to 2 by early winter.
References
[1] Fig. 3 in Re-Evaluating Varroa Monitoring, Part 2, in the April 2020 issue of ABJ.
Free, JB (1960) The distribution of bees in a honey‐bee (Apis mellifera L.) colony. Proceedings of the Royal Entomological Society of London. Series A, General Entomology. 35 (10‐12): 141-144.
[2] Harris, JL (2010) The effect of requeening in late July on honey bee colony development on the Northern Great Plains of North America after removal from an indoor winter storage facility . J Apicultural Research and Bee World 49(2): 159-169.
[3] Figure 4 at https://scientificbeekeeping.com/understanding-colony-buildup-and-decline-part-2/
Re-Evaluating Varroa Monitoring
Part 3
HOW DOES MITE DISTRIBUTION VARY FRAME-TO-FRAME IN A HIVE?
Randy Oliver
ScientificBeekeeping.com
First published in ABJ May 2020
In the previous articles in this series I evaluated the different methods for varroa monitoring, and then discussed the state of our knowledge as to where mites would be most prevalent in the hive. The remaining question then is, from what type of comb would you obtain the most representative and consistent sample of bees to assess the mite infestation rate of the colony as a whole?
Based upon a review of the literature, I’d convinced myself that I could take a bee sample from nearly any frame in a brood box [[1]]*. But any time that I convince myself of something, I then try to see whether it will hold up to scrutiny. Last autumn, as my colonies were tapering down broodrearing — at the time when many beekeepers are finally getting around to monitoring their hives for mites — I happened to have seven high-mite double-deep hives that hadn’t made the grade in my breeding program. Since I also had on hand mechanical agitators calibrated to give accurate alcohol washes, I decided to collect some hard data to see just how those mites were distributed on the bees on each comb.
*Update: See also my analysis of Dr. Frank Eischen’s data in Fig. 3 at https://scientificbeekeeping.com/tag/mite-drop/
Materials and methods
Helped by beekeeper Sandy Honigsberg, we smoked and then gently moved each hive backwards from its location, and placed another bottom board and empty box in its place (Fig. 1). I then gently separated the two brood chambers, and pulled frames one at a time, starting with the bottom box, shook the bees into a tub, allowed any to fly off (there was not much return flight for most hives), and then scooped up a level half cup of bees to alcohol wash. In this way, there was no agitation or movement of bees from comb to comb before I shook them, and any flown bees returned to the original stand, rather than to the yet unshaken combs.

Fig. 1 The observational study equipment and setup. I shook a separate bee sample from each of all 20 combs in each hive. If a comb did not supply enough bees for a half-cup sample, I shook the next comb into the tub and indicated a combined comb sample on the data sheet. We used color-coded cups to avoid confusion.
In order to see whether the infestation rate of a bee sample tends to correlate with how the colony is using that comb, I took a quick look at each frame after I shook the bees into the tub, and recorded an abbreviation for whether it was drawn comb only, or contained honey, beebread, mixed brood, mostly open brood, or the queen. I then replaced the comb back on the original stand. Sandy then double-washed each bee sample to ensure 99%+ mite recovery.
Results
After collecting the data, I had to think about how best to display it. I realized that it would be easier to visualize the results if I color-coded the cells representing each frame, above the mite count for the bee sample from that frame (Fig. 2).

Fig. 2 I used the above colors to indicate comb type, with the mite wash counts for a half-cup bee sample from that frame recorded underneath.
Below are the mite counts of the bee samples from each comb of one hive (Fig.3). I used considerable liberty in guessing the proportions and placement of color for each comb based upon my minimal notes — they are not necessarily representative of actual proportions on that comb, but do indicate how a beekeeper (me) would describe the comb type.
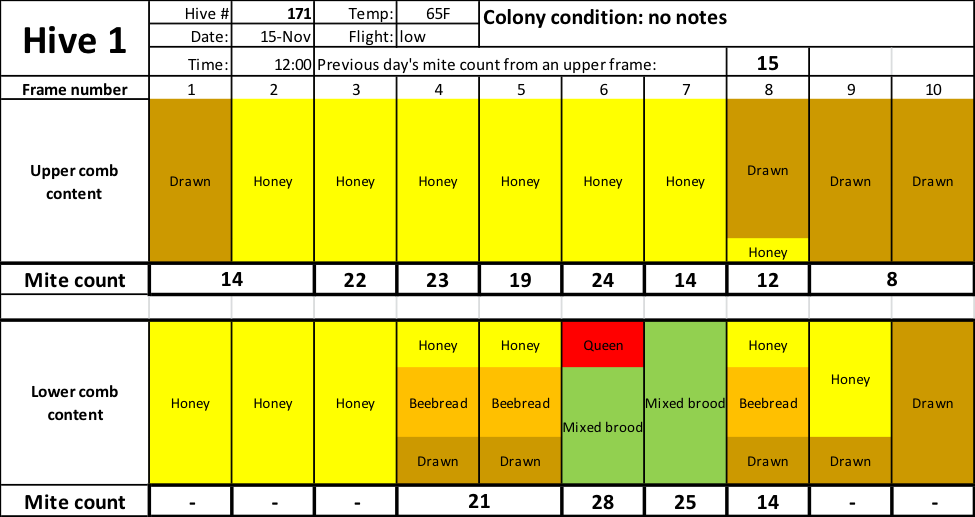
Fig. 3 Note that mite wash counts ranged from a low of 8 to a high of 28 (the average is 19) — all from the same hive. So which one best represents the impact of varroa upon the colony?
Of interest is a recent report by Sankey & Dolezal [[2]], in which they observed greatly differing infestation rates in newly-emerging bees from day to day, and large differences in the infestation rates of newly-emerged and “nurse” bees. I’ve also observed wild day-to-day swings in mite counts taken from brood frames. These observations suggest the mite counts from frames with emerging brood could be pretty dynamic.
Practical application: In my selective breeding program, what I’m looking for is a representative and consistent count, rather than either extreme. It’s up to the individual beekeeper (or researcher) to determine the sort of bee infestation rate that they’re specifically interested in, and all studies and recommendations should specify from what sort of frame bee samples were (or should be) taken.
I assume that my readers would be interested in the data from the six other hives. Due to space limitations, I shrunk the size of the charts, but in order to free you from the need to find a magnifying glass, I enlarged the font for the mite counts (Fig. 4).
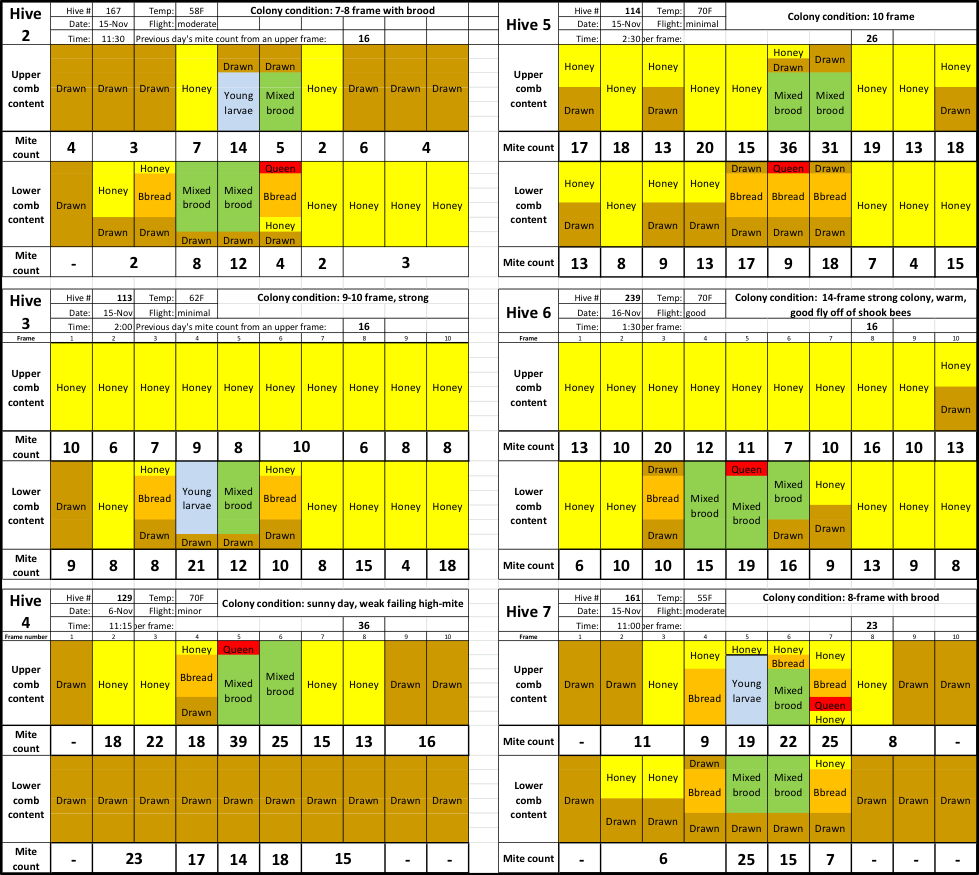
Fig. 4 The color codes for comb types are the same. As you can see, mite counts from the same hive can be all over the place. The question then is, can we detect any pattern?
The figure above has a lot of information to digest, but it shows you the fundamental variability of mite counts between bee samples taken from the same hive. To better make sense of the data, I normalized the counts from all hives for comparison (Fig. 5).
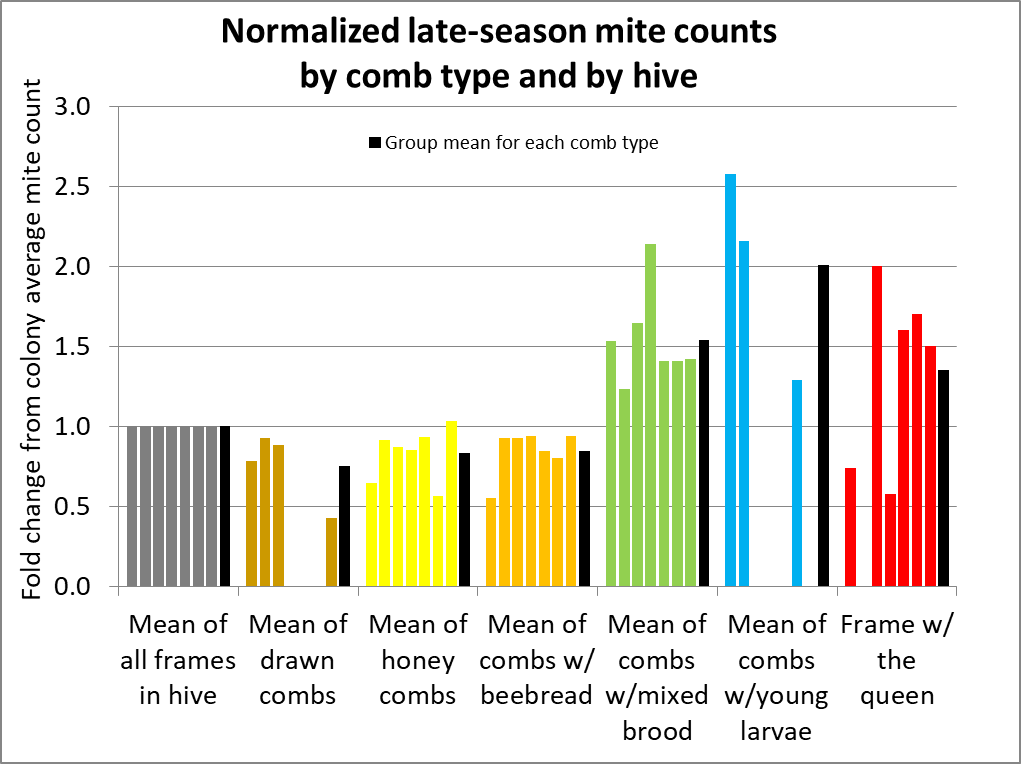
Fig. 5 I’ve normalized the counts to set the average count for all frames in a hive to 1 (gray columns). Each group of 6 columns represents the counts, by comb type, from each hive. They are all in the same order, by hive, with the average for all the hives in black. Missing columns indicate that a hive did not have bees on that comb type.
Interpretation: As in other studies, a bee sample taken from a frame containing brood is clearly likely to exhibit a higher mite infestation rate than the across-the-hive average. But if you refer back to the original hive data in Fig. 2, you can see that a sample even from the same comb type can vary greatly in a hive. In order to better illustrate that, I calculated the standard deviations for samples from each comb type within each hive below (Fig. 6).

Fig. 6 The chart above illustrates the variation in mite counts by comb type by hive – the taller the column, the greater the variability. In the last group I calculated the average. On average, mite counts in bee samples shaken from combs other than brood combs are more consistent.
Bottom line: It’s a crapshoot. If you want to find the highest infestation rate, take a bee sample from a brood comb with young larvae, but be prepared for wide variabilty. Otherwise, if your goal is to obtain a consistent and representative sample of the adult bee infestation rate, shake it from a drawn or honey comb free of brood, but adjacent to the broodnest. Doing so has the huge added advantage of greatly reducing your chance of inadvertently harming the queen.
Update: after the fact, I realized that I neglected to include the most important chart!
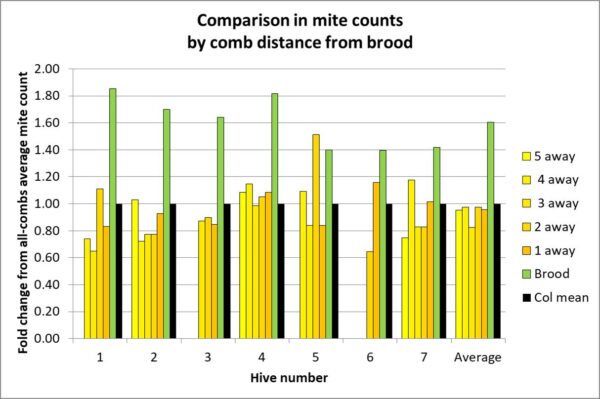
The above chart is for frames in the upper brood chamber. Notice how closely the mite count of a frame adjacent to the brood matches the average.
Coming next: Should you allow the shook bees to fly out of the tub before scooping your sample?
References
[1] Lee, KV, RD Moon, EC Burkness, WD Hutchison, M Spivak (2010) Practical Sampling Plans for Varroa destructor (Acari: Varroidae) in Apis mellifera (Hymenoptera: Apidae) Colonies and Apiaries. J. Econ. Entomol. 103(4): 1039-1050; DOI: 10.1603/EC10037
[2] Sankey, A & A Dolezal (2019) We “mite” not know we’re losing until it’s too late. Illinois State Beekeepers Bulletin 102(6): 4-5.
Re-Evaluating Varroa Monitoring
Part 2
QUESTIONS ON SAMPLING HIVES FOR VARROA
Randy Oliver
ScientificBeekeeping.com
First published in ABJ April 2020
In order to monitor the varroa infestation rate of the adult bees in a colony, one must take a sample of bees from somewhere in the hive. But how to decide which comb to take the sample from?
This is not an easy question to answer, since several questions come to mind:
- How many bees do you need for a representative sample?
- Is the sample truly representative of the worker force?
- Which age class of bees carries the most mites?
- On which combs are those bees found?
- Which combs in a hive would offer the “best” representative varroa sample?
Yes, some sticky questions. But first, allow me to define a critical term:
Sample: a representative portion of a larger whole group.
Question #1: How many bees do you need for a representative sample?
I find that if we limit the varroa infestation rate of our bees to the 2% level (2 mites per 100 bees), that our colonies thrive; but by the 5% level varroa and Deformed Wing Virus (DWV) start to noticeably take their toll on colony health and performance. Thus, early in the season I want to be able to detect an infestation rate should it reach the 1% level.
Practical application: A colony with a 1% infestation level at the beginning of April will reach the point of no return by September if not treated well before then [[1]]. Colony performance is best if mites are controlled early in the season.
So let’s say that a colony was infested at the 1% level. If I sampled a single bee, 99% of the time, I’d see zero mites — which might mislead me into thinking that the colony was “mite free.” If instead I sampled 100 bees, I’d still get a zero count 36% of the time (one can use an online calculator to determine these probabilities of sampling success). So what if I sampled a level half-cup of bees (roughly 315 workers)? See Fig. 1 below.

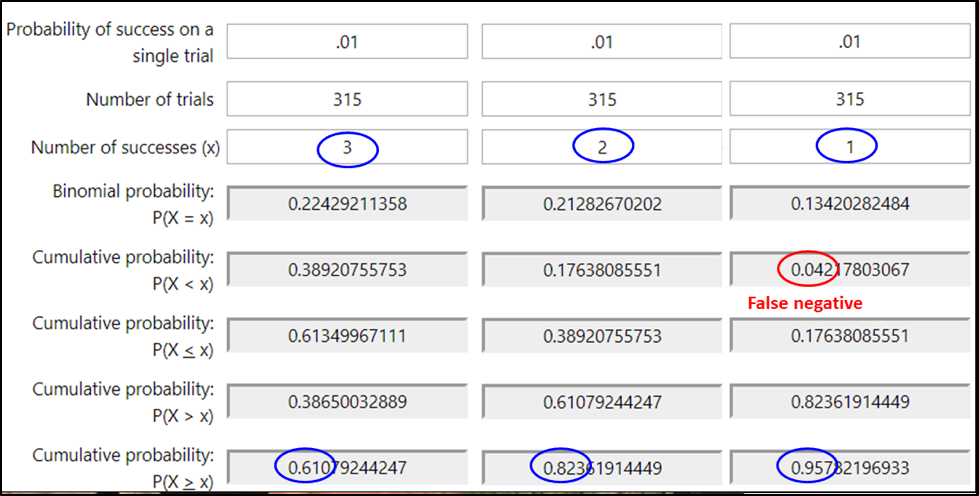
Figure 1. At the 1% infestation level, a half cup of bees would, on average, carry 3 mites — but that’s not the number that you’d see every time. With an online calculator [[2]], I entered the probability of a bee carrying a mite at the 1% infestation level (.01). Then the number of bees in a sample (315), and the number of mites that I’d expect to detect in that sample (upper blue ovals). The calculated probabilities are that although you’d get exactly 3 mites in only 22% of samples (upper left gray box), you’d detect at least 3 mites 61% the time (lower left gray box.
In the second two columns, I ran calcs to find out the chances of seeing fewer than three mites (circled in blue in the lowest row). You’d expect to see at least a single mite 96% of the time, and completely miss a 1% infestation only 4 times in a hundred (in red). So seeing even a single mite in an alcohol wash early in the season might be a call for action.
Practical application: Most of us would rather err on the side of overestimating, rather than underestimating the degree of varroa infestation. Thus, we are more interested in avoiding false negatives (underestimating the infestation rate), than worrying about false positives (overestimating the infestation). At the 1% infestation rate of the adult bees, a half-cup bee sample gives you 96% chance of getting at least one mite in the bee sample.
The Importance of Technique
Important note: Keep in mind that any of these figures depends upon the degree of mite recovery that you get by your sampling technique. In the above calculations, I assumed 100% mite recovery from the bee sample – a success rate that I suspect is rarely attained in the field. I created the table below based upon my field observations of colony performance vs. varroa infestation rate (Table 1).
| Table 1. Colony health implications related to the number of mites recovered from a sample of a level half cup of bees (approx. 315 bees). |
| Infestation level of the adult bees |
Colony health implications |
Number of mites in an alcohol wash or sugar roll, adjusted for the degree of mite recovery due to technique.* |
| Percent actual mite recovery |
| 100% |
90% |
80% |
70% |
| <2% |
Colony not appreciably affected by varroa. |
6 |
6 |
5 |
4 |
| 3% |
Winter survival rate drops. |
9 |
9 |
8 |
7 |
| 5% |
Colony summer performance drops. |
16 |
14 |
13 |
11 |
| 10% |
DWV starts to seriously take hold. |
32 |
28 |
25 |
22 |
| 15% |
Colony typically past the point of recovery despite treatment. |
47 |
43 |
38 |
33 |
| * Few beekeepers likely attain even 90% recovery due to poor technique. |
Practical application 1: The mite counts above are only expected averages, so obviously half the time you’d see fewer mites in a sample. But when I run the numbers, the counts will be within 10% roughly 75% of the time. So take multiple samples from your hives to get an idea as to where you stand, and keep in mind that roughly a tenth of the hives in a yard will exhibit much higher counts than the yard average.
Practical application 2: Since the threshold for treatment involves relatively few mites in a sample (as low as 1 early in the season), it’s important to obtain full mite recovery. Later in this series I will address how to obtain maximum mite recovery in alcohol washes.
Question #2: Is the sample truly representative of the worker force?
To obtain a truly-representative sample of the worker force of the colony as a whole would require you to shake all the bees off the combs into a cage, mix them up, and only then to take the representative half-cup sample. Clearly, most of us are not going to do that! So the question then is, where in the hive should we take the bee sample from? One would think, what with all the experts telling us beekeepers that we should monitor our hives for varroa, that there would be well-supported recommendations as to which comb in the hive gives the best representative sample. The common advice is to take the bees from a brood frame “because varroa prefer nurse bees.” Is that actually true, and would such a sample indeed be representative?
Practical application: Let’s just say that a colony has only a tiny patch of brood, indicating that there would perhaps be a low proportion of nurses in the hive. Would the presumably-high infestation rate of those few nurses then be representative of the colony as a whole? I don’t know that anyone has investigated whether the infestation rate of the nurse bees is actually the most biologically-relevant metric for varroa impact upon the colony as a whole.
Question #3: Which age class of bees carries the most mites?
There’s no sense in wasting time in trying to reinvent the wheel, so when I have a question about bees, I first search the literature to see if someone’s already performed an experiment or study to answer it. So I first looked for the supportive evidence for the claim that “varroa prefers nurses.” The original basis appears to be from a trio of in-hive studies performed in the mid ‘80s — before varroa reached the U.S. At that time, German scientists were engaged in quite of bit of very impressive research into varroa biology.
In the first study published [[3]], Petra Schneider collected samples of bees from 10 hives from mid-June through mid-October. One group of hives had low mite levels; the other high mite levels. I’ve reworked her results in Table 2:
| Table 2. Comparison of varroa infestation rates, in June, of different types of sampled bees. Data reworked from [[4]]. |
|
|
|
Type of bees sampled |
Mite infestation of bees from low-mite hives, normalized to that of nurse bees. |
Mite infestation of bees from high-mite hives, normalized to that of nurse bees. |
|
| Nurse bees |
1 |
1 |
|
| Foragers |
0.29 |
0.36 |
|
| Drones inside the hive |
1.50 |
1.13 |
|
| Drones outside the hive |
0.44 |
0.69 |
|
This preliminary study indicated that nurse bees and drones exhibited the highest mite infestation rates. Unfortunately, the brief abstract doesn’t detail how they determined which bees were “nurse bees.” But Schneider then performed additional studies during winter in a flight room, checking the infestation rate of (presumably marked) bees by age:
The highest infestation rate was found on bees which were 1-day old, further peaks were at ages of 5, 15-20, 20-30 and 42-44 days.
Unfortunately, the paper was only an abstract, so no further details.
But the next year, three heavyweights — Drs. Bernhard Kraus, Nikolaus Koeniger, and Stefan Fuchs — published a study in which they introduced over 2000 paint-marked bees into a hive and then later compared their infestation rates (Table 3):
| Table 3. Infestation rates of marked bees in a hive by age class. Data from Kraus [[5]]. |
| Age of bees (days) |
No. of bees sampled |
Infestation rate of age group |
| 6 |
600 |
5.5% |
| 12 |
640 |
5.2% |
| 18 |
450 |
2.2% |
| 24 |
250 |
3.2% |
| Pollen foragers |
370 |
0.3% |
Practical application: This in-hive study confirmed that the mite infestation rate of 6-12-day workers is roughly twice that of older workers. So the question to me then was how workers are distributed by age throughout the hive?
We know that after emergence from her cell, a worker bee typically progresses through a series of different behavioral tasks, adjusted according to the needs of the colony. This phenomenon is referred to as “temporal polyethism” (“temporal” meaning “over time,” and “polyethism” meaning “multiple behaviors”).
Since these early studies, we’ve learned that mites tend to quickly abandon the emerging workers that they had developed on (as pupae), and preferentially latch onto nurse bees. Since the mites are blind, they recognize the nurses by their odor, as evidenced by laboratory olfactory preference experiments, well-reviewed by Pernal [[6]]. This preference makes sense for two reasons:
- Nurse bees have fully-developed fat bodies, which means that they are a better food source for a female mite, and
- A nurse bee is the best transporter for a mite to its next host — which occurs when a nurse sticks her head into a cell containing a late-instar larva about to pupate.
So we can justifiably conclude that varroa do indeed “prefer” nurse bees. We might assume then that those nurse bees would mostly be on frames containing brood. But you know how I feel about assumptions. So I looked for hard data.
Question #4: On which combs are the nurse bees found?
In order to determine the usual age ranges at which workers perform each task, several researchers have tracked the activities of age-marked bees in observation or field hives.
A youthful Dr. Tom Seeley [[7]] took the time to record the activities and location of marked individuals of a cohort of 100 newly-emerged bees over the course of a month. Dr. Seeley granted me permission to include his chart of activities by age (Fig. 2).
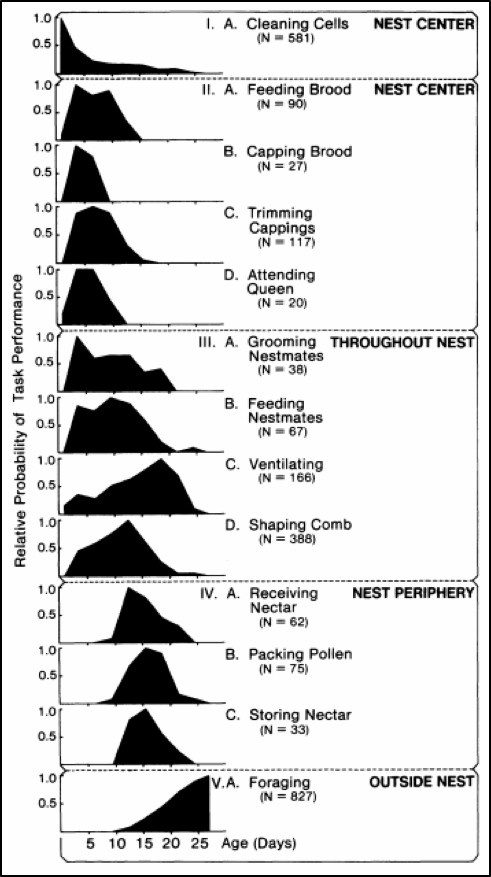
Figure 2. The darkened curves show the relative probability of a bee of any age performing one of the 13 listed tasks. Each of the five groups represents an age class, with Groups II and III commonly referred to as “nurses.” Figure from Dr. Thomas D. Seeley, by permission
Practical application: Varroa would be expected to be mostly found on nurse bees — which according to Seeley’s observations would be those from 4-12 days of age, which tend to favor the broodnest.
So I was surprised some years ago when I used fluorescent tracer to track the distribution of pollen-consuming (i.e., nurse) bees within the hive, and found them to be scattered widely throughout the combs. So let’s go back to a study by the noted English bee researcher J.B. Free, published in 1960, [[8]] to see where he found bees of that age to be located. Free introduced newly-emerged marked bees (nearly 4000 bees in 7 replicates) into normal colonies and recorded the numbers of marked bees found on brood and storage combs at intervals afterwards (I graphed his data in Fig. 3).
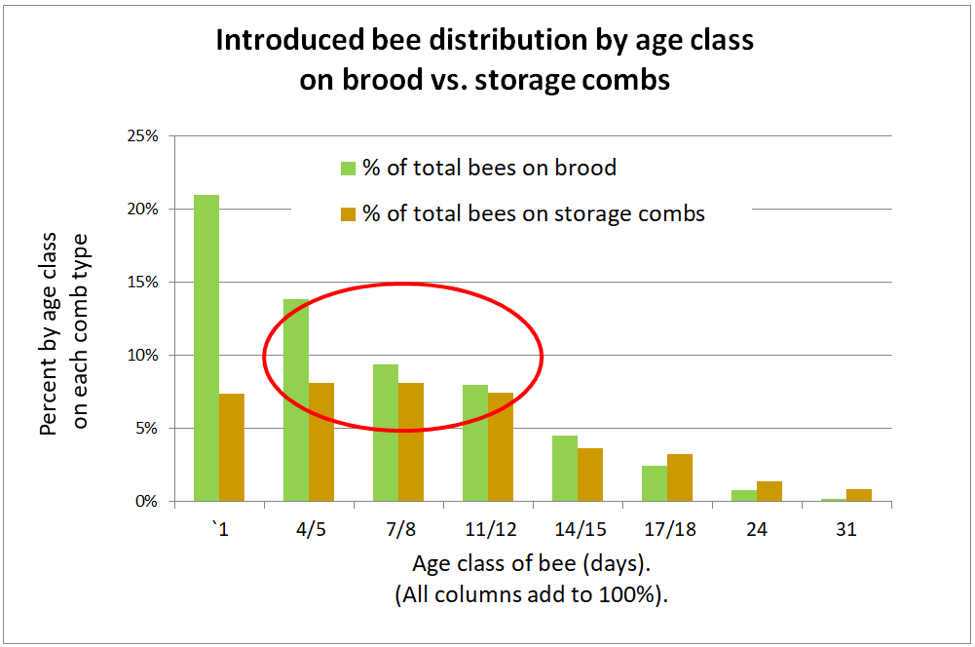
Figure 3. J.B. Free recorded the distribution of bees of each age group on brood combs (green) or storage combs (brown). Note that the bulk of a colony’s population (during summer) consists of young bees that after 5 days of age are relatively evenly distributed over the combs. Nearly half the nurses (circled in red) were found on storage combs. I’ll break down Free’s data in greater detail in a later article.
Practical application: Although we often associate nurse bees with being on brood combs, in actuality, they tend to be distributed on combs all over the hive.
Following up on this earlier research, van der Steen in 2012 [[9]] marked emerging bees once a week in ten one-story colonies for 4 weeks, and then recorded the distribution of the marked bees on the frames of the hives each week from 24 August ‘til 20 September. They found no statistical hive-to-hive difference in marked bee distribution among the ten hives, so pooled the data. I’ve reworked their results in Fig. 4.
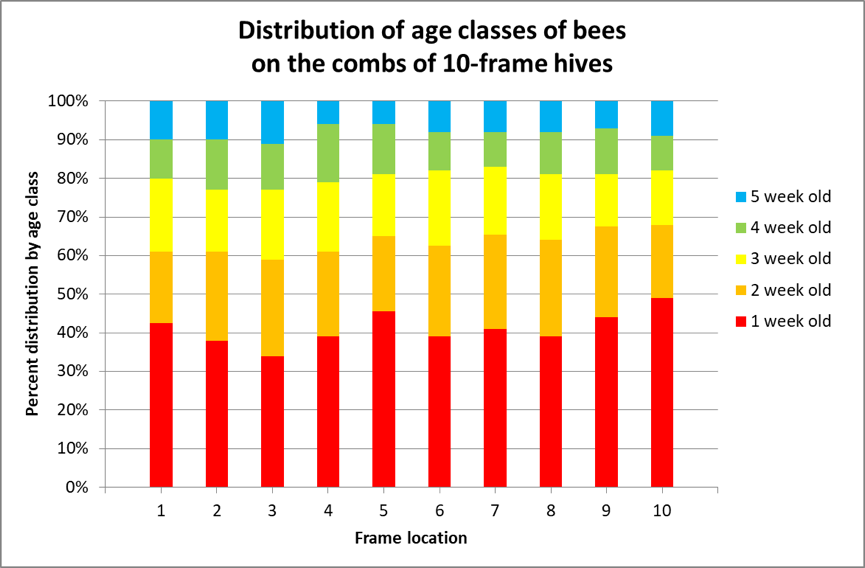
Figure 4. I color-coded van der Steen’s results. The authors did not specify the contents of the combs as far as storage or brood combs, but they clearly found that the various age classes of bees were relatively equally distributed over the combs, at least in single-story hives.
They concluded that:
Our study shows that in August it is perfectly possible to sample from the outer brood frames for a standard distribution of age classes, whilst disturbing the colony less. … We did not find a cluster of very young bees in the centre of the colony [as per Seeley], but we started counting from one week old bees onwards, which means that the phase of clustering in the centre of the colony had already passed by that time.
Practical application: The above studies determined the distribution of age classes of the bees, but does that indeed predict where mites were most likely to be found? Since nearly all the mites in a hive emerge from the brood, or are attempting to hitch a ride on a nurse bee in order to reenter a cell, we’d perhaps expect that the highest infestation rate to be found on a bee sample taken over emerging or open brood.
Question #5: Which combs in a hive would offer the “best” representative varroa sample?
In the same year as Seeley’s observation hive study of bee behaviors, Dr. Stefan Fuchs [[10]] published a field study, in which he determined the varroa infestation rate of bee samples taken comb-by-comb from across 10-frame hives. He found that:
The estimates obtained from different bee samples from the same colony fluctuate over a very wide range. In bee samples, infestation was somewhat higher in the central area of the hives, particularly on the brood combs.
However, the infestation rate of bees taken from frames containing brood wasn’t that much higher than that of bees taken from outside combs — only about a quarter higher, with only a weak correlation with the amount of brood on the comb. But in autumn, as the colonies began to go into winter cluster, infestation rates were roughly 1.5 times higher on the central comb than on outer honey combs.
More recently (2010), Katie Lee studied mite distribution within colonies [[11]]:
These results indicated mites were distributed approximately at random among bees on brood box frames.
In contrast, [mite] densities on frames with and without brood comb were statistically different… However, the difference was modest, with 1.8 mites per 100 bees on frames without brood comb, and 2.4 on frames with brood comb … for convenience, and to increase sampling precision and chance of detecting mites when they are rare, we recommend beekeepers take a single large-vial sample of 300 adult bees from any frame in the uppermost brood box.
Convincing myself
Years ago I’d also reviewed data given to me by Dr. Frank Eischen for frame-by-frame mite counts from many hives [[12]], as well as previously reporting that Dr. Ralph Büchler and I had both found that there didn’t appear to be much difference in mite infestation rates of bee samples taken from honey vs. brood frames from the brood nest [[13]]. I’d also performed a single comb-by-comb comparison myself [[14]], and concluded that taking a bee sample from any frame in the upper brood chamber was representative enough.
Practical application: Based upon a review of the literature, it was easy to convince myself that I could take a bee sample from nearly any frame in a brood box.
But that doesn’t mean that I don’t continually question my own assumptions and conclusions. So since my selection for mite resistant bloodlines is based upon mite counts. I decided to see whether it really made a difference in what comb I took the sample from. I’ll share what I found next month (teaser: it changed my mind).
Citations
[1] https://scientificbeekeeping.com/randys-varroa-model/
[2] https://stattrek.com/online-calculator/binomial.aspx
[3] Schneider, P (1985) Befall Von Sammlerinnen, Stockbienen, Flugdrohnen Und Stockdrohnen Mit Varroa jacobsoni. In Arbeitsgemeinschaft Der Institute Für Bienenforschung Bericht Über Die Tagung In Bonn Vom 12.-14.3. Apidologie 16 (3): 209-211.
[4] Op cit.
[5] Kraus, B, et al (1986) Unterscheidung zwischen Bienen verschiedenen alters durch Varroa jacobsoni Oud. und Bevorzugung von Ammenbienen im Sommerbicnenvolk. Apidologie 17 (3): 257-266.
[6] Pernal,S, et al (2005) Semiochemicals influencing the host-finding behaviour of Varroa destructor. Experimental and Applied Acarology 37:1–26.
[7] Seeley,TD (1982) Adaptive significance of the age polyethism schedule in honeybee colonies. Behavioral Ecology and Sociobiology 11(4): 287-293.
[8] Free, JB (1960) The distribution of bees in a honey-bee (Apis mellifera. L) colony. Proceedings of the Royal Entomological Society of London (A) 35: 141-141.
[9] van der Steen, JM, et al (2012) How honey bees of successive age classes are distributed over a one storey, ten frames hive. Journal of Apicultural Research 51(2): 174-178.
[10] Fuchs, S (1985) Op cit.
[11] Lee, KV, et al (2010) Practical sampling plans for Varroa destructor (Acari: Varroidae) in Apis mellifera (Hymenoptera: Apidae) colonies and apiaries. J. Econ. Entomol. 103(4): 1039-1050.
[12] Fig. 3 at https://scientificbeekeeping.com/mite-management-update-2013/
[13] https://scientificbeekeeping.com/messin-with-varroa-2014/
[14] https://scientificbeekeeping.com/sick-bees-part-11-mite-monitoring-methods/
Re-Evaluating Varroa Monitoring
Part 1
METHODS
Randy Oliver
ScientificBeekeeping.com
First published in ABJ March 2020
In order to avoid the preventable death of colonies due to varroa-virus overload, we’re told to monitor our colonies’ mite levels. But how best to do so? In this series of articles, I’ll review what we actually know, and provide hard data from my own recent research to improve our methodology.
Most successful beekeepers (as measured by having high rates of colony survival) monitor mite levels in their hives to some extent. There are a number of methods to do so, each with its pros and cons. Let me start off with a brief review of different ways used to monitor varroa levels, and then I’ll move onto recent studies that I’ve performed in order to answer some questions that I had.
Whole-hive Assessment
- Visual inspection. One might think that you could simply look for mites on the bees or for bees with deformed wings. Unfortunately, due to the fact that most mites may be sequestered in the brood, and those on the bees hidden on their undersides, by the time these signs become apparent, it’s already too late, since the in-hive DWV explosion has passed the tip point.
- Natural mite fall, aka stickyboard counts. This method is popular since it does not require the opening of the hive or handling of bees. The results of field comparisons of natural mite drop to the total colony population of mites are mixed, with some researchers finding a good correlation [[1]], and others not so much [[2]]. My own data [[3]] suggest that natural mite fall can greatly under-or overestimate the actual infestation rate of the bees in the hive (Fig. 1), and vary widely day to day for the same hive (Fig. 2).
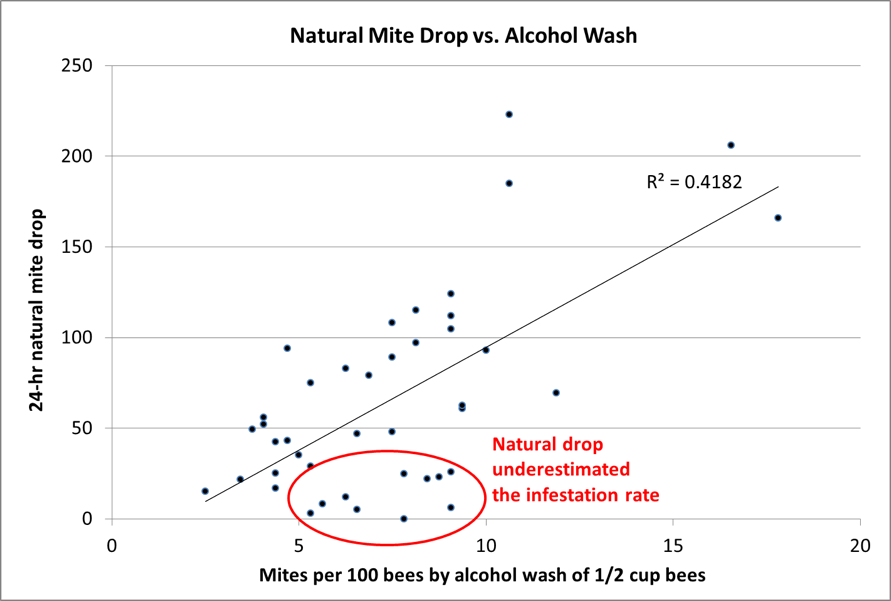
Figure 1. Natural mite fall counts in late July and early August, compared to alcohol washes taken at the same times. Note how stickyboard counts can greatly underestimate a serious mite infestation.
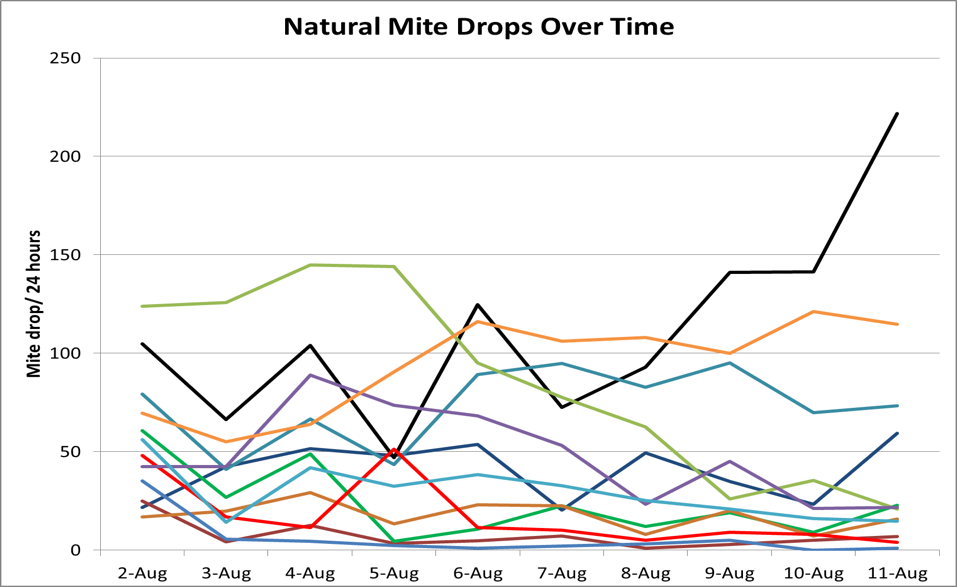
Figure 2. Daily natural mite drop for a dozen hives that I monitored in an experiment. Note that the daily drop can vary substantially, since it has much to do with the amount of brood emerging each day.
Dr. Richard Fell [[4]] also tracked natural mite drop over time, and concluded that:
The results of this study… indicate that mite-sampling data can be highly variable. Mite numbers from sticky board samples were found to vary by as much as 250% in as little as two weeks.
Natural mite drop is strongly affected by high death rate of mites immediately after emerging from a cell, resulting in bands of mites on the stickyboard directly below frames [[5]]. Natural mite drop counts must be also be assessed relative to each colony’s strength, since 25 mites falling from a 4-frame colony is more serious than 25 falling from a 20-framer. The method does require sharp eyes to pick out the mites from the hive trash, is tedious, and requires a return trip to the apiary.
- “Forced” mite drop. One can force a more rapid mite drop, which better reflects the infestation rate of the adult bees, by applying a treatment to cause the mites to release their grip, such as oxalic drip or vapor, powdered sugar, formic acid, or a fast-acting synthetic miticide. A forced drop can give relatively quick and fairly accurate results. There are several advantages to this method:
- No need to remove any frames (Fig.3).
- No harm to the bees or queen.
- Dusting takes only a few minutes.
- Mite count in less than an hour (Fig. 4).
- The mite drop is fairly representative of the overall infestation rate (Fig. 5).
- The treatment kills a proportion of the mites on the bees, so you kill two birds with one stone.
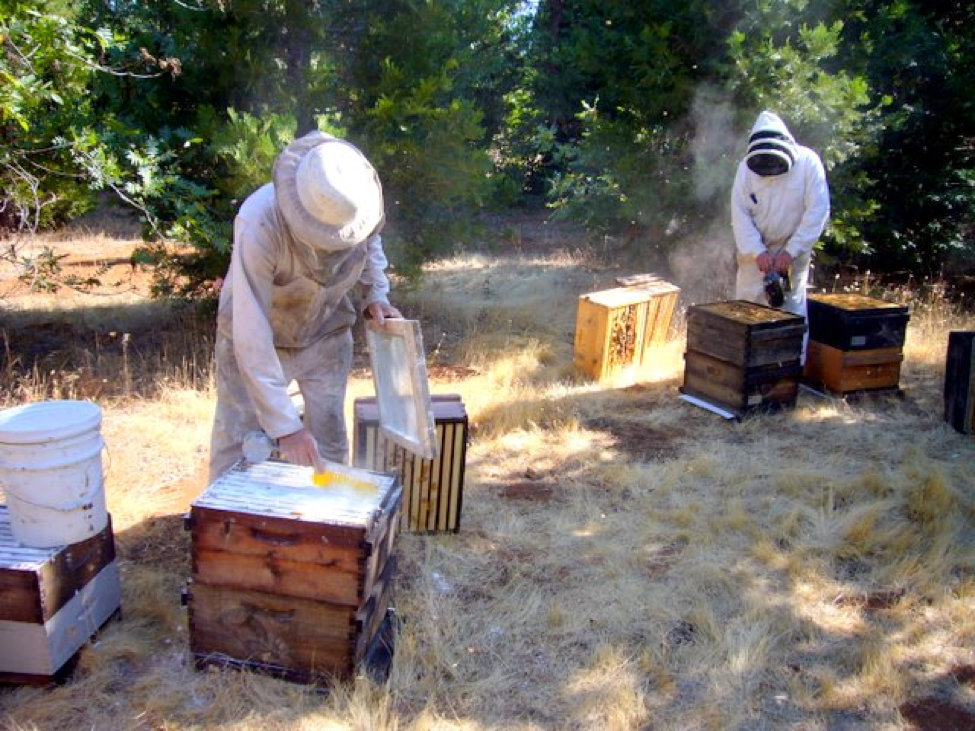
Figure 3. In this old photo we were applying powdered sugar to force a mite drop [[6]]. A forced drop is a quick and easy way to get an idea of the mite infestation rate of the adult bees.
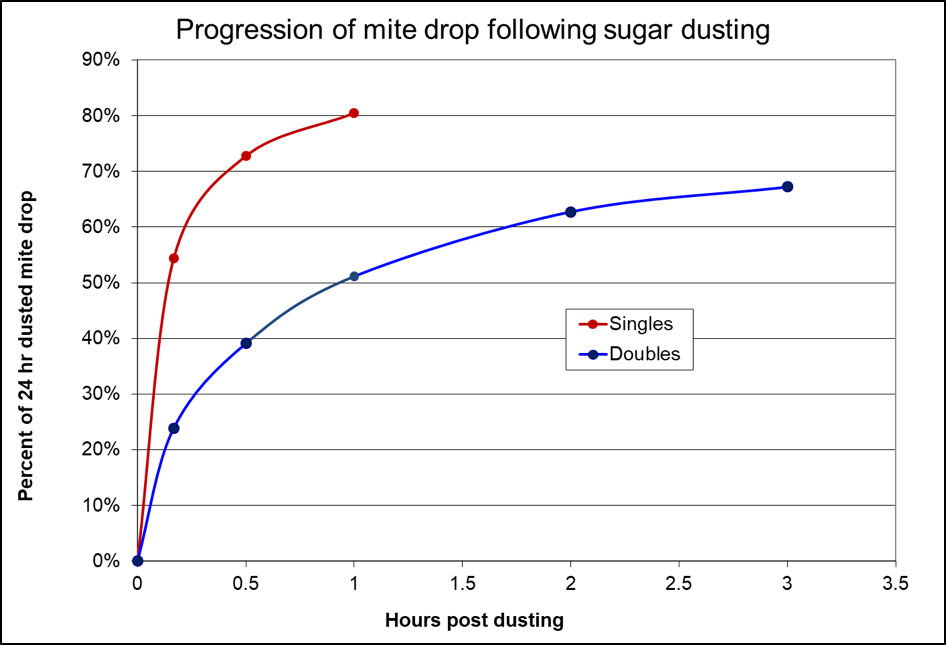
Figure 4. Powdered sugar causes the mites to drop rapidly in a single deep hive, but take a bit longer when dusted only over the top bars of a double. In my tests, dusting causes about a third of the phoretic mites to drop.
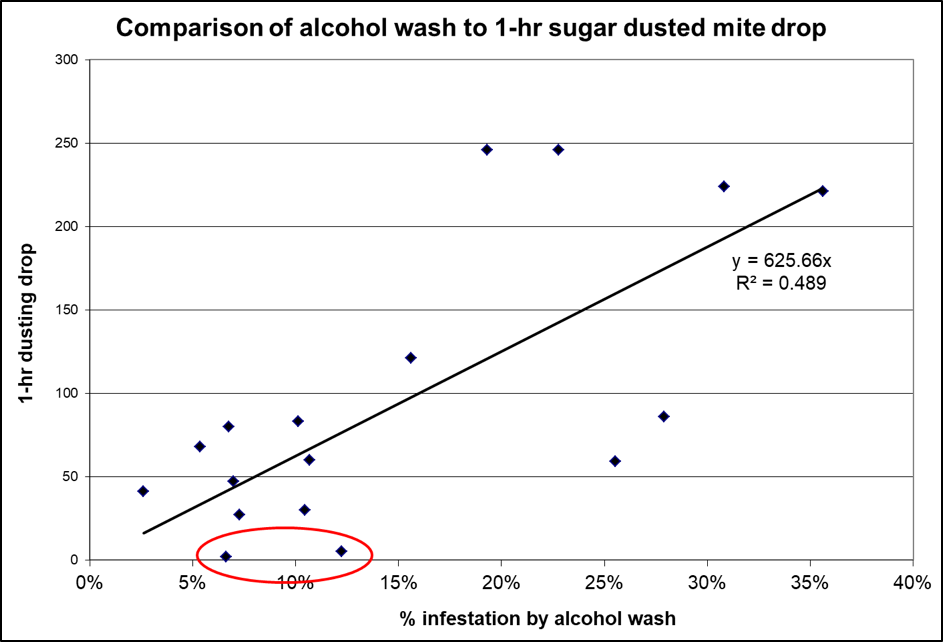
Figure 5. As with natural mite fall, an accelerated drop must be adjusted for the number of frames of bees actually dusted. The above data is from double deep hives. Note, however, that for two of the hives with appreciable mite infestation rates (circled), that almost no mites dropped in the first hour (nor had many dropped even by three hours, not shown).
Brood dissection
- Typically drone brood dissection: This tedious method can quantify the percent of brood cells infested by mites, but which 100 cells to sample? As pointed out by Fuchs [[7]], the distribution of mites in brood cells varies greatly from comb to comb, and within the cells of a patch of brood (Fig. 6). Charriere [[8]] found that “The parasite load of drone cells was seen to vary from one- to six- times in the space of a week, without any relation to the actual varroa population”. In our operation, we run a drone comb in each hive, but after inspecting many frames of drone brood with a cappings fork, I concur with Charriere. And in in dry climates, there is little drone brood available for inspection during the critical late-summer period anyway.
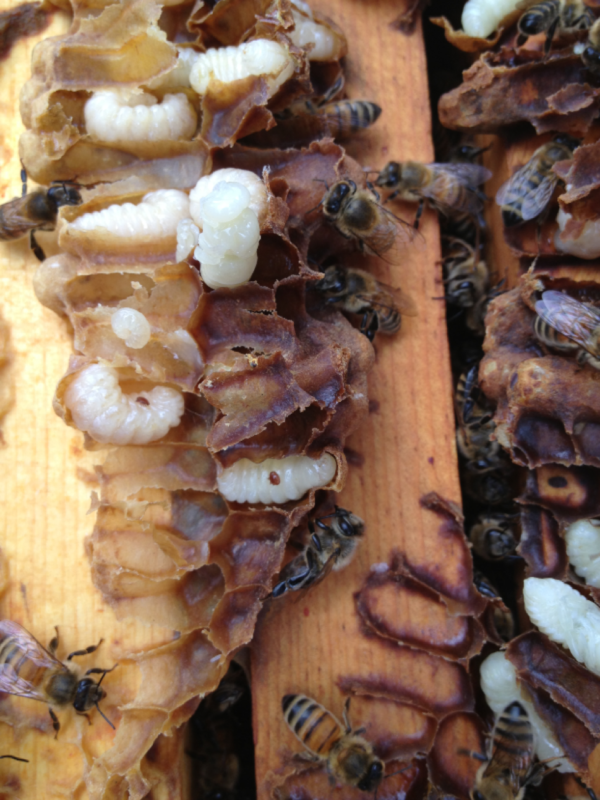
Figure 6. It’s definitely worthwhile to quickly inspect broken-open drone brood on the top bars. We do so as we are splitting our colonies after almonds – if we see mites in the drone brood at that time we take action. But as far as being a reliable monitoring method (even with a drone trap frame), it is inconsistent.
Practical application: According to BIP surveys [[9]], beekeepers use mite drop and drone brood inspection about as much as they do the adult bee sampling methods below. Mite drop count gives a general idea of the total mite population in a colony, but must be interpreted relative to the amount of bees and brood in the hive. Not so with the methods below, for which a good case to be made that determining the infestation rate of the adult bees is more biologically relevant to colony health.
Adult bee sampling
All the methods below involve taking a sample of a half cup of workers (~315 bees). But since these bee samples represent fewer than 1% of the bees in the colony, the choice of comb is important (to be covered later), as well as how the bees are handled prior to being placed in the jar, how accurately the half cup is leveled off, and how the mites are then dislodged and recovered from the bees.
Practical note for baby boomers: any method that involves identifying and counting mites requires good close-up vision. Put your danged reading glasses on!
I’ve listed some commonly-used methods below, in order of expected mite recovery. However, that recovery is all in the details, which I’ll investigate in a following article.
- Alcohol wash. I’ll unabashedly state that this is my favorite. I originally used Dr. Medhat Nasr’s handy design for a shaker made from two plastic peanut butter jars [[10]]. But a problem with the two-jar method is that a percentage of the mites get caught in the bees after the last shake, as the alcohol filters down through them [[11]]. I found that the method can be improved by instead using two nested cups and using a swirling action – as opposed to shaking — to avoid washing the mites back up into the bees with each shake. Instructions for such cups are at [[12]].
- Powdered sugar roll. Can be accurate if properly performed – by rolling the bees in the sugar prior to shaking, which causes them to heat up and make their mites release. The required full minute of vigorous shaking is hard on the arms – use a lightweight plastic jar. The main advantage of this method is that the 300 bees are only brutalized rather than sacrificed
- Detergent wash. This method also works quite well, especially if performed with non-sudsing powdered dishwasher detergent.
- Ether roll. Quick, reasonably accurate [[13],[14]], and widely used, but it may exhibit poor mite recovery [[15]].
- CO2 Although very attractive since the CO2 doesn’t kill the bees, I found the method to be inconsistent [[16]].
Practical note: all of the above methods are only as good as how well you perform them. If you cut corners, or don’t exactly understand the importance of details in technique, your mite counts may not be reliable.
I’ve found the alcohol wash to be the most reliable method, as did Azizi [[17]]. It’s quick, consistent, and can result in better than 95% mite recovery in a minute, with the sugar roll a close runner up. In our selective breeding program, we are now performing over 2000 alcohol washes per year. We graduated from hand agitation of the wash cups to machine agitation in the field. We now use portable mite wash agitators of my own design, with 60-second built-in timers, calibrated to recover at least 95% of the mites in the first minute (I’ve got a 1-minute video at [[18]]). We now fly through our apiaries taking bee samples (Fig. 7).
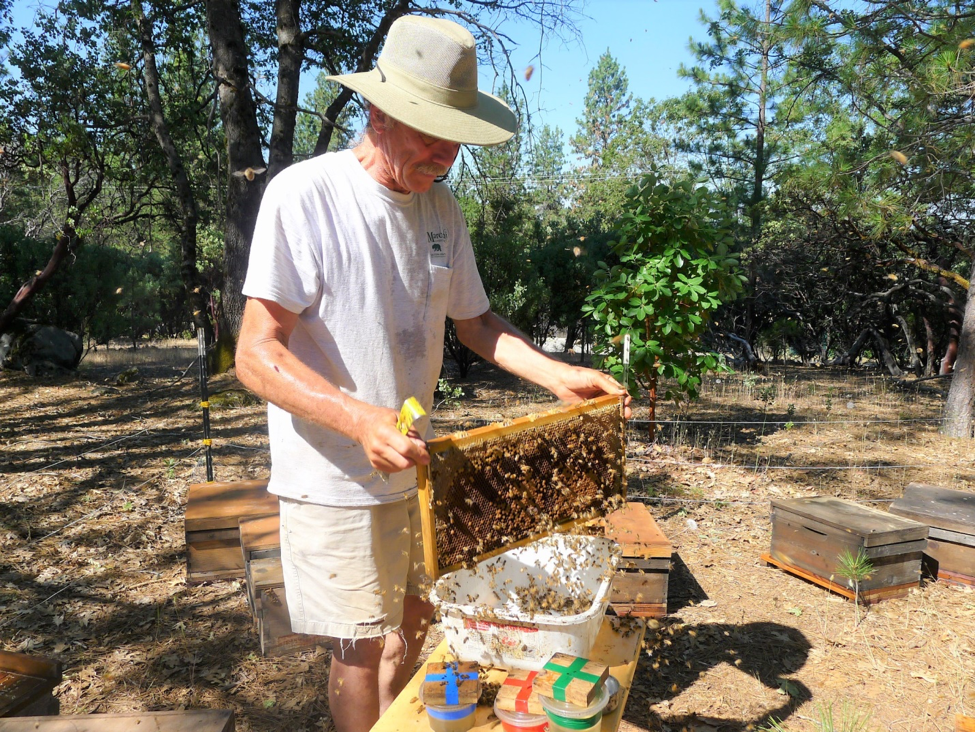
Figure 7. Our selective breeding program for varroa resistance is based upon alcohol wash counts. It occurred to me that it was time to confirm the reliability and details of the techniques that we were using.
I realized that our methods were largely based upon interpretations and assumptions rather than hard data. I couldn’t truly say that I knew the answers to the following questions:
- Does the mite infestation rate of sampled bees vary much from comb to comb in a hive?
- Which combs in the hive produce bee samples that best reflect the infestation rate of the adult bee population of the colony as a whole?
- Is it necessary to disrupt the broodnest by pulling brood combs, and can we minimize the chance of inadvertently killing the queen by avoiding the broodnest?
- Does allowing some shaken bees to fly out of the tub prior to scooping up a sample, affect the mite infestation rate of the remaining bees?
- Does it make a difference which concentration of alcohol that we use in an alcohol wash?
- How strongly do we need to agitate the bees to dislodge the mites?
- Which agitation action is the best to apply during the wash?
- Does it make a difference how long we agitate the bee sample in the alcohol?
- What sort of mite recovery can we expect to obtain? Can we consistently get 95%+ recovery? Can we get 100%?
Yeah, a lot of good questions – the first half of them apply to adult bee sampling in general, the second half specific to alcohol wash. Yet despite the alcohol wash being so widely recommended, it’s hard to find hard data to answer those questions.
The best data is obtained from colonies with high mite counts, otherwise it’s difficult to separate out the effect of any detail from random variation. So when I had a number of high-mite hives at my disposal late last season, I ran a ton of tests to answer the questions above. Some of the answers surprised me.
Coming: In my upcoming articles, I’ll present data to help answer each of the above questions in turn.
References
[1] Delaplane, K & W Hood (1999) Economic threshold for Varroa jacobsoni Oud. in the southeastern USA. Apidologie 30: 383-395.
Bieńkowska, M & Konopacka (2001) Assessment of honeybee colonies infestation by the mite Varroa destruktor based on its natural mortality during the summer season. Vol. 45 2001 Journal of Apicultural Science 45: 129-140.
[2] Rademacher E. (1985) Ist eine Befallsprognose aus dem natürlichen Totenfall von Varroa jacobsoni möglich? Apidologie, 16(4): 395-406
[3] https://scientificbeekeeping.com/mite-management-update-2013/
[4] Fell, RC, et al (2010) The spatial distribution of varroa mites in honey bee hives. Proceedings of the 2010 American Bee Research Conference
[5] Ibid.
[6] https://scientificbeekeeping.com/fighting-varroa-biotechnical-tactics-ii/
https://scientificbeekeeping.com/powdered-sugar-dusting-sweet-and-safe-but-does-it-really-work-part-2/
[7] Fuchs, S (1985) Quantitative diagnosis of the infestation of bee hives by Varroa jacobsoni Oud. and distribution of the parasitic mite within the hives. Apidologie 16(4): 343-368.
[8] Charriere, JD, et al (2003) The removal of capped drone brood: an effective means of reducing the infestation of varroa in honey bee colonies. Bee World 84 (3): 117-124.
[9] https://research.beeinformed.org/survey/
[10] Nasr, M & A Williamsongg (2010) Varroa hand shaker: a simple field method for monitoring varroa mite infestations. Proceedings of the 2010 American Bee Research Conference.
[11] See Table 1 at https://scientificbeekeeping.com/mite-management-update-2013/
[12] https://scientificbeekeeping.com/an-improved-but-not-yet-perfect-varroa-mite-washer/
Also https://scientificbeekeeping.com/mite-washer-still-improving/
[13] Devlin, S (2001) Fig. 7 in Comparative analyses of sampling methods for varroa mites (Varroa destructor Anderson and Trueman) on honey bees (Apis mellifera L .) M.S. Thesis, Simon Fraser University.
[14] Rinderer, T, et al (1990) Varroa mite detection in beehives: evaluation of sampling methods using tobacco smoke, fluvalinate smoke, amitraz smoke and ether-roll. American Bee Journal 130(2): 127-129.
[15] Azizi,H, et al ( 2008) The comparative evaluation of the laboratory methods of separation mite varroa from the mature honeybee. Research Journal of Parasitology 3: 123-129.
[16] https://scientificbeekeeping.com/a-test-of-using-co2-for-bee-friendly-mite-monitoring/
[17] Azizi,H, et al ( 2008) Op cit.
[18] https://www.youtube.com/watch?v=p8ckGYwCJ7U
Beekeeper-Funded Research
An Experiment to Improve Pollen Sub: Part 2
Randy Oliver
ScientificBeekeeping.com
First published in ABJ May 2020
In my last article I laid out the reason that I ran this experiment, and my two suspects for being the limiting nutrient in the artificial diet – the lack of an important sterol and/or a deficiency of zinc.
objectives of the experiment
hypothesis to test
That zinc and/or 24-methylenecholesterol (24-mCh) are the limiting nutrients in the commercial pollen sub that I used, and that by increasing their amounts in a supplemented Test batch, the performance of the diet, as measured by the amount of colony growth, would improve.
expected benefit
Since protein is typically the most expensive component in a diet, a balanced formulation (not limited by zinc or sterol content) would allow more complete utilization of the total protein, and thus better cost efficiency of that diet.
experimental design
We utilized the extended period of pollen dearth in the Sierra Foothills — during which colonies typically decline in strength — to compare the amount of colony growth resulting from the feeding of four different diets:
- Positive Control: a benchmark “optimal” diet consisting of blended bee-collected pollens from three sources, mixed with Drivert sugar and Pro-Sweet syrup to match the protein and sugar content of the two pollen sub patties.
- Negative Control (no protein): a benchmark protein-free diet consisting of Drivert sugar and Pro-Sweet syrup to match the sugar content alone of the Control and Test patties.
- Control: Off-the-shelf Ultra Bee Bulk Soft patty.
- Test: Ultra Bee Bulk Soft patty supplemented with zinc and 24-mCh from borage oil replacing the canola oil in the Control patty.
Summary: So of the four diets to be tested, two – the Positive Control natural pollen, and the Test (Supplemented) formulation — would contain appreciable quantities of 24mCh (although there was much more in the natural pollen patties). On the other hand, the Control (off-the-shelf) and Negative Control (sugar) patties would contain only a trace or none, respectively (Table 1).
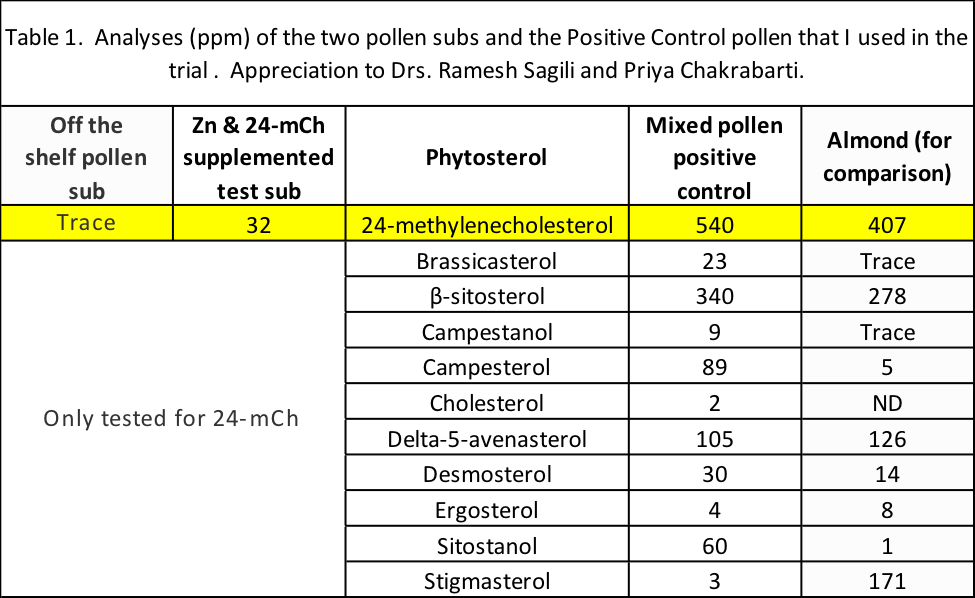
The colonies and environmental conditions
We started with equalized 5-frame nucs with young queens, varroa controlled, and attempted to grow them to maximum size during the highly unfavorable summer/fall/winter dearth period in the Sierra Foothills. .
Practical application: Running a meaningful test of artificial diet requires an environment in which natural pollen is lacking, since as was evident in my 2013 trial and another study I performed [[1] ], there is scant or no benefit from feeding pollen sub when there is a natural pollen flow on.
We would equalize the colonies to start, and then grade them for cluster strength at three additional time points, with the final grading taking place shortly before the financially-important almond pollination season. The trial would thus mimic the situation and conditions faced by inland California beekeepers attempting to grow late nucs for almond pollination.
Materials and methods
In mid-July we had a bunch of late nucs in a yard, ready to be moved to a better location. Instead, we distributed spaced pallets and transferred the nucs to singles on the pallets (Figs. 1-3).
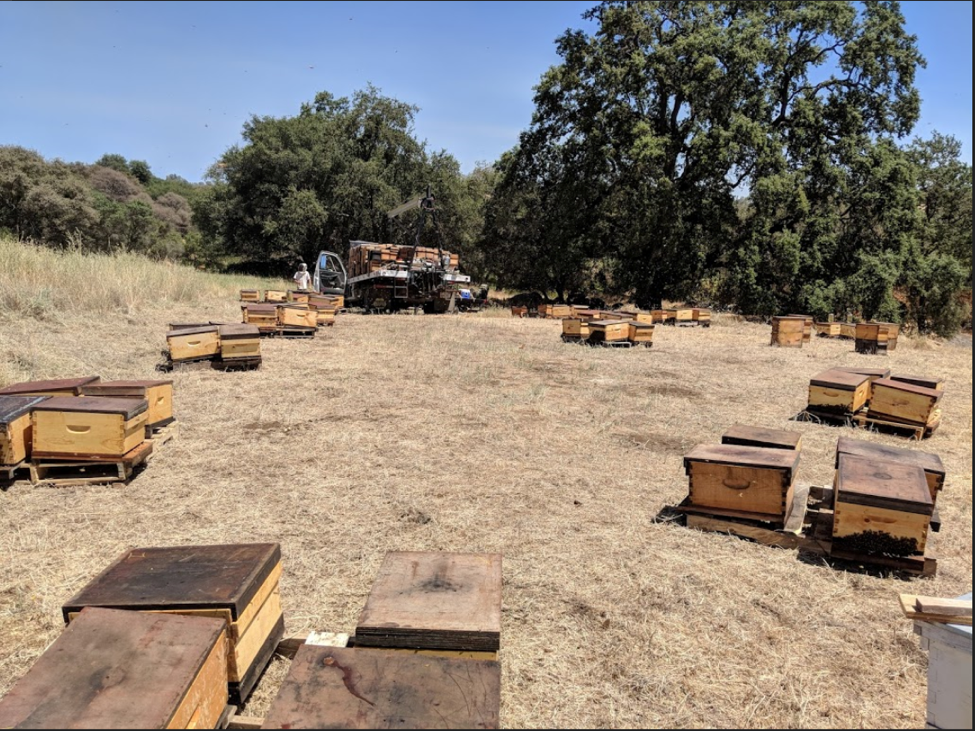
Figure 1. The experimental yard after transfer. Pallets well-spaced and cocked, all four entrances on each pallet facing in different directions, in order to minimize drift. At this point, they were ready to equalize.
On 6 August we began equalizing the colonies to 5 frames covered with bees, replacing any colonies with poor queens or brood.
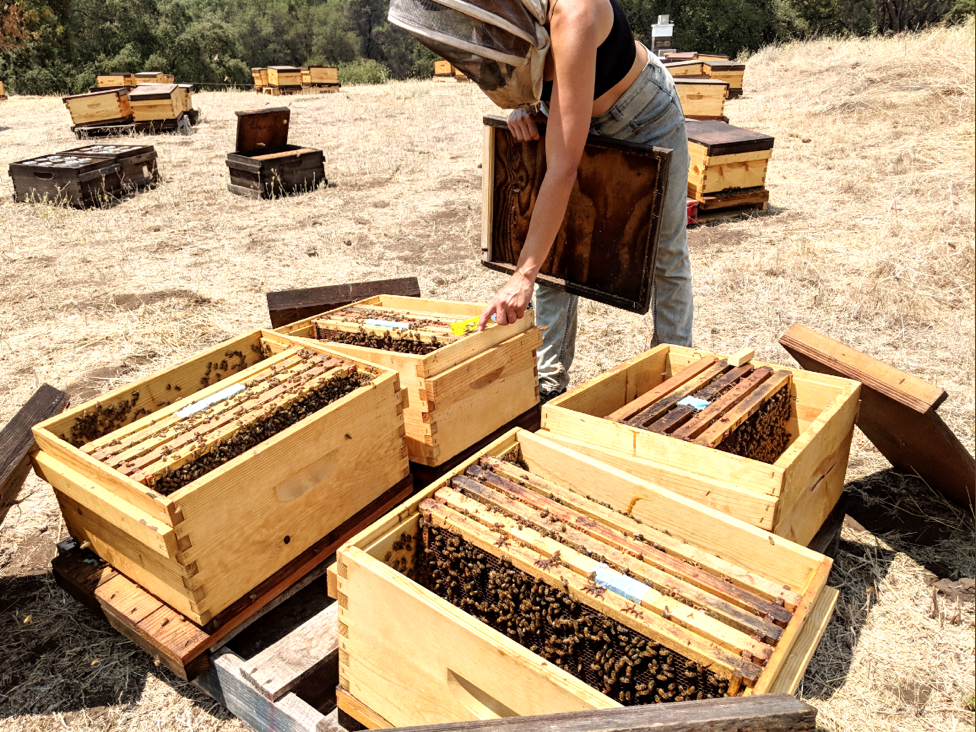
Figure 2. In order to equalize the colonies, we only install 5 frames at first, so that we could quickly determine cluster size by eyeballing the bee coverage of the exposed outer frames. I find this technique works well for equalizing cluster sizes. The blue towels contained oxalic acid and glycerin for mite management; this application method is not yet approved by EPA [[2]].
Figure 3. We used a sieve box to shake bees from stronger colonies into weaker ones, over the course of three days. At the final equalization, each colony contained three frames with brood, with the outer comb sides each ¾ covered with bees, making sure that the four hives on each pallet were very closely equalized (for a good randomized block design).
At this point we filled the hives with another five frames of drawn comb, numbered the hives, and randomly assigned their treatment group, evenly distributed to each pallet. There were 13 each of Negative and Positive Controls, and 26 each of the two pollen sub types. Now we were ready to start feeding them.
Preparation of the test patties
I’d requested Mann Lake to provide the Test and Control pollen sub formulations weighed into 1-lb patties between waxed paper. I obtained analyses and recipes for the patties, from which I could calculate the protein content (67 g/patty), as well as the amount of added sugar (234 g/patty). I then formulated the Positive and Negative Control patties on-site with matching protein and/or sugar contents.
For the Positive Control patties, I used trapped cleaned pollen from three sources — generously donated by two beekeepers who sell pollen commercially — Jeff Becker (California Bee Pollen) and Derrick and Melissa Maness (Colorado Mountain Honey). I homogenized it together, and mixed in measured amounts of Drivert and Pro-Sweet sugar (Figs. 4 & 5), which resulted in a patty weighing a little better than a pound and a half (717 g), compared to 1 pound (454g) for the Test and Control patties. The Negative Control patties were smaller, weighing a half pound plus (247 g).
Figure 4. We carefully weighed the ingredients of the Pollen Positive Control and Sugar Negative Control patties and mixed them by hand.
Figure 5. Here Brooke and I are weighing Pollen Control patties to the gram. We mixed these patties fresh for each feeding.
Abbreviated Experimental Log
9 August – We randomly assigned treatments to the four hives on each pallet, and applied the first round of patties (Fig. 6) and a gallon of Pro-Sweet syrup mixed 3:1 with water (61% sugar), with a half cup of bleach per 50 gal to retard fermentation. We fed ½ gal of syrup again roughly once a week to keep the small colonies stimulated.
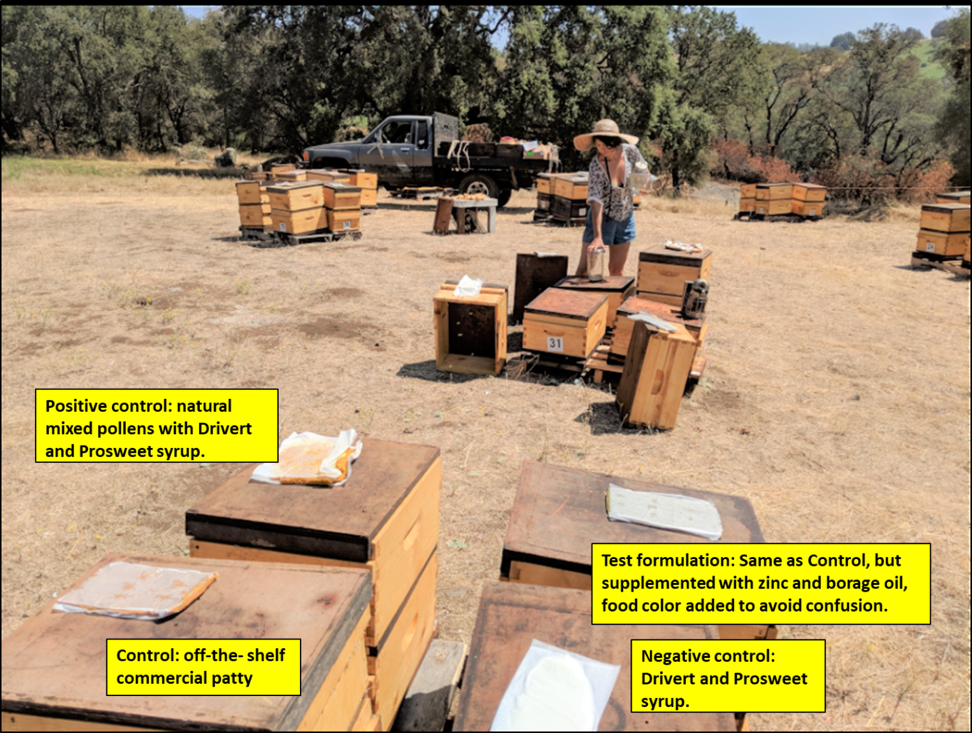
Figure 6. Brooke feeding the colonies (empty boxes are above the singles to insulate them from solar radiation). Patties got laid out by group assignment and double-checked by a second person prior to feeding. The hives were set up in a randomized block design, four hives per pallet, entrances randomly assigned to face different directions to avoid drifting. All patties contained the same amount of added sugar, and were matched for protein content, other than the protein-free Negative Control. Note the dry environment, with provided only occasional small amounts of natural pollen.
We continued to feed syrup regularly to stimulate colony growth. Unexpectedly, there was a slight amount of natural pollen coming in from the landscape from time to time.
23 August — Most of the colonies had consumed all or most of their first patty, so we added another round. There was no noticeable difference in consumption between the Test and Bulk patties, so the borage oil did not appear to have an effect upon consumption in either direction. I spot checked several hives—all were rearing brood in earnest. There was some, but not much natural pollen in the combs.
11 September — We added a 2nd brood chamber (containing 4 frames of extracted drawn comb, 5 frames of foundation), the third round of patties, plus 2 Apivar strips (Fig. 7), and continued regular syrup feeding. There was very little natural beebread in the combs.
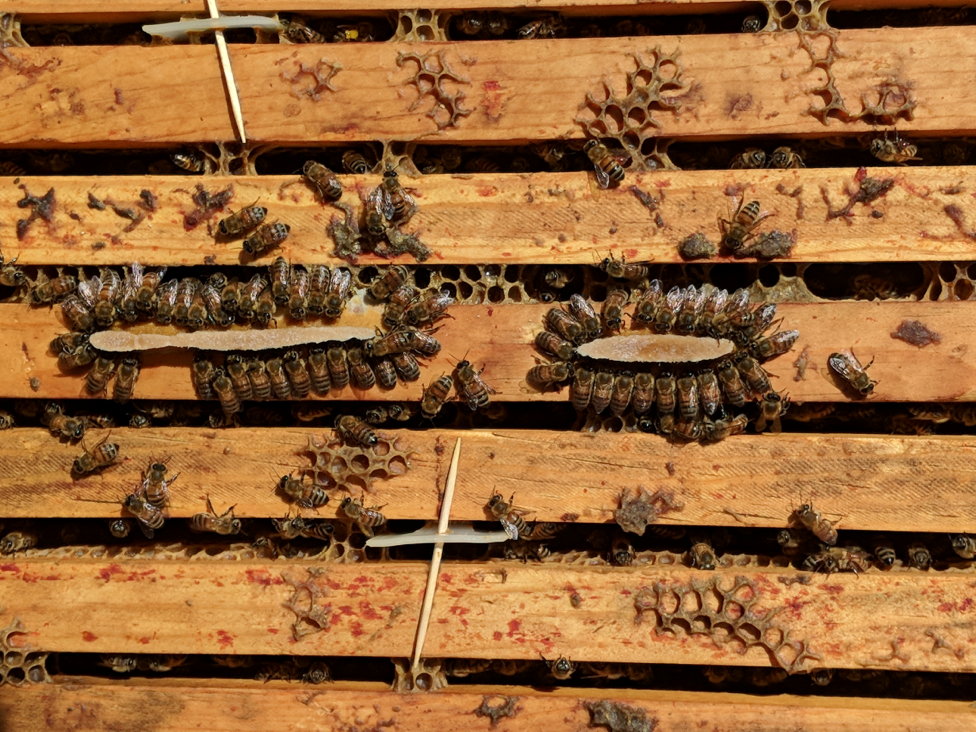
Figure 7. Good to the last smidgen—Bulk Patty and Apivar strips. Surprisingly, the pollen sub patties were being consumed at roughly the same rate as the natural pollen Positive Controls.
21 September — Patty feeding #4. Colonies OK, but many not yet building substantially. No brood at all in the upper drawn combs of 10+ hives that I checked. Checked for jelly around 2nd-instar larvae—abundant jelly in all groups other than Sugar Control. Although Sugar Controls had good-looking brood, it appeared that they may be cutting back on jelly feeding. In general, there was less sealed brood than I’d hoped to see—perhaps due to the warm, dry weather. We’ve got about two full brood cycles left for the colonies to grow before November slowdown. Fed ½ gal syrup on Thurs, another on Monday, in order to sustain an artificial nectar flow.
26 September — Checked a Sugar Control: a fair amount of natural beebread on one frame.
4 October — Patty feeding #5. It occurred to me at this time that the supplemented Test patties might be lacking in omega-3 fatty acids, so I mixed up canola oil with Drivert sugar and started applying a scoop each time we fed a patty, to both the Control and Test groups (Fig. 8).
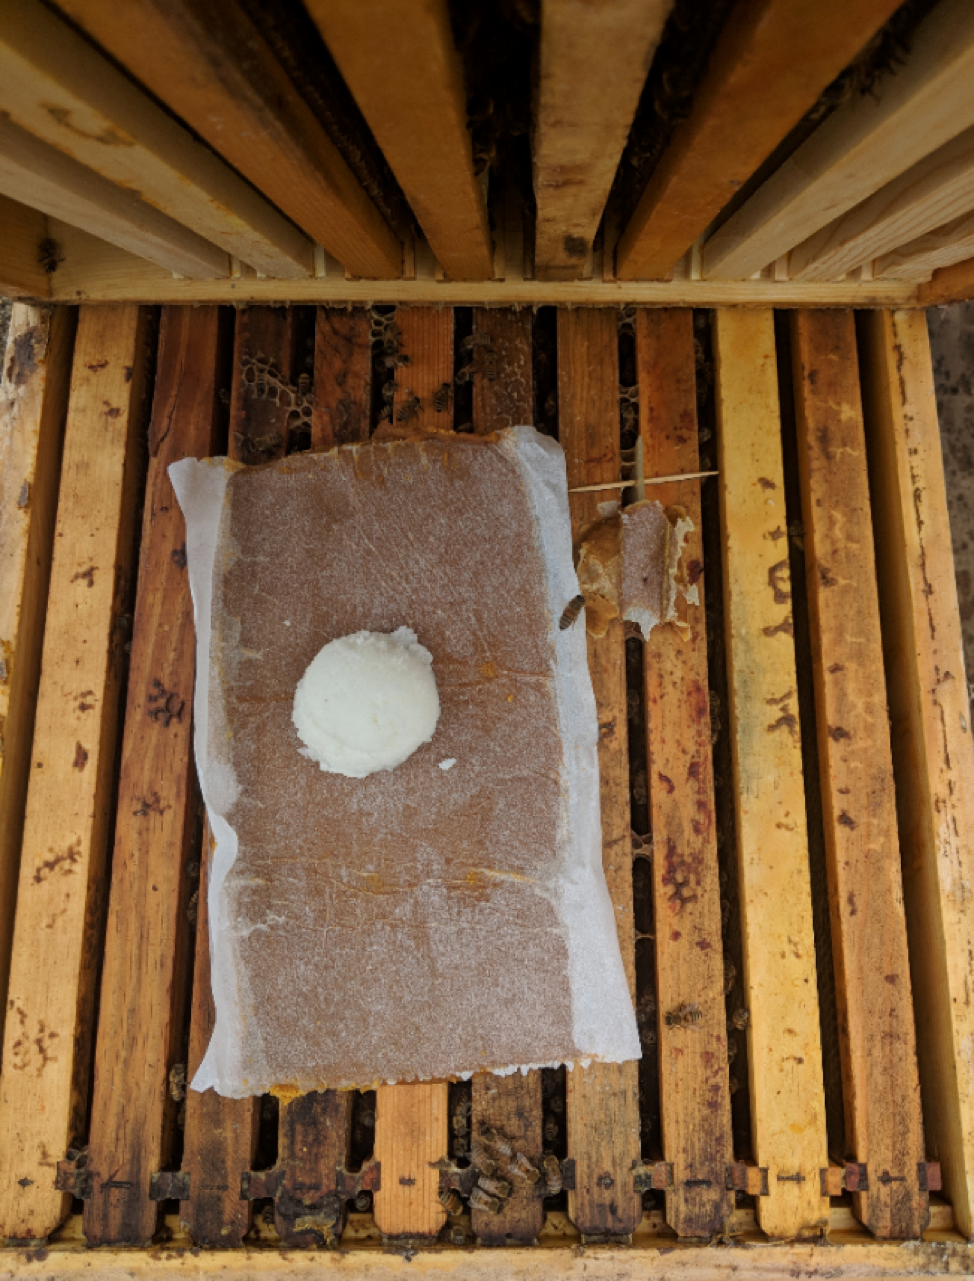
Figure 8. Belatedly realizing that the borage oil may not be providing enough omega-3 fatty acids to the Test patties, we started applying a scoop of canola oil patty to both of the pollen sub groups along with their patty.
16 October — Patty feeding #6, along with a scoop of canola oil patty. Big Bummer—yellow pollen in the hives. Yet patty consumption was very good. The bees have filled the 4 drawn combs in the upper boxes with honey—no brood up there. But very little drawing of any foundation. Frustratingly, colony variability is huge; and no apparent correlation between colony strength and patty consumption, nor do I observe any clear correlation between buildup and patty type.
30 October —Time point #1 grading (end of season). Patty feeding #7. Started grading at 7:00 am, cold and dark, finished by 8:00, clusters still tight.
30 November —Removed and weighed any uneaten patties (no consistent differences). Spot checked for brood. Checked one hive each for protein-fed groups—all had a fair amount of open brood, plus a patch or two of sealed brood. Checked 4 Negative Control hives—not all had sealed brood; only one had a small amount of open brood. Conclusions—feeding of protein extended the duration of broodrearing, but at a fairly low level.
4 December — Time point #2 grading (winter minimum cluster size).
27 December —Started feeding patties and syrup again (patty feeding #9
14 January — Last patty feeding (#10). Some alder pollen coming in between breaks in the rain, but rain and cool weather predicted. Large within-group variation of consumption—some smaller clusters had consumed every bit of their patty, whereas some larger clusters still had at least half remaining.
28 January — Time point #3 grading (pre-almond cluster size). Graded midday with a little flight going on (in order to compare to normal almond grading) (Fig. 9). Large amounts of alder pollen coming in and stored in the combs. Even the Sugar Control hives typically had 2-3 frames well-covered with mostly sealed brood; the stronger hives in the other test groups had even more brood. When I checked the sealed brood for age, it was clear that the adult bee populations were from brood reared prior to alder pollen coming in. Almond bloom is still at least two weeks away, so we expect that the clusters will be substantially larger at grading time, due to the emergence of the frames of sealed brood.
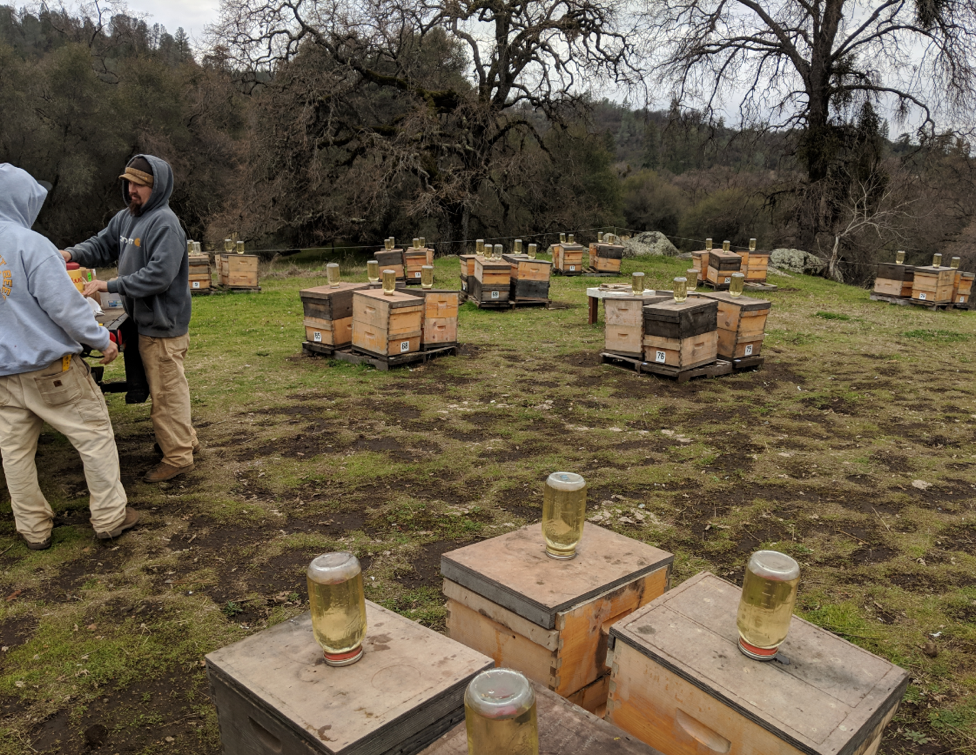
Fig. 9. By the end of January, we needed to grade the colonies for strength prior to any workers emerging from brood that was reared once alder pollen supplied nutrition other than from the test diets. It was still three weeks from when the hives would be graded for strength in the almond orchards.
Three very weak hives had water pooled on the bottom boards, so were excluded from analysis. We took mite washes from 8 hives to confirm varroa control by the Apivar strips—didn’t find a single mite. The trial was over.
summary
The trial ran from 9 August through 28 January (172 days), during which minimal natural pollen or nectar were available, at an elevation that seldom sees a winter frost.
Each colony received 10 feedings of patty, for a total of 10 lbs of pollen sub, just under that amount of natural pollen (with additional sugar added), or sugar patty alone. Each colony received 17 half-gallon feedings of 61% sugar syrup (9½ gallons in total).
As we’ve found in previous years during our summer dearth, it’s difficult to build nucs started after June up into strong colonies for winter. Even with considerable nonstop feeding, they just don’t grow at the same rate as nucs started in the springtime. But they clearly grew enough to see the benefit of feeding supplemental protein, whether of natural pollen or pollen sub.
Results
It’s easy to convince oneself you’ve got a great idea. But in this case, hard data did not support my hypothesis that supplementing pollen sub with zinc and 24-mCh would improve its performance (although I suspect that zinc is still a good idea). The results are graphically (and disappointingly) displayed in Fig. x.

Figure x. There was a clear difference in performance between the colonies fed natural pollen and the sugar control (p = 0.002), but not so much between natural pollen and the pollen subs. I arbitrarily excluded any “problem” colonies with disease or other unidentified issues. Of possible interest is that there were no “problem” colonies in either the Pollen Control or Sugar Control groups, despite one group being stronger on average, and the other weaker than the pollen sub groups.
Practical application: In the above graph, the down-and-up changes in cluster size may largely be an artifact of temperature rather than population. Note how close the end-of-January sizes reflect the end-of-October gradings.
Discussion
This trial was intentionally run under poor conditions for colony growth. In springtime, a 5-frame nuc in this same location can easily grow on natural forage to a 20-frame colony in two months. Not so for a nuc started in July, which typically won’t grow at all. I had hoped that by providing natural pollen ad libitum, along with abundant sugar syrup, that I might be able to stimulate the natural pollen positive control group to at least build up to 15 frames of bees. That didn’t happen – by the end of October, only two of twelve had reached 10 frames in strength, with an overall mean cluster size for the group of only 8.5 frames.
The results indicate that:
- Colonies don’t grow well in my environment in late summer, even if they are abundantly fed with natural pollen and sugar syrup.
- Honey bees appear to be able to convert other sterols into 24-mCh.
- There was no apparent benefit from the high level of 24-mCh in the natural pollen Positive Control patties, compared to the mediocre level in the borage oil Test patties.
- Canola oil apparently works well as a lipid and sterol source in pollen sub, even though it is deficient in 24-mCh.
- A good pollen sub can perform, on a weight to weight basis, better than natural pollen. But natural pollen appeared to hold a slight lead on a per gram protein basis (Table 2).
- An unanswered question is why the excluded sickly colonies appeared only in the pollen sub groups – perhaps due to gut dysbiosis of some sort?
- In any case, this trial confirmed the clear economic benefit, under the conditions of this trial, of feeding pollen sub (Table 2).
| Table 2. Return on Investment from Feeding Pollen Sub |
|
Mann Lake
Bulk Soft Patty |
Positive Control Patty of natural pollen and sugar |
| Weight (mass) of each patty (g) |
454 |
717 |
| Amount protein per patty (g) |
67 |
67 |
| Amount of added sugar per patty (g) |
234 |
234 |
| Total patty mass fed per hive in the 10 feedings (g) |
4540 |
7170 |
| Mean amount of patty residue not consumed (g) |
352.6 |
107.5 |
| Net patty consumption (lbs) |
9.2 |
15.6 |
| Median colony strength* gain over sugar controls |
2.5 |
3 |
| Net gain in strength per pound patty consumed |
0.27 |
0.19 |
| Net gain in strength per gram protein consumed |
0.37 |
0.45 |
| Rental rate in almonds per frame of bees |
$25.00 |
$25.00 |
| Dollar return per pound of patty fed |
$6.78 |
$4.82 |
| Cost per pound for pollen sub |
$1.20 |
|
| Return on investment (not counting labor) |
465% |
|
| * Measured as frames covered with bees for almond grading. The strength difference would likely have been even greater by bloom time. |
Practical application #1: My cost, with labor factored in, of feeding the sugar alone group was around $43 per nuc. On average, those nucs didn’t make 6-frame minimum grade for almonds. Adding an additional $12 for feeding pollen sub, allowed us to rent 8-framers for $200, a nice return on investment.
Practical application #2: For colonies that are already well-established in doubles, the feeding of 8-10 lbs of pollen sub during September and October (after serious varroa control in August), in our experience makes all the difference in the world for bringing premium hives to almonds (better than $200), due to that feeding resulting in the production of a generation of workers that will form a larger and better-nourished winter cluster.
A follow-up field trial
Since there are new pollen subs on the market since I ran the comparative trial in 2013 (including one of spirulina), I’m currently planning to run another large-scale comparative trial this summer, and would appreciate funding donations from those interested in seeing the results.
Acknolwedgements
I thank the donors to ScientificBeekeeping, whose generous contributions are my sole source of funding for all my research projects.
Thanks to Mann Lake Ltd. for preparing and donating the Test and Control patties, and the Pro-Sweet syrup for the trial. Thanks also for the donations of pollen from Jeff Becker at California Bee Pollen [[3]], Derrick and Melissa Maness at Colorado Mountain Honey [[4]], and Paul Limbach (Western Colorado Honey). Much appreciation to Dr. Priya Chakrabarti for the sterol analyses.
References & Notes
[1] https://scientificbeekeeping.com/when-to-feed-pollen-sub/
[2] I obtained a Pesticide Research Authorization from the California Department of Pesticide Regulation.
[3] https://www.californiabeepollen.com/ 916-396-1697
[4] https://www.coloradomountainhoney.com/
Beekeeper-Funded Research
An Experiment to Improve Pollen Sub: Part 1
Randy Oliver
ScientificBeekeeping.com
First published in ABJ April 2020
In my location, we may not see a drop of rain all summer long, so our colonies become pollen-starved. In order to prepare strong colonies for almond pollination, I used to move them to better forage out of state, but now instead feed pollen sub to build them up before winter. Today’s pollen subs are really good, but I’m always looking for ways to improve them.
Introduction
With the demand for strong colonies of bees for almond pollination, coupled with landscapes that are offering less and less bee forage, we beekeepers are feeding more and more artificial diet in the form of pollen subs. Not only is forage being affected by changes in agriculture, but temperature and rainfall are changing with the climate. Of serious concern is a finding brought to our attention by USDA researcher Lewis Ziska [[1]], who found that during my lifetime, in response to rising levels of CO2 in the atmosphere, that the amount of protein in goldenrod pollen has apparently decreased by a third, thus forcing our bees to work even harder to obtain critical nutrients. Thus there is huge interest by beekeepers as to what are the “best” pollen subs.
Practical application: There is a crying need for someone to perform the service for beekeepers that Consumer Reports does for other consumers — to test products on the market one against the other.
With that intent, in 2013 I ran a field trial to compare the performance of various pollen sub formulations on the market [[2]] — testing to see how well they supported colony growth over the six months prior to almond pollination. The results clearly demonstrated that the feeding of protein patties resulted in far greater colony strength. I also found that although some of the pollen subs initially outperformed natural pollen (on a pound-per-pound basis), that over time, they appeared to lose the lead (Fig. 1).
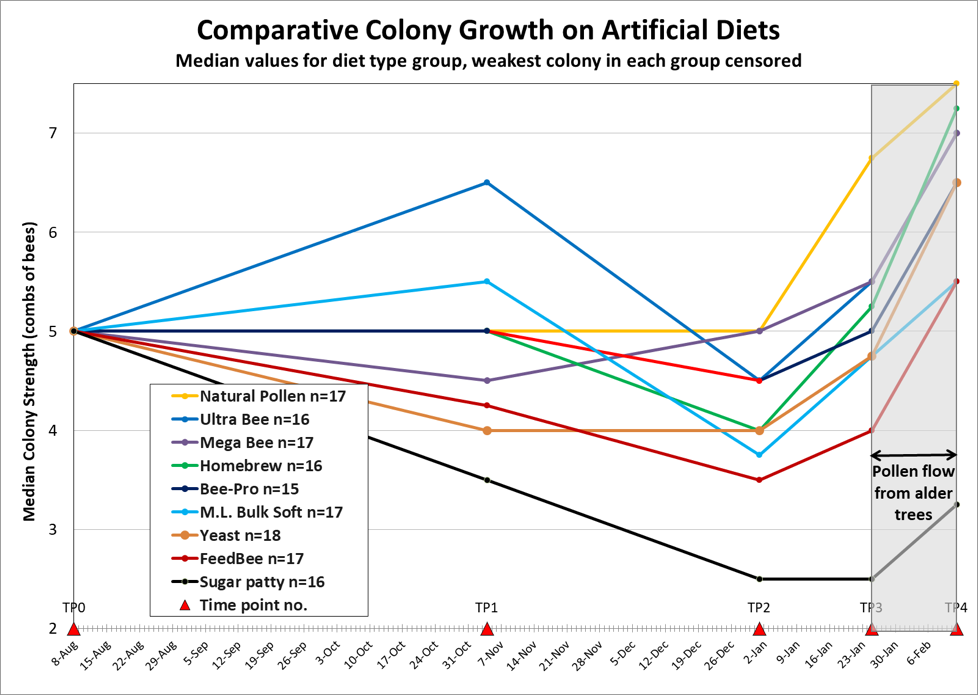
Figure 1. The results of the 2013 trial (product formulations may have changed since then). I shaded the plots of colony growth after 25 January, since that growth was sustained by worker emergence resulting from a natural pollen flow from alder, which began three weeks earlier. Note that two of the artificial diets initially outperformed the natural pollen patties. This may have been due to the higher protein content of the artificial diets. My question was whether those diets were deficient in a limiting nutrient that eventually prevented full utilization of the protein.
Practical application: At this point, allow me to make it clear that for short-term colony buildup, some artificial diets performed as well or better than natural pollen. It is only under conditions of sustained artificial feeding that any nutritional deficiency may become apparent.
Full disclosure: This article is about a follow-up pollen sub trial that I ran in 2018. I had to decide whether to name the commercial product that I used for the test, since I knew that beekeepers would ask me. I left it up to the manufacturer, who granted me permission to do so. That said, I pride myself on my objectivity, and have no wish to endorse any product. In our commercial beekeeping operation, we do use commercial products, but our use does not constitute endorsement or favoritism. In the case of pollen subs, a number of us California beekeepers prefer to chop pollen sub into chunks for feeding, rather than purchasing it in preformed flat patties (since we can place more of a soft chunked patty within the cluster). One manufacturer offers such a patty for sale, thus eliminating our need to mix our own. That product is Mann Lake’s Ultra Bee Bulk Soft Patty (hereafter called the Control sub). Since I was familiar with the field performance of that product, for this trial I approached the manufacturer to see if they were willing to prepare a custom batch to my specifications. Since they would benefit from knowing the results, I asked them to donate the feed for this trial, which they did. I received no other compensation from the company, and all other costs were funded by donations from beekeepers. The results of this trial do not constitute endorsement of any product, but rather information of use to anyone producing pollen subs. FWIW, since new pollen subs have come on the market since my 2013 trial (notably Dadant’s AP23 and HealthyBees spirulina patty), I’m planning to run another comparative trial this summer.
My experimental objective
I wondered whether there was something missing or in short supply in the best-performing subs — That could be considered as “limiting nutrients.” So I ran this experiment to see whether I could improve the performance of the Control sub by supplementing it with two nutrients that I hypothesized in which it may have been deficient. Allow me to walk you through my rationale for the experimental design.
The concept of a limiting nutrient is commonly illustrated by the barrel analogy of “Liebig’s Law,” shown in Fig. 2.
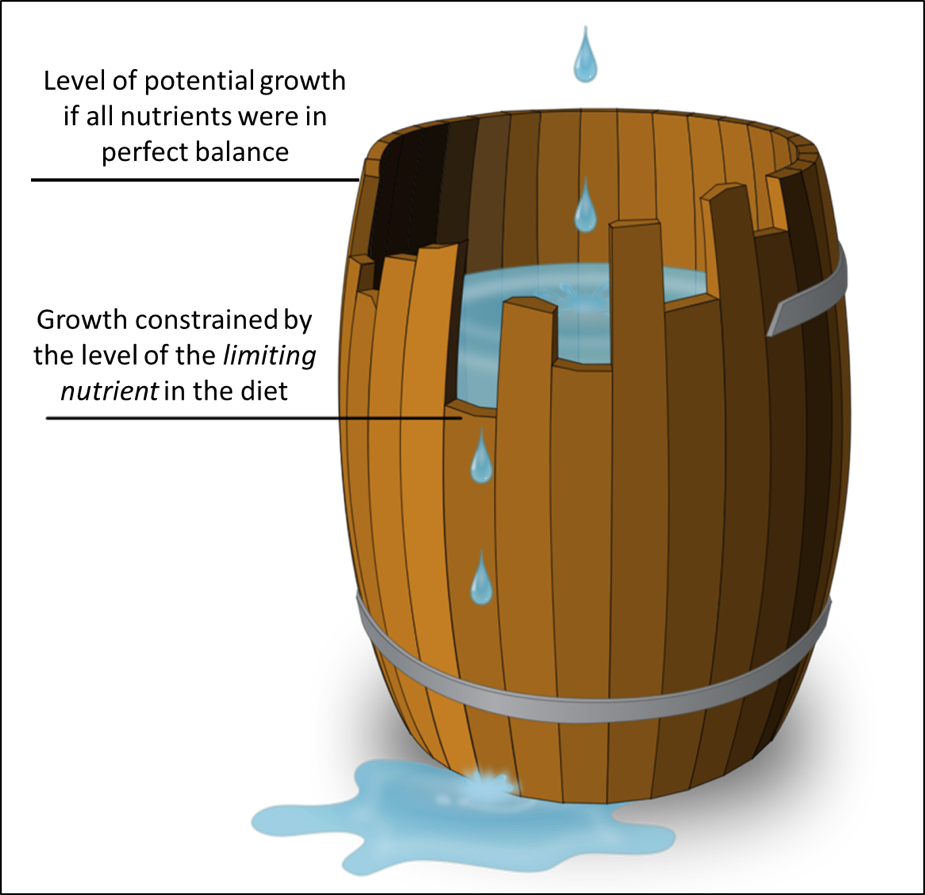
Figure 2. Liebig’s Law states that the growth of an organism is limited by the nutrient in shortest supply. Using the analogy of a barrel being filled with water, the maximum fill (total growth) is limited by that “limiting nutrient.” That nutrient could be an amino acid, a vitamin, a mineral, or perhaps (in the case of bees) a sterol. Image credit [[3]].
Keep in mind that honey bees grow at an incredible rate — faster than any other livestock species [[4]]. In order to do so, they require a well-balanced, nutrient-intense diet of nectar and pollen. Any deficiency in an artificial diet (pollen sub) will limit its overall utilization by the bees for colony growth.
Practical application: Beekeepers, researchers, and manufacturers tend to focus upon the protein and amino acid contents of pollen subs, but I wonder whether those are actually the true limiting nutrients in artificial diets. There is an economic reason to see whether this is so, since protein is the most costly component of a pollen sub. But that costly protein may be wasted if some other limiting nutrient prevents its full utilization by the bees.
Based upon my reading of the literature, two potential limiting nutrients in pollen subs came to mind: the first a plant sterol.
24-methylenecholesterol
Let me start by quoting Dr. Allen Cohen, the author of the textbook Insect Diets [[5]]:
Because insects, unlike vertebrates, cannot make sterol to support their needs, they must get it from their diet, thus making sterols, by definition, essential nutrients.
Sterols are essential components of cellular membranes, the molting hormone ecdysone, and other fundamental biological processes. Back in the ‘60s through ‘80s, researchers at the USDA ARS labs delved deeply into the sterols of honey bees [[6]], concluding that one specific sterol — 24-methylenecholesterol (24mCh) — was a major component of the jelly produced by nurse bees. More recently, Tian [[7]] found 24mCh to be a component of Major royal jelly protein 1 (MRJP1).
Each plant species produces pollen with different relative proportions of sterols, of which only a few appear to be utilized by bees. Stone and pome fruit tree pollen is notable for having high levels of 24mCh [[8],[9]], but what is especially of interest is that in colonies foraging upon low-24mCh pollens, such as blackberry or goldenrod, that the nurse bees concentrate 24mCh to levels much higher than it is in the pollen that they’re feeding upon, as evidenced by analyses by Svoboda [[10]] (Table 1).
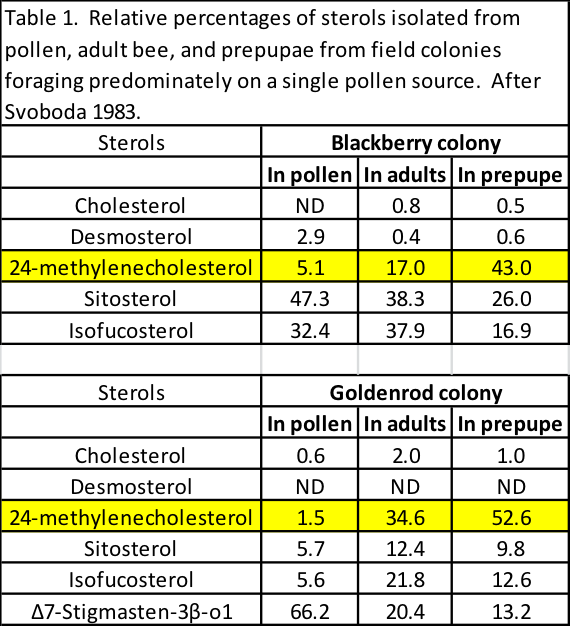
Note in the above table how the proportion of 24mCh increases dramatically from the amount in the pollen, to that in the adult bees, and then especially in the prepupae that had grown on a diet of jelly produced by the nurses.
Experimental question: The big question for those of us trying to understand bee nutrition is just how important it is for bees to obtain 24mCh directly from their diet, or how readily they are able to convert other pollen sterols into it. Svoboda [[11]] concluded that they were indeed capable of sterol conversion to some extent:
… previous studies with chemically-defined diets have demonstrated the capacity of the worker bees to provide 24-methylenecholesterol, as the major sterol in the brood food when no pollen is fed to the brood and even when no sterol is added to an artificial diet. These results indicated that the nurse bees could readily cycle certain sterols from their endogenous pools to maintain high levels of 24-methylenecholesterol, sitosterol and isofucosterol in the brood food for the developing larvae. In addition, bees from free flying colonies were found to produce brood in which there were high levels of these three sterols even when their pollen source contained low levels of these sterols.
Practical application: Although bees appear to possess the ability to convert some other plant sterols to 24mCh, I was curious as to how much 24mCh there was in the Control sub.
I had long looked for an inexpensive commercially-available source of 24mCh. Ten years ago, I couldn’t find one, since few vegetable oils contain it to any extent [[12]]. But nowadays, off-the-shelf borage oil — presumably high in 20mCh — is readily available, but I didn’t have any way to confirm that. As luck would have it, in 2017 I heard Drs. Ramesh Sagili and Priya Chakrabarti from Oregon State University present that they had paid thousands of dollars to have a batch of pure 24mCh synthesized, and that the OSU lab could use it as a reference standard to quantify 24mCh in pollen samples. This opened an opportunity for me to see whether I could use borage oil as a source of 24mCh in pollen sub. So I contacted Dr. Chakrabarti to see whether the lab could run analyses for me, to which they graciously agreed (Disclosure: I was also involved in helping the researchers to obtain funding for their research).
I sent a sample of the off-the-shelf Control sub, which tested at containing only a trace [[13]] of 24mCh (compared to a detection of over 4122 mg/100g in a sample of almond pollen). A sample of borage oil tested at 170 mg/100 g 24mCh — far less than almond pollen, but perhaps enough to make a difference in an artificial diet.
Experimental design: I would ask the manufacturer to replace the canola oil used in their pollen sub with borage oil, in order to provide a source of 24-methylenecholesterol in the diet.
The second potential limiting nutrient on my mind was a trace element:
Zinc
Zinc is well known to be a necessary nutrient in animal diets, critical for metabolic function, growth, immunity, and appetite. It is typically supplemented in animal diets to the 50-75 ppm level [[14]]. But natural bee-collected pollens typically contain only from 24-50 ppm zinc [[15]], from which nurses produce royal jelly with zinc in a narrow range of 20-25 ppm [[16]]. Zhang [[17]] fed colonies during a nectar and pollen dearth sugar syrup supplemented with zinc, and found that it took at least 60 ppm zinc for the nurses to produce jelly with a normal zinc content.
Practical application: The zinc content of natural pollens [[18]] is often below that considered optimal for animal nutrition, so it’s possible that zinc may be more of a limiting nutrient than is the protein content of incoming pollen. Of concern is that even that potential deficiency may be being exacerbated by plant response to the elevating level of carbon dioxide in the atmosphere.
Loladze [[19]], in reviewing multiple studies, found that the levels of zinc greatly decreased in plants grown under conditions of elevated CO2. And that’s not to mention that in some regions (notably the Southeast) that zinc would be expected to perhaps be a limiting nutrient in pollen, due to the deficiency of the element in the soil (Fig. 3).
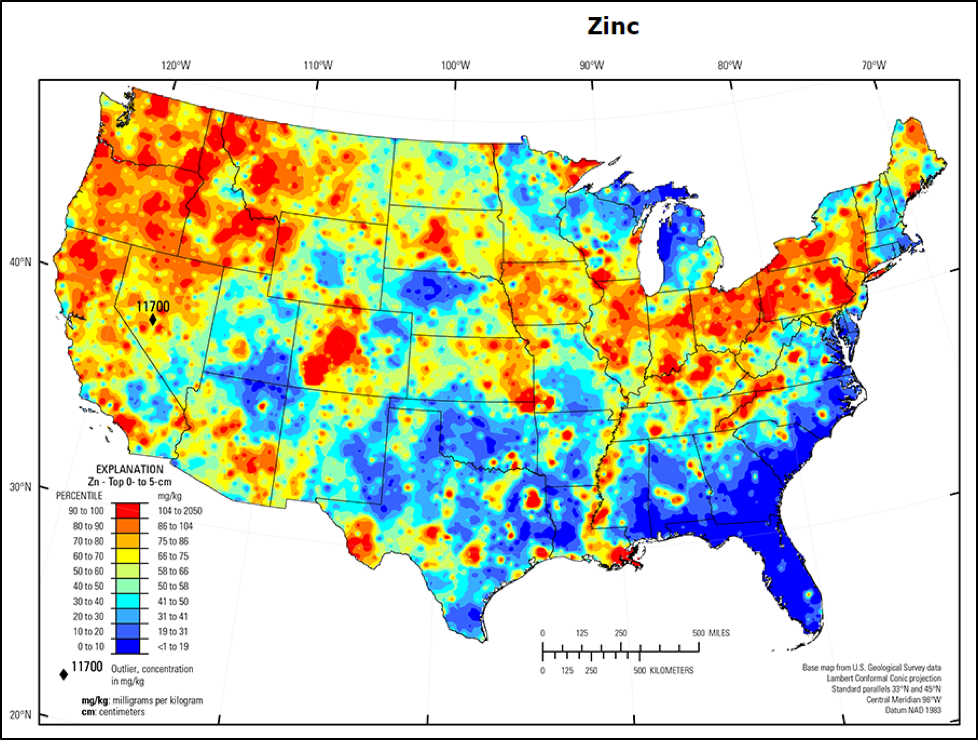
Figure 3. The availability of trace elements in the soil varies greatly across the country. The map above is for the concentrations of zinc in the upper soil level, with red indicating the highest concentration, blue a deficiency. Map credit [[20]].
Practical application: Although my experiment was run where zinc is relatively abundant in the soil, beekeepers in the blue areas of the map above may consider zinc supplementation of their colonies. To view maps of trace element contents of the soil in your area, go to [[21]].
So zinc was clearly on my radar as possibly being the limiting nutrient in the pollen sub that I’ve been using. I asked the manufacturer for analysis of the Control sub, and it came back at only 20 ppm — perhaps less than optimal.
Experimental design: I would supplement the Test batch of pollen sub with zinc to 75 ppm, by adding 25% as zinc sulfate, and 75% as zinc proteinate, based upon a recommendation from an animal nutritionist.
With the object of efficiency in mind, I decided to kill two birds with one stone, and simultaneously test another potential limiting nutrient on my radar in the same batch.
Practical application: Running a controlled trial of pollen subs is costly in labor and materials. My thought was that if the double-supplemented batch exhibited increased performance, then I could later tease out which of the nutrients was responsible.
At this point I was ready to write up a protocol for a field trial. To be continued…
Acknolwedgements
I thank Mann Lake and Drs. Priya Chakrabarti and Ramesh Sagili for providing chemical analyses of products involved in this experiment.
References & Notes
[1] Ziska LH, et al (2016) Rising atmospheric CO2 is reducing the protein concentration of a floral pollen source essential for North American bees. Proc. R. Soc. B 283: 20160414
[2] https://scientificbeekeeping.com/a-comparative-test-of-the-pollen-sub/
[3] Image from https://en.wikipedia.org/wiki/File:Minimum-Tonne.svg#filelinks, modified by the author.
[4] See Figs. 1 & 2 at https://scientificbeekeeping.com/sick-bees-17-nosema-the-smoldering-epidemic/
[5] Cohen, A (2015) Insect Diets, second edition. CRC Press.
[6] Herbert, E Jr., et al (1980) Sterol utilization in honey bees fed a synthetic diet: effects on brood rearing. J. Insect Physiol.. Vol. 26, pp. 287 to 289.
Standifer, L et al (1968) Pollen sterols — a mass spectrographic survey. Phytochemistry 7: 1361-1365.
Svoboda, J, et al (1986) Selective sterol transfer in the honey bee: its significance and relationship to other hymenoptera. Lipids 21: 97-101.
[7] Tian, W, et al (2018) Architecture of the native major royal jelly protein 1 oligomer. Nature Communications 9:3373 DOI: 10.1038/s41467-018-05619-1.
[8] Loper, G, et al (1980) Biochemistry and microbiology of bee-collected almond (Prunus dulcis) pollen and bee bread, I. – Fatty Acids, Sterols, Vitamins and Minerals. Apidology 11(1): 63-73.
[9] Chakrabarti, P, et al. (2019) The omics approach to bee nutritional landscape. Metabolomics 15: 127 https://doi.org/10.1007/s11306-019-1590-6
[10] Svoboda, J, et al (1983) Comparison of sterols of pollens, honeybee workers, and prepupae from field sites. Archives of Insect Biochemistry and Physiology 1(1): 25-31.
[11] Svoboda, J, et al (1986) Sterols of organs involved in brood food production and of royal jelly in honey bees. Insect Biochem 16(3): 479-482.
[12] Reina, R, et al (1999) Sterol and triterpene diol contents of vegetable oils by high-resolution capillary gas chromatography. J of AOAC International 82(4): 929-935.
[13] I was a bit surprised by this, since I would have expected there to be a measureable amount, from the canola oil in the patty.
[14] Sloup, V (2017) Zinc in the animal organism: a review. Scientia Agriculturae Bohemica 48(1): 13—21. Sloup states that: “The amount of Zn found in compound feed for livestock is around 100 mg/kg [ppm].” Older texts suggest the 40-70 ppm range. My consultation with an animal nutritionist suggests the 50-75 ppm range.
[15] Zhang G, et al (2015) Zinc nutrition increases the antioxidant defenses of honey bees. Entomol Exp Appl 156:201—210. https://doi.org/10.1111/eea.12342
[16] Stocker, A, et al (2005) Trace and mineral elements in royal jelly and homeostatic effects. Journal of Trace Elements in Medicine and Biology 19: 183—189.
[17] Zhang (2015) op. cit.
[18] Bonvehí, J & R Jordà (1997) Nutrient composition and microbiological quality of honeybee-collected pollen in Spain. J. Agric. Food Chem. 45: 725−732.
Szczêsna, T (2007) Concentration of selected elements in honeybee-collected pollen. Journal of Apicultural Science 51(1): 5-13.
[19] Loladze, I (2014) Hidden shift of the ionome of plants exposed to elevated CO2 depletes minerals at the base of human nutrition. eLife DOI: 10.7554/eLife.02245. See Figure 1.
[20] Smith, DB, et al (2019) Geochemical and mineralogical maps, with interpretation, for soils of the conterminous United States: U.S. Geological Survey Scientific Investigations Report 2017-5118, https://doi.org/10.3133/sir20175118
[21] https://pubs.usgs.gov/sir/2017/5118/sir20175118_geo.php
Questions on Amitraz
Randy Oliver
ScientificBeekeeping.com
First published in ABJ March 2020
This past year, some beekeepers asked me a couple of questions about amitraz. So I ran some quick cage trials to obtain answers. The results surprised me.
Amitraz is a highly-effective acaricide (something that kills mites and ticks), and is widely used by beekeepers to control varroa. Some scofflaws apply it in the form of Taktic cattle dip, others via the approved time-release product Apivar. Amitraz has been consistently used by commercial beekeepers for two decades, and some are wondering whether mites are finally starting to develop resistance to it, as they did rather rapidly to fluvalinate and coumaphos. This question is being currently addressed by several researchers, and we should have an answer fairly soon. But this article is not about resistance, but rather two other questions posed to me by beekeepers.
Question number one: Does amitraz have any vapor action?
The first question was whether amitraz works purely by direct contact, or does it reach the mites by vapor action? If by direct contact only, then distribution of the chemical within the hive would be from bees rubbing against the strip (or other application matrix), with subsequent contact to the mite from a bee rubbing a contaminated leg over the mite, or the mite walking over molecules of amitraz on a bee’s cuticle. And since amitraz is soluble in beeswax, mites could be exposed to it (or its degradation products) there. Anyway, amitraz is generally considered to be a “contact miticide,” as stated by VetoPharma:
“Apivar works by contact: the active ingredient is delivered continuously over time. As bees walk on the strip’s surface they pick up molecules of the active ingredient and then distribute them throughout the colony.”
I assumed that vapor action was improbable, due to the extremely low vapor pressure of amitraz. Vapor pressure affects a substance’s evaporation rate, or how readily molecules of a solid or liquid will break free and diffuse as vapor into the air. Vapor pressure is typically measured by how high the vapors will push a column of mercury (mm of Hg) at any given temperature (20 C being the standard). To evaporate, any molecule must push against the atmospheric pressure of air – air pressing back at a pressure of 760 mm Hg at sea level.
As you can see in Table 1, substances with a higher vapor pressure than surrounding air evaporate rapidly; those with lower vapor pressures, more slowly. Amitraz would be expected to exhibit negligible evaporation.
| Table 1. Vapor pressures of some common substances. |
| Substance |
Vapor pressure at 20 C in mm Hg |
| Butane |
>1500 |
| Air pressure at 2500 feet altitude |
694 |
| Ethanol |
44 |
| Water |
17 |
| Paraffin wax |
0.1 |
| Vaseline |
0.01 |
| Amitraz |
0.000003 |
Question number two: Does amitraz degrade rapidly?
The product information for Apivar states that:
“the strips should be used as soon as possible after opening the packaging. … Further, we recommend that opened Apivar packages not be stored for more than two weeks and that the strips be used as soon as possible.” [[1]]
Beekeepers have questioned me as to how quickly the amitraz in either Apivar strips or other application methods degrades.
Experiments to answer the questions
It occurred to me that I could answer both the vaporization action and degradation questions by running some “quick and dirty” cage trials. I had unused queen cell incubators on hand, and could use a hybrid of my mite wash cups crossed with the version of Dr. Jay Evans’ cup cages that I’d developed [[2]]. I also had a few colonies with very high mite infestation rates on hand, which would allow for having enough mites in a small sample of bees to obtain meaningful data [[3]]. And by luck I had on hand a few well-used Apivar strips that had inadvertently been left exposed to bees and humidity in an experimental hive for over a year, and had then ridden on the floorboards of my truck for some hot summer months — allowing plenty of time and exposure for the amitraz to degrade.
So I had everything I needed to run a simple experiment to determine whether (1) actual contact was necessary to quickly kill mites, and (2) whether the amitraz in the “aged” strips had degraded to a measurable extent. As it turned out, my initial results were so interesting, that I expanded the experiment. In writing up the results, I thought that it would be of interest to beekeepers to see just how I ran some controlled experiments (meaning that I ran both Test and Control groups), with multiple replications (meaning repeating the experiment again and again [[4]]).
Preparation
I first ran a few preliminary tests to see how many bees I should put into each cup, and how best to modify the cups so that I could accurately collect any fallen mites over time. And then I was fortuitously visited by Dr. Jeff Pettis, who shared some tips as to how he was preparing “Pettis Test” cages for an amitraz-resistance project that he was undertaking. This information helped me to zero in on how to use measured pieces of Apivar strip to apply consistent doses of amitraz that were not too weak, or too strong.
I then prepared color-coded data sheets, and fabricated a bunch of fresh cup cages — each clearly numbered. I cut freshly-opened Apivar strips (stored in a freezer) into carefully-measured cross strips, doing the same for aged strips (Fig. 1).
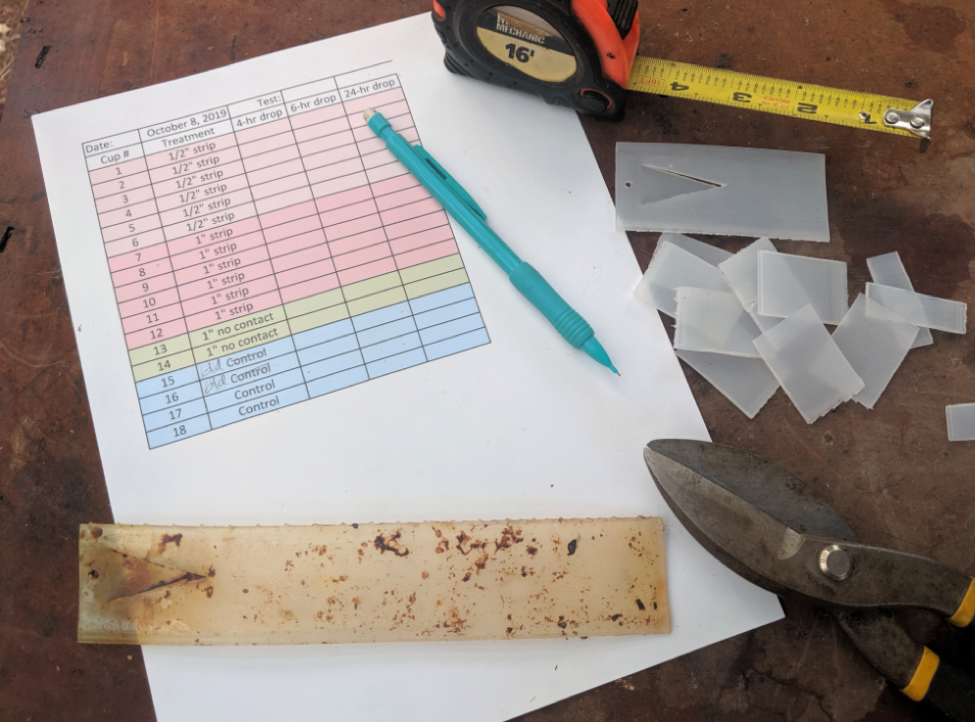
Figure 1. I used shears to cut Apivar strips crossways into ½” or 1” pieces, in order to apply consistent dosages to the bees. The well-aged strip in the foreground is about to be cut up.
I experimented with various locations in the cages to place the strips, observing the behavior of the caged bees, in order to see where they most often rubbed against or walked over the strips. I decided upon hanging the strips from screened lids, since when exposed to light from above, the bees would crowd to the top of the cage, and walk back and forth over and against the strips. The cup cages consisted of a modification of my mite wash cups — an inner cup with a screened bottom (through which mites could drop), inserted into an outer cup with a screened lid. This design would not only allow easy counting of any dropped mites, but would also allow me to easily perform an alcohol wash (in the same cups) to recover any mites remaining on the bees after the 24-hr treatments. I wore fresh nitrile gloves to avoid unintentional contamination of any cup, preparing the Control group cups first (Fig. 2).
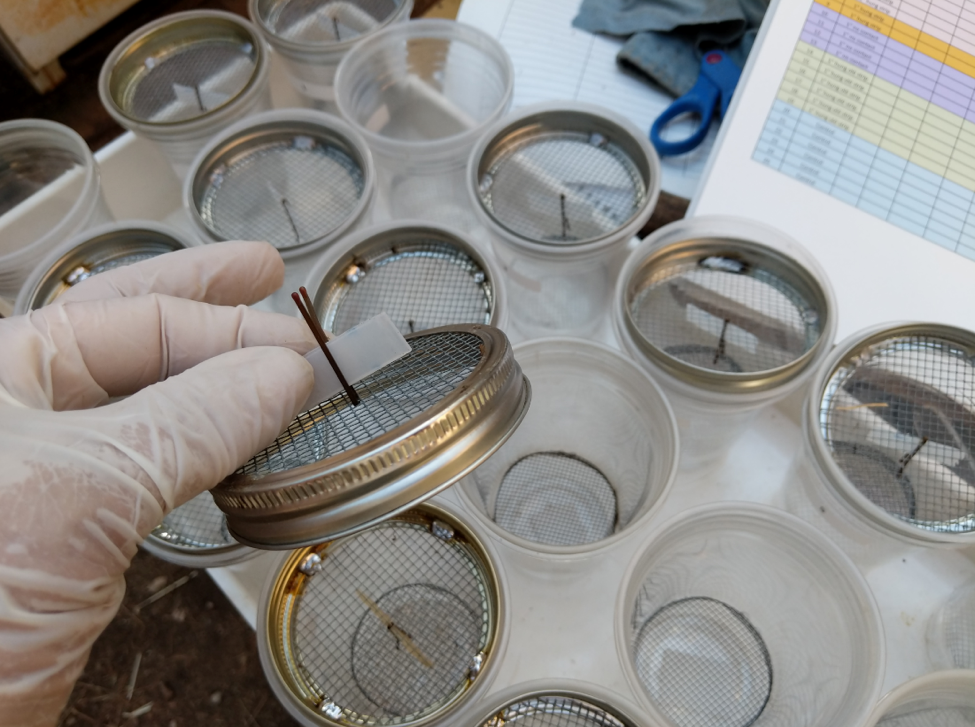
Figure 2. Thanks to a tip from Dr. Jeff Pettis, I used bobby pins to suspend the measured pieces of Apivar® strips at the top of the cages. You can just make out the pieces of Apivar strip lying flat at the bottoms of two cups in the center row, separated by a 1 3/8” air gap below the lower screen – preventing any possible direct contact with the strip by the bees, yet ensuring that any vapors would need to pass up around the caged bees.
The test groups that I ran were:
- Controls (no Apivar strip, to determine a “baseline” value for the percentage of mites expected to drop without treatment)
- A ½” hung strip
- A 1″ hung strip
- A 1″ used/aged hung strip
- A 1″ strip placed below a screen, no contact
I then took the prepared cups out next to high-mite hives, shook bees into a plastic tub, and used a 30 mL cup to scoop up samples of ~100 bees for each cage [[5]] (Fig. 3).
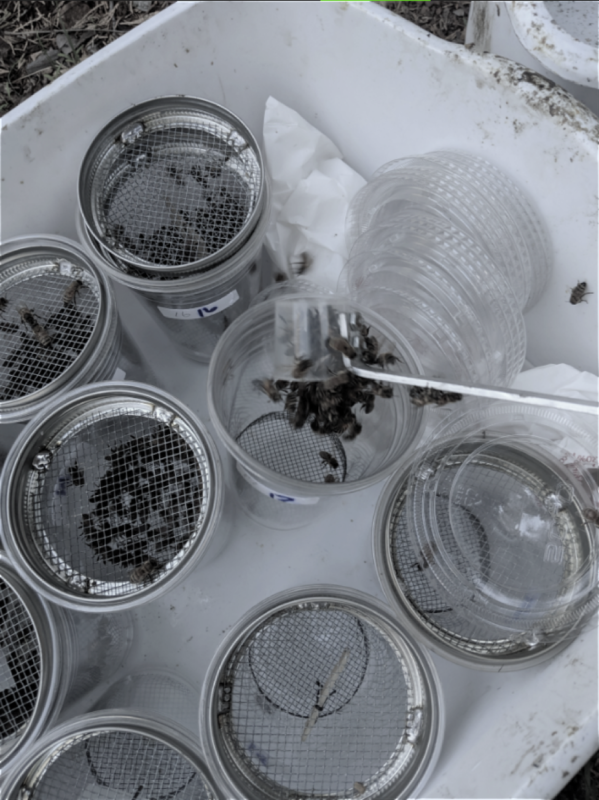
Figure 3. Here I’m dumping 30 mL of shook bees into a cup. The cups, due to their heavy screened lids, were tippy, so I temporarily snapped plastic lids over them for transport to the incubator. I stocked the cups with bees in the morning, so that I could take 4- and 6-hour mite drop counts later in the day.
Once in the incubator, I placed a feeder of 1:1 sugar syrup over each cup [[6]], and turned on an overhead light for several hours to encourage good bee contact with the strips during the day (Fig 4).

Figure 4. Here I’m placing tubes of syrup on the test cups in my home-made incubator, with the light on. At night I turned the light off, so as to minimally interfere with the bees’ accustomed photoperiod. It is critically important not to stress or agitate the bees unnecessarily, since that could add a variable that might cause their mites to drop off.
In all, I ran six replicate tests during October and November, stocking over 100 test cups in total (Fig. 5).
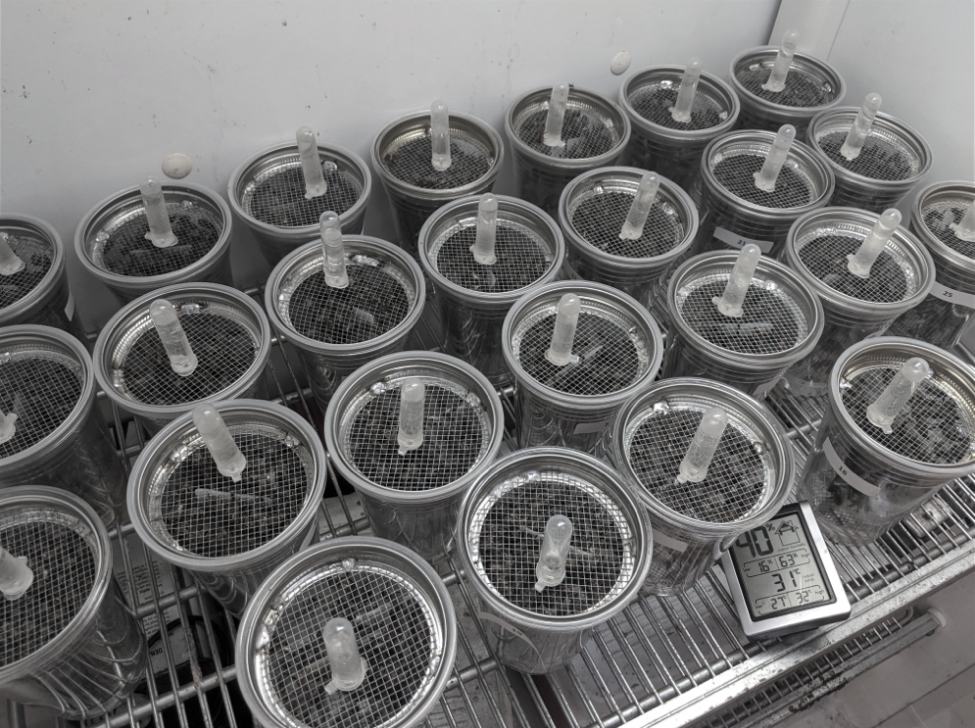
Figure 5. The incubator maintained temperature within a degree of 30 C (86 F), and around 40% relative humidity. There was scant bee mortality.
I hadn’t initially planned to run so many replicates, but with each run, as I observed the effects of the various treatments, and to ensure that I had run enough repeats of each treatment to notice any trends, I adjusted the number of cups in each test group in subsequent runs [[7]]. Of interest, I ran two additional cups with a full Apivar strip wrapped around the inside, just to see what would happen. That high an exposure greatly agitated the bees, and caused them to consume far more syrup than any other test group. By 24 hrs, the full strip killed all the mites, but there was no substantial increase in bee mortality.
On my first run, I enjoyed a visit from Arkansas State Extension Apiculturist Dr. Jon Zawislak, who was speaking to our local club (Fig. 6).
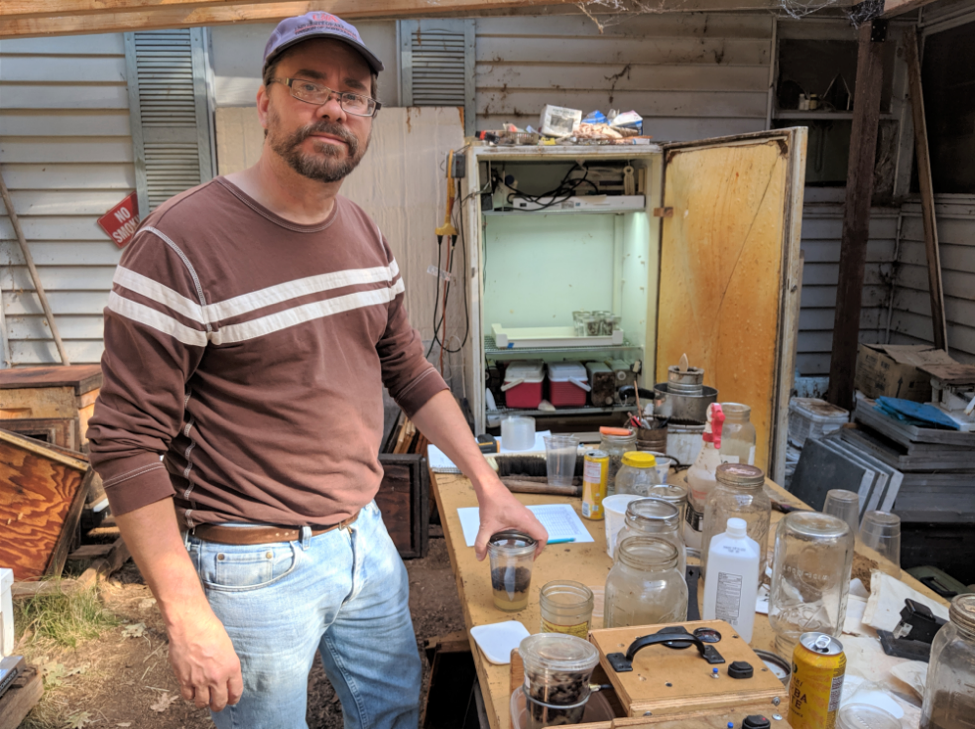
Figure 6. Dr. Zawislak helped me to process the first run. Two mechanical agitators are in the foreground, which provide consistent and complete recovery of any mites still on the bees at the end of each experiment. I greatly enjoy bouncing ideas off other researchers, seeking challenge and constructive criticism.
Below is another view of my state-of-the-art covered outdoor lab, which we normally use for our cell starter colonies in springtime. I didn’t think to clean up before Jon snapped some photos (Fig. 7).
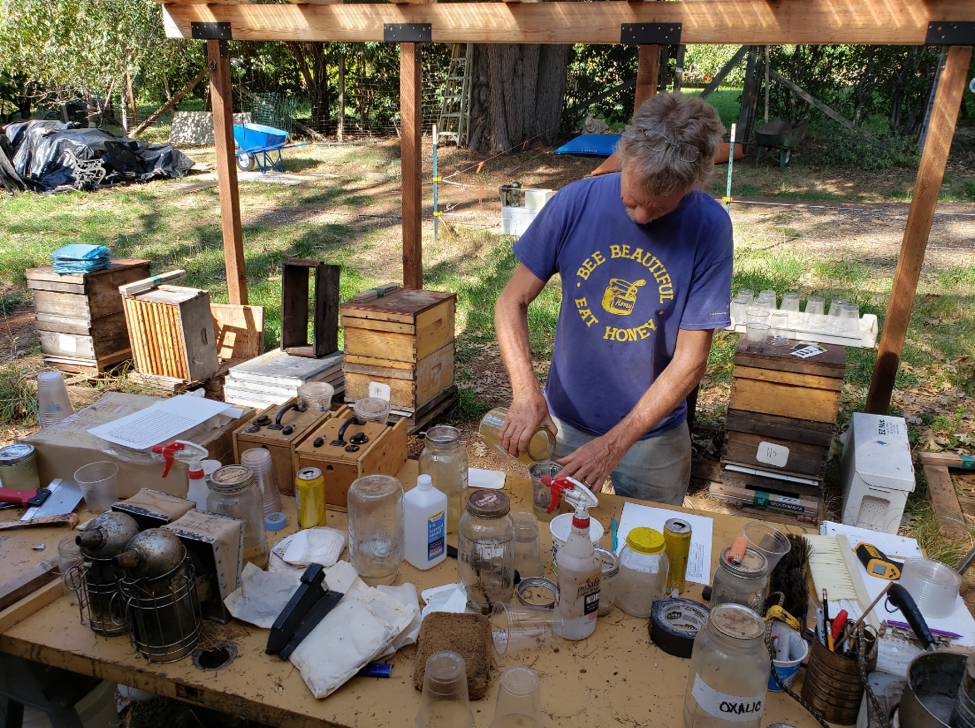
Figure 7. I cleared a spot on the multipurpose “lab bench” to process the samples. Here I’m pouring alcohol into a cup for a final mite recovery. Behind me are mite-free test hives with stickyboards, which I monitor twice a week to determine the rate of mite immigration taking place in this yard (independent of this experiment).
At 4, 6, and 24 hours (depending upon the run), I removed the lower cup and counted any fallen mites (alive or dead), wiped it clean, and replaced it. After counting fallen mites at 24 hours, I then added alcohol to cover the bees, and ran the cup for two agitations on my agitators, which I can count upon to obtain 99%+ recovery of any mites yet remaining on the bees (Fig. 8).
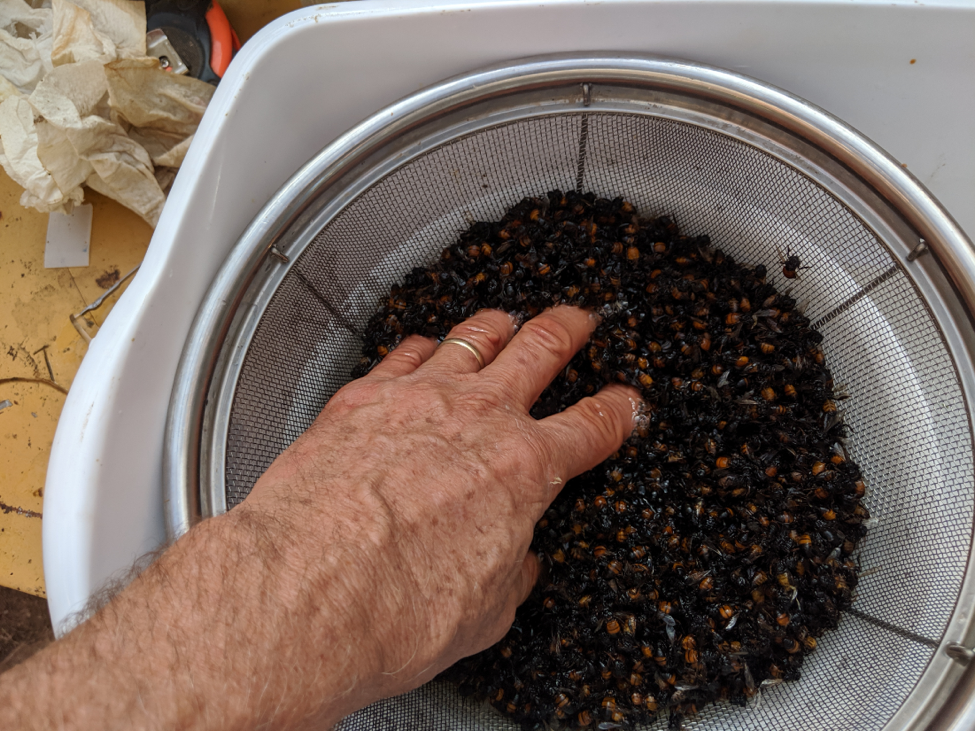
Figure 8. It’s easy to assume complete mite recovery, but I confirm by test. I saved the washed bees in a tub and then rewashed them to make sure that I was actually obtaining 99%+ recovery.
Between runs, if I changed the treatment type in the numbered cup cages, I would discard any cup that had come into direct contact with an Apivar strip. The rest of the cups and screened lids I washed in hot detergent water, and then rinsed in acetone to eliminate any residues of treatment.
The results
This experiment was all about the comparative differences in mite drop between the various treatments, including the untreated Controls. Surprisingly, there was a goodly amount of variation in the percentage of mites that dropped in the controls over 24 hrs.
Practical application: Due to the inherent variability of most any measurement involving honey bees or mites, one needs to run a number of repeats and, preferentially replicates — running the entire test again and again. Of concern is that I find that some of what we think we know about bees and mites is based upon the findings of a single study, not yet replicated by others.
I graphed out the results below, choosing to show means, which I felt represented the data better than median values (since for both the ½” and 1” Apivar treatments, median efficacy at 24 hours was 100%). As usual, I typically graph the results of an experiment in several ways, to try to make them as easy to digest as possible. In this case, I decided that the best way to present the data was to show what percentage of the original mites remained on the bees at each time point (Fig. 9).

Figure 9. Most of the mites stayed on the bees in the untreated Controls (red line). To my surprise, there appeared to be some degree of vapor action from the no-contact piece of Apivar strip (orange line). Exposure of the bees to either a ½“ or 1” strip of Apivar (blue lines) dropped most of the mites within 4 hrs, and nearly all by 24 hrs. Again surprisingly, the “aged” Apivar strip (black line) still performed pretty danged well.
When comparing the effects of the treatments, keep in mind the “background” drop of mites in the Control group. In half of the 26 Control repeats, no mites dropped at all; but in a few as much as 44% dropped, which skewed the mean. Overall, there was a 10-12% (mean or median, respectively) drop of mites in the Control cups at 24 hrs independent of any treatment. By comparison, there was 100% mite drop by 24 hrs in three-quarters of all cups with any type or amount of hung strip.
Practical application: In one of the replicate runs, due to using bees from a colony with a lower infestation rate, I doubled the number of bees in the cup (to ~200). The two highest mite drop rates for Control cups (40 & 44%) occurred in this run. This observation suggests that the number of bees to use in a cup should be further investigated for this sort of testing.
Time certainly appeared to be an important element of exposure for the ½“ or “no contact” treatments, which took longer than 4 hours to exhibit full effect.
Discussion
It looks as though I can now answer my two questions:
Q1: Does amitraz only work by direct contact? The results certainly suggest that despite amitraz’s “negligent” vapor pressure, that even having a full 1 3/8” separation between a 1” strip (laid on its side, so no evaporation from that side) did not prevent the strip from dropping over 40% of the mites, after subtracting for “natural” mortality. So yes to vapor action even at below broodnest temperature.
FWIW, back in the day, vaporization of amitraz by various heating methods was commonly employed. This is extremely dangerous for the operator, and I’ve met a beekeeper who nearly lost his life from doing it. However, it is of great interest that mites could be affected by vapors being emitted from an Apivar strip. This subject certainly calls for more research.
Q2: Does amitraz degrade rapidly? Despite the warnings to use the strips quickly after opening, these limited experimental results suggest that the active ingredient continues to emanate from the plastic strips for quite some time.
Acknowledgements
Thanks to Drs. Jeff Pettis and Jon Zawislak for their assistance.
References
[1] https://www.dadant.com/wp-content/uploads/2012/04/2011/09/FAQs_Apivar_US_2012.pdf
[2] Williams, G, et al (2013) Standard methods for maintaining adult Apis mellifera in cages under in-vitro laboratory conditions. Journal of Apicultural Research 52(1): 1-36.
[3] It’s difficult to obtain meaningful data on the effect of anything upon varroa riding on bees unless mite counts are high – at low mite infestation rates, it’s just difficult to separate any “signal” from the “noise” of random variablility.
[4] As opposed to the error of “pseudoreplication” – counting each test cup in the same run as a replicate.
[5] In one replicate, due to a lower mite load, I used 2 scoops per cup.
[6] Which I found to be necessary for any test over 4 hours.
[7] Ideally, I would have run exactly the same number of test groups and repeats in each replicate, but this started out to be a “quick and dirty” experiment that grew with interest each replicate.


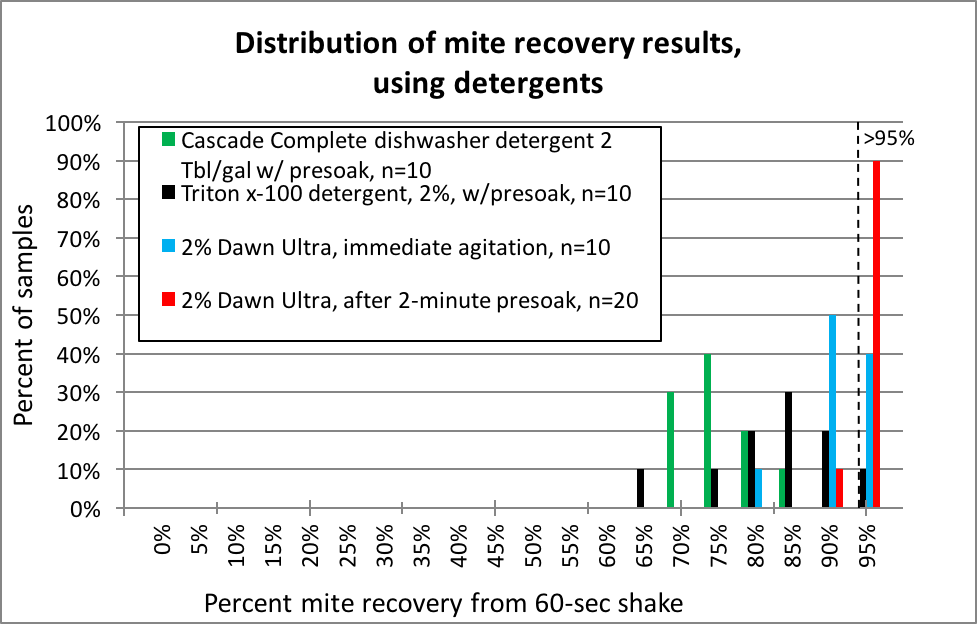
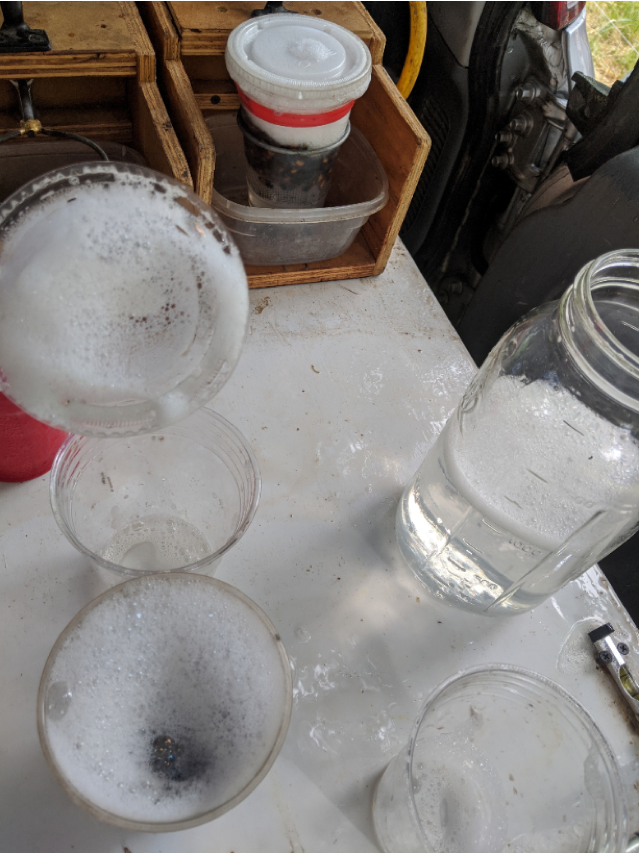
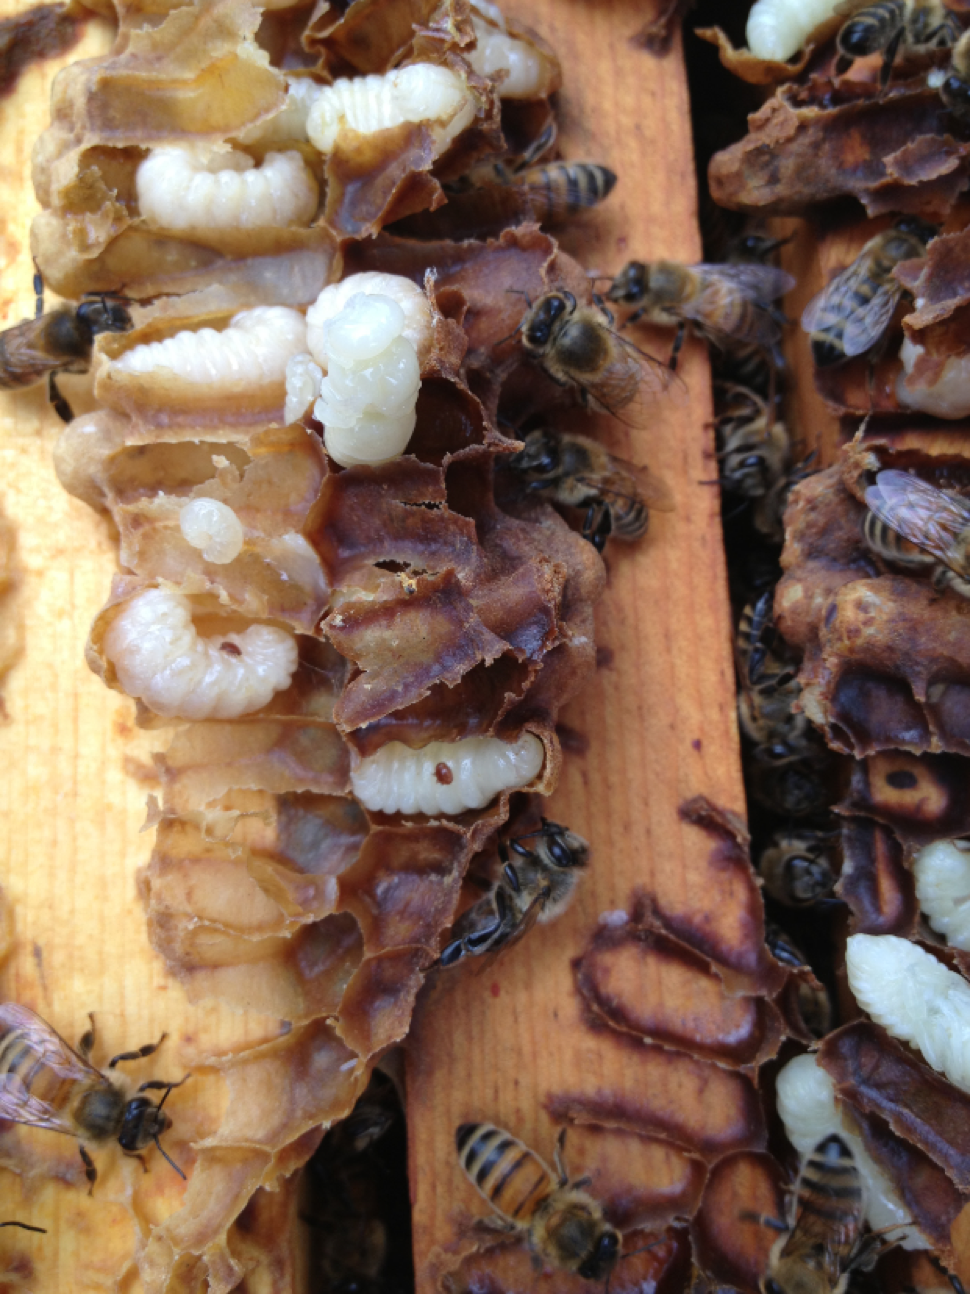
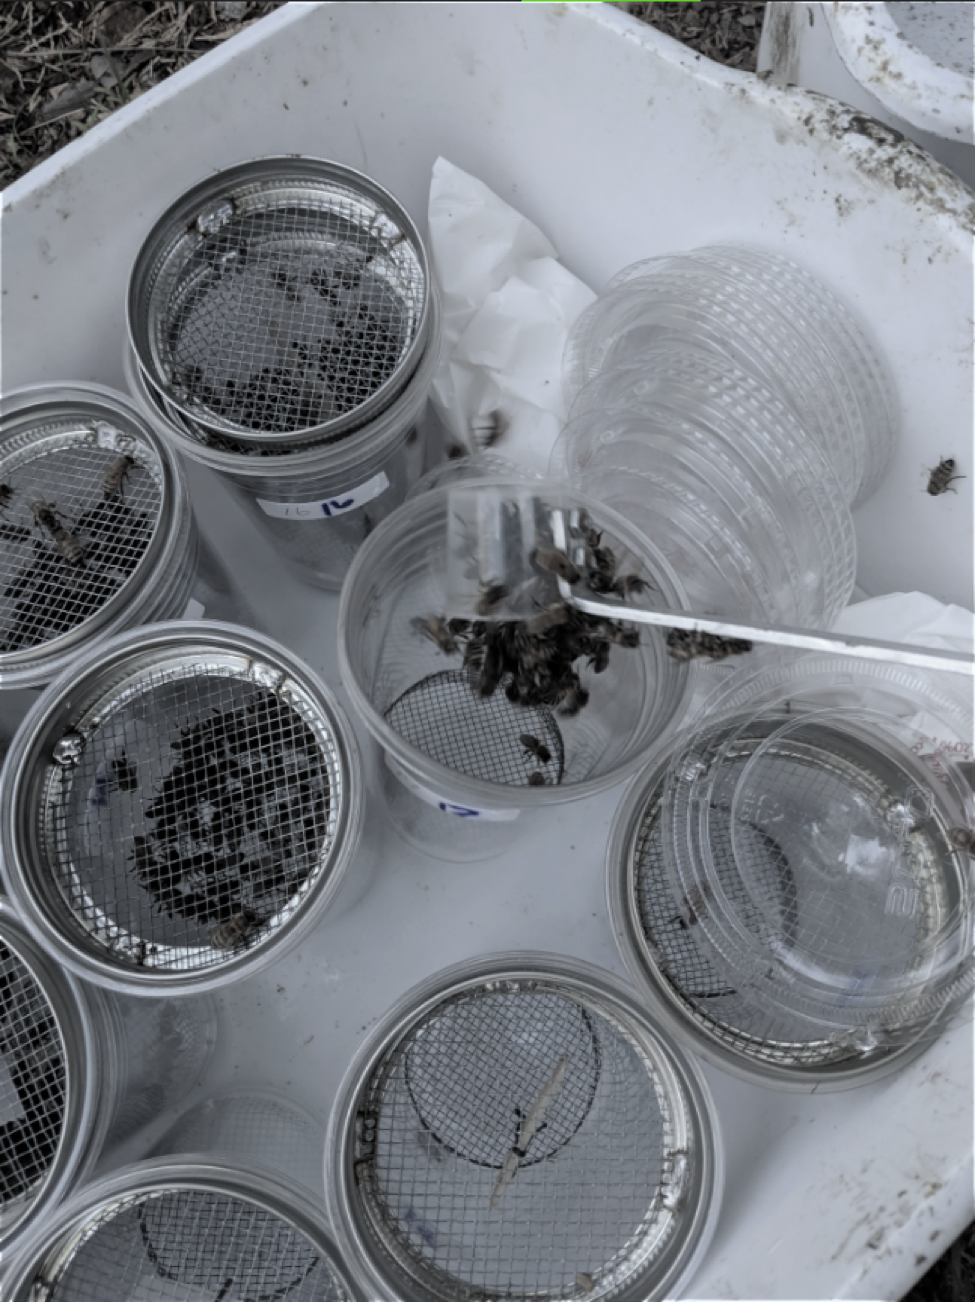
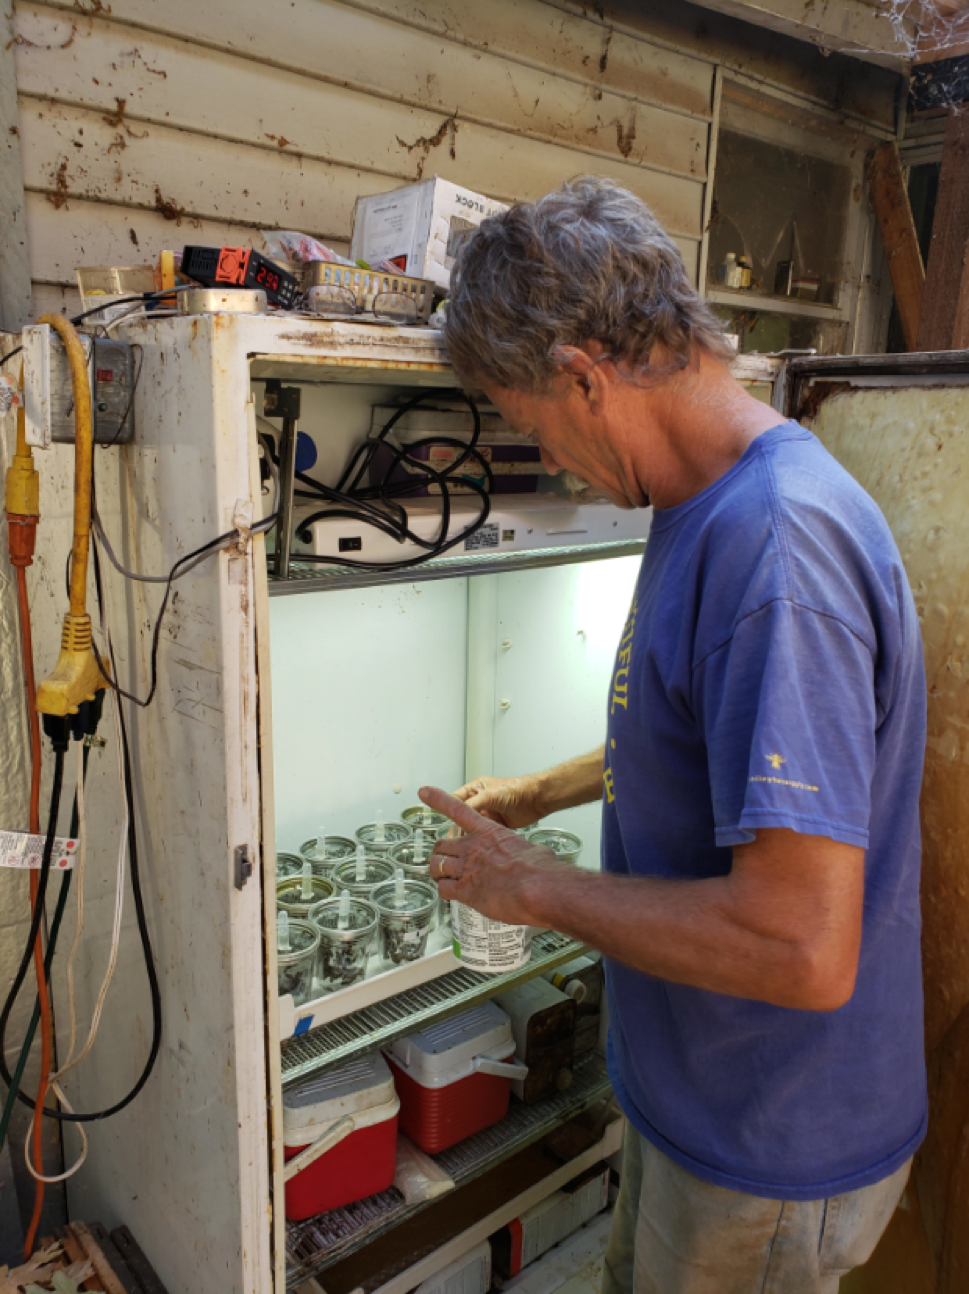