


IPM 3 Fighting Varroa : Strategy – Understanding Varroa Population Dynamics
IPM 3 Fighting Varroa :
Strategy –
Understanding Varroa Population Dynamics
© Randy Oliver 2006
ScientificBeekeeping.com
First Published in ABJ in February 2007
What are the Population Dynamics of Varroa in a Honeybee Colony?
Seasonal Factors
Computer Models
What Can We Do to Keep the Mite Population Under Control?
Tactics Used by Mite-Tolerant Bees
Acknowledgements
Resources For Information
Joe Beekeeper typically has a gnawing feeling in his gut that the ways he’s been dealing with the varroa mite are starting to fail. I heard a complaint at a recent convention: “How long can we continue in a business where 30% of our assets die each year?” Many commercial beekeepers are using a combination of the latest ag chemical on a stick, and prayer that it will work once again. They’ve got no fallback position, and it’s scary. They are correct in their assessment that the “silver bullet” model of mite control is going the way of the Polaroid camera—it worked great for a while, but no longer does the job we demand.
In my two previous articles in this series, I’ve introduced a view of the future: integrated pest management (IPM), and the fact that we can breed bees that have the innate ability to fight varroa. I feel it’s only fair to tell you that varroa IPM is a work in progress. I can’t offer each and every one of you a turnkey, failsafe method of keeping varroa under control. There are far too many variables, such as length of season in your area, climate, humidity, strain of bees, colony stress, your management practices, the size of your operation, and your time and money constraints. This is a learning process for me, for bee scientists, and for beekeepers in general. What I can give you is information—the theory and science behind the methods, and strategies and techniques that have been proven to work by others. It’s going to be up to you to put the pieces together for yourself (although I’ll help you to do that later in this series).
I may sometimes sound as though I’m proselytizing. So let me be clear. I have only two agendas: (1) to help beekeepers be successful and profitable through the application of current scientific research, and (2) to keep honey’s wholesome name untarnished by not contaminating it with chemicals. We all saw what happened to this year’s fresh spinach crop when the news media announced that one little farm’s harvest was contaminated—the rest of the unfortunate spinach farmers couldn’t give their crop away! The same thing will happen with honey unless we clean up our chemical act.
Initially, I planned to write this article on the topic of monitoring mite levels (with sticky boards, etc.). In the process of attempting to draw a graph (Figure 2) to illustrate how the mite population fluctuates over the course of a year, I searched for good data so that I could plot the curve accurately. That search led me to research on mite population dynamics. I came to realize that the key to developing an effectual strategy for mite control is to have a firm grasp of mite population dynamics. Only then can you intelligently weigh the likely efficacy of various mite control strategies and methods. This is hardly an academic issue. In my own beekeeping business I have limited time and money to invest in mite control, so I want to get the most bang for my buck. By understanding mite dynamics, I can do so.
What Are The Population Dynamics of Varroa in a Honeybee Colony?
Let’s start by seeing just why it is typical for varroa to become a problem in the fall. Please refer to Figure 1.
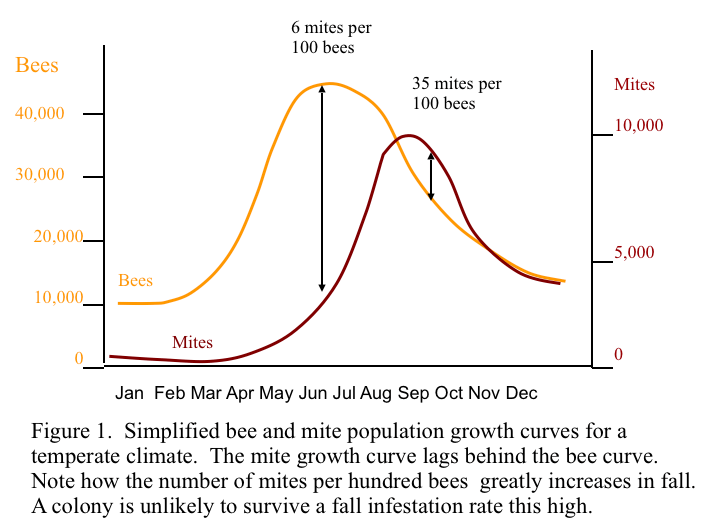
Both the mite and bee population are at their lowest just before the first brood emerges in spring. The bee population climbs at a quicker rate than the mite population until midsummer, when the bees start to ramp down. The mites get off to a slower start, and then hit their stride during drone rearing season in spring and summer. Note how the mite to bee infestation ratio climbs dramatically in early September. When that occurs, the bees really feel the impact of varroa—brood is stressed or dies, viruses run rampant, and the generation of bees that will form the winter cluster is weakened and vulnerable. For a review of the insults that varroa parasitism visits upon a honeybee colony, see the excellent New Zealand guide cited at the end of this article.
A key point to remember is that the relative infestation (percent, or mites per 100 bees) is more important than total mite population—a large colony can handle more mites than a small one. At much above a 2% infestation in spring, honey production drops off severely. At much above 5% in fall, colony winter survival suffers (although the fall “economic injury threshold” numbers by various authors range from 1% to 11%) (Currie & Gatien 2006). We will return to percent infestation, and economic injury levels in my next article.
Unchecked, varroa can really multiply! A 12-fold increase is typical in a short season consisting of 128 days of brood rearing (Martin 1998). However, its population can increase 100- to 300-fold if broodrearing is continuous! (Martin and Kemp 1997).
There are also major confounding factors. Some years, mite populations are low across the board (possibly due to hot, dry weather) and no treatment is required (Harris, et al 2003; and personal observations). In any apiary, there is usually huge colony-to-colony variation in mite levels, especially if one is using a variety of queen lines. If there is a reservoir of collapsing colonies nearby, mite invasion can make your best mite-fighting efforts moot. Finally, tracheal mites, nosema, viruses, and chemically contaminated combs can cause even relatively low mite levels to be fatal to the colony.
It is easy to find all this information overwhelming! Unfortunately, as our “Silver Bullet” chemicals fail to control mites with a yearly “no-brainer” treatment, beekeepers will be forced to exercise their brains in order to stay in business! This article is by far the most difficult one in the series for me to attempt to condense the state of scientific knowledge into practical recommendations for Joe Beekeeper. So let me start with models of varroa population dynamics
Seasonal Factors
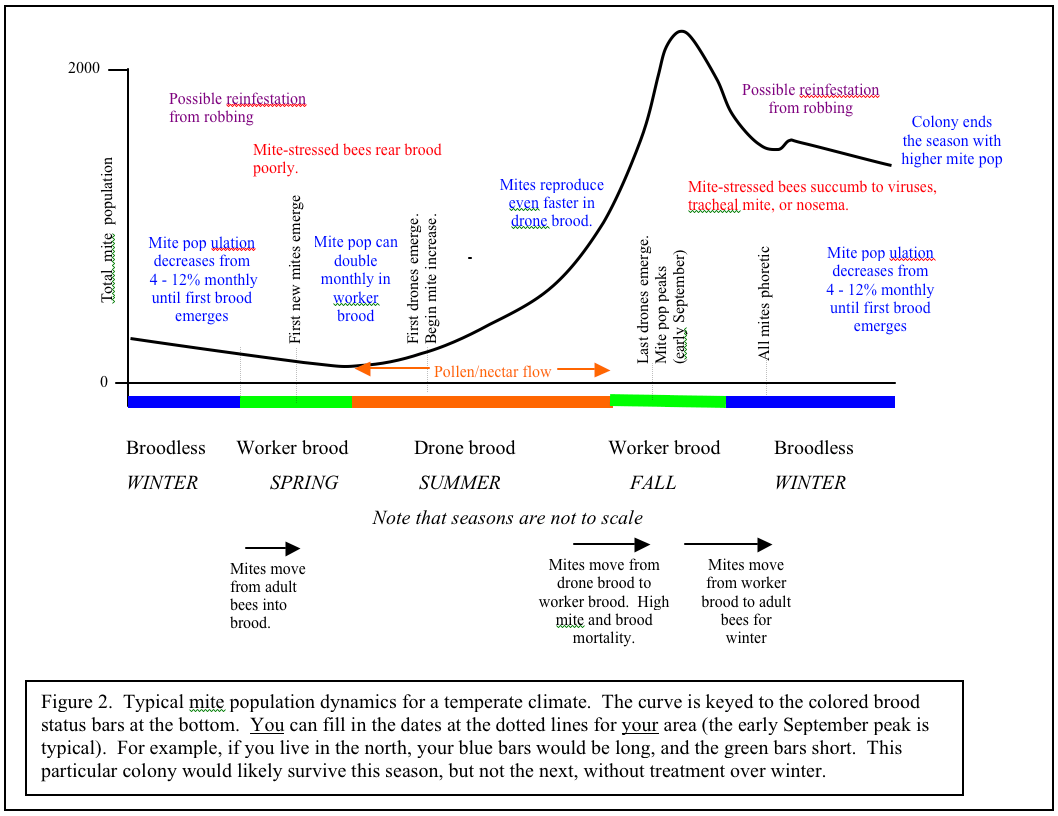
I’ve sweated blood to try to summarize what we know about seasonal growth of varroa into a simple graph (Figure 2). Varroa population growth is largely dependent upon drone brood being present. Therefore, I’ve tried to make the graph universal for temperate climates by keying the growth curve to the colored brood status bars at the bottom. The only consistent date in temperate areas is that the curve usually peaks the first week of September. You can make the graph even more universal by ignoring the word “summer” and substituting “pollen/nectar flow.” Note that the mite population increases (other than from immigration from robbing) mainly during the pollen/nectar flow when bees are rearing drones; most of the rest of the year, the population is decreasing. The more intense the buildup period, the steeper the mite growth curve.
If you live in California, where we have early bloom, and a very dry summer, the curve shifts to the left. If you live in where it is chilly in spring, and have fall flows, the curve will shift to the right. If you live in a very warm area where broodrearing drops off in the summer heat, and picks up with late summer rains, your growth curve may shift far right and look more like Figure 3. “Luckily” for those of you in subtropical areas, if you don’t already have African bees, you likely will, and they control varroa by themselves, largely by grooming (Arechavaleta-Velasco & Guzman-Novoa 2001).
As a point of interest regarding length of broodrearing period, colonies in northern latitudes may experience the same degree of mite increase as colonies at lower latitudes having a much longer period of broodrearing! Korpela (in Fries 1991) states “the growth rate of varroa populations observed in south-eastern Finland is comparable to, or even exceeds, the values observed in Germany, despite the clearly shorter brood rearing period and the higher mite winter mortality suggested by this study.” This is an area that could use further study.

Computer Models
Speaking of further study, the way to find out if we truly understand mite population dynamics is to try to model them in a computer program. If our knowledge is correct, we will be able to predict what we actually observe in the “field.” If not, then back to the drawing board for fine tuning, or to the field to collect more data. Without a good model, our attempts at mite control are largely shooting in the dark! With a good model, we can aim accurately, and save our ammo. That is, by analyzing the models, one gets a much better grasp of which mite control strategies are likely to be effective.
The models take into account factors such as broodrearing season, proportion of drone brood, seasonal mite mortality, and reproductive rates of the mite, to name a few. I’ve cited the major modeling references at the end of this article, and the numbers I use in the following discussion come from these references. Note that the models may not apply well to your conditions! They are based upon many thousands of hours of tedious research and analysis by dedicated researchers, yet are still rather primitive. For instance, Stephen Martin’s excellent model only assumes drone brood rearing from May through August—which is very different from my California conditions! It also appears to underestimate the percent of drone brood that I see, and only has worker brood from April thru September. As the granddaddy of varroa modelers, Ingemar Fries of Sweden states: “No mathematical model will produce good results without reliable input data.”
You can play with modeling by downloading Gloria DeGrandi-Hoffman’s VarroaPop (Figure 3; see Resources). It’s not perfect yet, and I’ve spoken with Dr DeGrandi-Hoffman to clarify the parameters she used, but haven’t gotten the answers by deadline for this article.
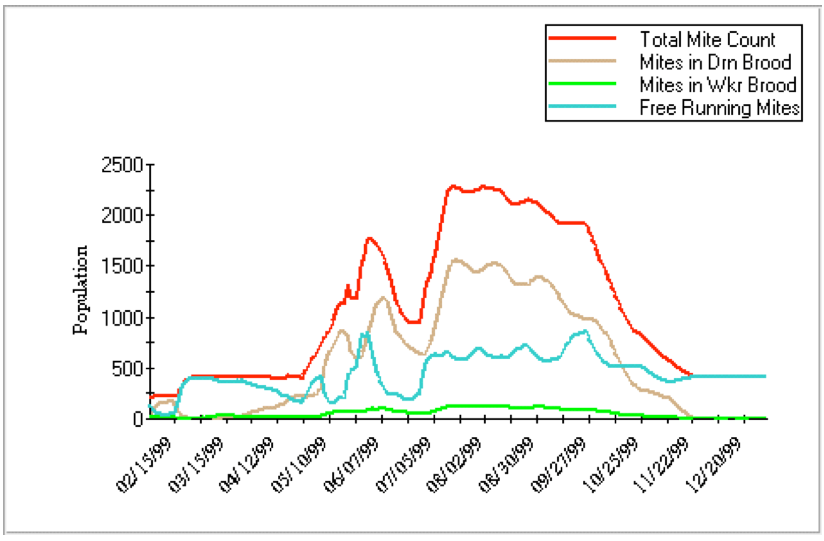
Figure 4. An illustration of a Varroa Pop run. You can choose the parameters to plot. For this graph, I plotted only the mite population, not any of the bee population options. In this run, some of the variables I set were: Midwest weather, 1.1 mite offspring per worker cell, 3 per drone cell, 0.1% infestation in worker cells, 1% in drone, and moderate queen strength. Note that this model predicts that most of the mites would be in drone brood.
Although what catches our attention is mite damage to developing worker brood in fall, mite levels increase most rapidly when drone brood is being reared. Modeling shows us that mite reproductive increase, in a hygienic colony, is largely dependent upon four factors: (1) baseline reproduction in worker brood, (2) the availability of drone brood, (3) successful multiple cell invasions by each female, and (4) the restraint from daily mortality.
REPRODUCTION IN WORKER BROOD
The average number of offspring produced per foundress (reproductive female) mite in worker brood is only a little over 1 viable female per reproductive cycle (about 17 days). Of these viable females, about 1/3 fall to the floor shortly after emergence (about 50% of them are dead, and the rest generally die within a day). Add to that other mite mortality factors, and the best that mites can do is to increase at a rate of about 2.4% per day on worker brood (doubling about once month). Point to note: if you have hygienic (VSH) bees that remove infested worker brood, this rate can be greatly reduced. Worker brood alone in a relatively hygienic colony is unlikely to generate dangerous mite levels. Serious mite increase requires the presence of drone brood to “prime the pump” to get any substantial mite production going in the worker brood (Martin & Medina 2004).
THE AMOUNT OF DRONE BROOD
Mites have much greater reproductive success in drone brood—producing nearly 3 viable daughters per cycle. However, as you may have noticed if you’ve sampled drone brood with a cappings fork, there are often multiple mites in a single cell. Luckily for the bees, multiple infestation hurts the mites–when three foundress mites enter a drone cell at one time, their reproductive success is reduced by a third. So the varroa buildup in drone brood eventually slackens due to overcrowding of individual cells. Point to note: it is a core strategy of varroa management to minimize the number of drone cells in a colony, or better yet, to remove them on a regular basis during the spring, along with the mites within. This is especially true since for some reason hygienic colonies only remove infested worker brood, not infested drone brood.
This concept makes us rethink the effectiveness of attempting to kill the last few mites with a winter treatment. It’s counterintuitive, but our efforts toward going into spring with the lowest possible mite load may be misdirected—our energy may be better spent in managing drone brood. It would make sense that for every mite killed before spring there would be at least 12 fewer mites come fall, due to their exponential growth (Figure 5). However, this assumption does not take into account the restraining effect of multiple infestation in drone cells, as mentioned previously. By reducing the initial mite infestation, there is less mite-to-mite competition for pupal hosts, and the surviving mites are able to reproduce even faster and catch up! (Bieñkowska & Konopacka 2001). And this doesn’t even account for spring reinfestation from other colonies (Figure 6). So what I’m thinking, is that although the winter oxalic dribble is a good stopgap measure, in the long term we really need to look at ways to inhibit varroa reproductive success during the broodrearing period.
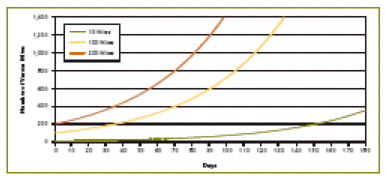
Figure 5. A simplified illustration of the buildup of mite populations over 180 days, starting with either 10, 100, or 200 mites. All curves are based upon a doubling of their population every four weeks. Note that all the curves are identical—just shifted time wise to the right at lower starting levels. Note that the mite population never reaches a danger level if initial mite level is very low. In reality, however, mites increase more quickly at low density, and slow down at greater mite density. Crown copyright 2005. From Managing Varroa.
THE NUMBER OF REPRODUCTIVE CYCLES PER MITE
In testing an early model’s predictions against reality in the field, Martin found that it underestimated the rate of reproduction in worker cells (Martin and Kemp 1997). I’m afraid that VarroaPop may also do so. If you play with VarroaPop, you’ll find that mite populations only increase if there is drone brood present, plus fairly high female mite “survivorship” (and therefore, multiple reproductive cycles by each female). This is a conclusion that Martin and Fries have come to—that the a female mite needs to average 2-3 reproductive cycles for varroa populations to grow at the pace that we see in the field. This is an aha! discovery. It means that a major weakness of the mite is the need for females to survive to reproduce between 2 and 3 times in order for the mite population to increase. Point to note: if we breed for bees with high grooming behavior, we’ll decrease the number of times that mites can survive to breed again. This factor largely accounts for the innate mite resistance of the Africanized bee.
DAILY MITE MORTALITY
On the subject of Africanized bees, they really do groom mites off their bodies well! They kick mites out of their colonies at nearly twice the rate that European bees do (Aumeier 2001). Point to note: aggressive grooming by the bees disrupts the mites’ behavior, and will likely increase the baseline daily mite mortality, especially if the hive has a screened bottom. Dislodged mites are normally able to quickly return from the floor by hitching a ride on a passing bee. If a mite falls through a screened bottom, it’s out of luck, and winds up becoming ant food. If you could increase daily mite mortality by just one percent by selecting for grooming behavior, you’d cut the mite buildup rate in half!
VIRUSES
So far, I’ve spoken mostly of mites and mite population. But it isn’t usually the mites that kill a colony—it’s viruses. If you really want to understand the virus problem, read Sumpter & Martin’s (2004) paper on the dynamics of virus epidemics in honeybee colonies. You can skip the math—read the introduction and discussion. In short, there are at least 14 viruses endemic to honeybees. Before varroa, they were largely present at very low levels and “inapparent” (not causing symptoms). An occasional bee would show an “overt” infection, but die without necessarily spreading the disease. When varroa came on the scene, however, the mite suddenly became a new vector of the viruses, and at high enough mite levels, viruses become epidemic and cause colony collapse. Eventually, it’s likely that the bee, mite, and viruses will come to evolutionary terms, but that’s not the case yet.
The authors determined that since viruses are always present, the critical factor in predicting colony collapse was the mite population necessary to vector (spread) the virus to epidemic levels. Let me simplify the author’s mathematical predictions of those critical mite levels in Table 1. Note that the model’s predictions generally agree with the field-tested recommendations to keep mite populations below the 2000 to 3500 range.

MITE INVASION
Mite population models must account for invasion or “immigration.” Immigration is any inflow of mites from outside the colony—essentially by robbing of, and “drift” from, nearby collapsing feral or “managed” colonies. This factor is a “wild card,” and cannot be predicted by population dynamics, but it can reset the growth curve to a higher level when it occurs (Figure 6). Mite immigration is the tiger lurking in the bushes, and can overwhelm a colony in days! (I’m typing these words fresh from a beeyard of mine where this occurred—the lesson was painful).
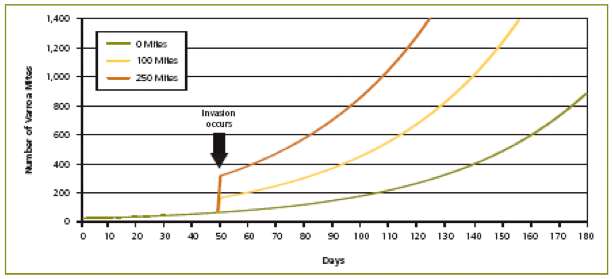
Figure 6. Illustration of the effect of mite invasion (which mostly occurs through robbing of collapsing colonies). When a small number of mites are present at the start of the season and no mite invasion occurs, the mite population remains low. However, mite invasion early in the season causes the mite population to reach harmful levels much more quickly. Crown copyright 2005. From Managing Varroa.
What Can We Do to Keep the Mite Population Under Control?
The first thing to keep in mind is that any mite control methods we use today are merely stopgap measures until the bees are genetically able to take over the battle for themselves (kind of like our “strategy” in Iraq). My feeling is that we need to rethink our paradigm, and switch from the strategy of blasting the mites with a chemical bomb after they’ve built up to dangerous levels, to a strategy of controlling mite buildup from the get go.
Those of you who keep asking for some new miracle control for the mite are ignoring the reality that we have at least two kinds of bees who are already demonstrating exactly how to do it! Apis cerana and the Africanized bees keep varroa in check unaided by us egotistical humans who think we need to solve everything ourselves! My guess is, that if we had focused our resources toward the development of resistant bees, rather than on chemical control, we wouldn’t be needing this discussion on mite control today.
The bees have already provided us a model of what works. Maybe we should attempt to emulate it. In essence, these bees use a brass knuckles approach every day to make life miserable for the mite. Our modeling of mite population dynamics confirms for us just why their strategies are successful. To wit:
Tactics Used By Mite-Tolerant Bees
- Resistant bees are hell on phoretic mites, always grooming them off their bodies, harassing them, and increasing daily mite mortality. This action helps rid the colony of overwintering mites, and slows mite buildup in spring by keeping individual mites from breeding multiple times. We should seek out and breed from bees that exhibit strong grooming behavior (I think this should be a top priority). We can assist the bees with natural* chemical treatments during spring buildup, by using screened bottoms, and with an oxalic acid dribble in the fall.
- Resistant bees rip out worker pupae if mites try to reproduce on them. This keeps baseline mite buildup in worker brood to a minimum. We can select for strong varroa sensitive hygiene.
- Mite-infested drones of Apis cerana essentially sacrifice themselves by dying under the tough cell cap. Whole colonies abscond and leave mites behind. We should seek out and breed from bees whose infested drones die within the cocoon. We can help by minimizing the amount of drone comb, and by practicing drone brood removal during spring and summer.
- Resistant bees never let mites build up to high enough levels to cause virus epidemics. We can monitor mite levels, and use natural chemical treatments if necessary in August to bring down mite levels.
- Resistant bees produce fewer collapsing colonies to rob, and due to heavy grooming, are less likely to carry mites home. Ideally, we would isolate our apiaries. Realistically, we can minimize swarming by mite-susceptible colonies that will eventually collapse, we can prevent our own colonies from collapsing and spreading their mites, and we can monitor our colonies spring and fall to watch for sudden jumps in mite levels.
- Resistant bees abscond frequently, and leave behind disease spores in the old combs. We can breed from bees that exhibit immunity to viruses. We can rotate out old combs that may be contaminated with chemicals, or harbor spores. We can also help suppress tracheal mite, nosema, and other diseases with good husbandry or medication.
* “Natural” chemicals such as oxalic or formic acid, thymol or essential oils, powdered sugar; as opposed to synthetics such as fluvalinate or coumaphos that leave harmful residues in the wax combs. I’m not touting “organic” beekeeping, just common sense methods based on good scientific research.
There you have it—a summary of the strategy and tactics that are successfully used by mite tolerant bees. These bees rarely allow varroa infestation to exceed the 2% level at any time of the year. We don’t have to reinvent the wheel! Mite tolerant bees are out there right now—let’s identify them and breed from them. In the interim, let’s follow their example, and help the rest of our colonies to survive and thrive!
A brass knuckles fighter doesn’t just bide his time, waiting for his one good shot with the “silver bullet”—instead, he sizes up his opponent and just keeps pounding away, never letting the opponent get the upper hand. The way we “pound” varroa is by an incremental approach. For example, if you plant a bed of lettuce in spring you know that you’re going to have to weed it to keep the weeds from shading the crop and stealing all the nutrients. The incremental approach would be to do a little hand weeding every week, and keep knocking the weeds back. The silver bullet approach would be to wait until the weeds grew tall, and then use your 50 horsepower garden tractor to mow ‘em down just before they smothered the lettuce. You’d save time, and still get a crop, but the lettuce would be small, stressed, and diseased. Varroa affects your bees the same way that weeds hurt your lettuce.
So let’s compare two strategies: brass knuckles vs. silver bullet. If you were to use the “brass knuckles” strategy—recruiting mite-fightin’ bees that can kill an extra 1% of the mite population each day (an additional 7% kill a week, or 35% a month), you’d retard the mite growth rate to less than 1½% a month. At that rate, 200 overwintered mites wouldn’t even reach a population of 2500 by the end of a full 6-month season of broodrearing! If you go a step further, and help the bees with biotechnical methods, or spring treatments, you’ll keep the upper hand on the mites. An incremental approach of hitting the mite with little jabs all through spring will win the fight. Mites only get out of hand because we ignore ‘em until they are in our face!
Compare this to the silver bullet strategy we’ve been using, letting them build up to 10 or 20 times their initial population over the course of a season, then gamble that your one good shot with the silver bullet in the fall will kill the 90-95% necessary for the colony to survive! Both approaches knock the mites back to the starting point, but the silver bullet approach results in a stressed colony being hammered by the mites for much of the season, which greatly decreases your honey crop, allows viruses to rampage, and greatly increases your stress level.
The only way we can tell if the bees (with our help) are successfully keeping the mite in check is by monitoring mite levels at appropriate times. In the next installment of this series, I’ll compare the various methods for monitoring mite levels, and make suggestions as to timing. By the way, I’m going to help you put all these pieces together in (probably) the May issue, so you can make a personalized yearly plan for varroa control. I also should have a website up by next month, so you can see updates to these articles.
Acknowledgments
I want to be clear that I could not be writing this series of articles without the gracious help of many other beekeepers and researchers. Indeed, this series is a learning experience for me day by day, as I find new resources of information, printed or verbal. I’d especially like to thank Eric Mussen, Marion Ellis, Rob Currie, Marla Spivak, Gloria DeGrandi-Hoffman, Sue Cobey, Tom and Suki Glenn, Dewey Caron, Bob Harrison, Dave Cushman, Bill Truesdell, and Jerry Hayes. Newbie George Fergusson has been invaluable in helping me distill the information. I greatly appreciate the support and indulgence of editor Joe Graham, who lets me make last-minute revisions right up ‘til press time. For those of you that I forgot to mention, my apologies.
Resources for Information
ATTENTION RESEARCHERS: it would sure help us beekeepers if you would all have pdf links on your homepages to all your publications! Thank you to those of you who already do.
A great U.K. manual—”Managing Varroa” www.csl.gov.uk/science/organ/environ/bee/diseases/documents/managing_varroa_new.pdf
A great New Zealand manual—”Control of Varroa” http://www.biosecurity.govt.nz/files/pests-diseases/animals/varroa/control-of-varroa-guide.pdf
Population Modeling
The best summary of all the parameters: Martin, S. J. (1998) A population model of the ectoparasitic mite Varroa jacobsoni in honey bee (Apis mellifera) colonies. Ecological Modeling, 109: 267-281.
Martin, S. J. & Kemp (1997) Average number of reproductive cycles performed by the parasitic mite Varroa jacobsoni in Apis mellifera colonies. Journal of Apicultural Research, 36: 113-123.
Fries, I (200?) Dynamics of the parasitic (Varroa jacobsoni) population: Modeling criteria http://ressources.ciheam.org/om/pdf/c21/97605905.pdf
Fries, Camazine, Sneyd 1994 Population dynamics of Varroa jacobsoni: a model and review. Bee World 75: 5-28
DeGrandi-Hoffman, Gloria. & Robert Curry 2005 Simulated population dynamics of Varroa mites in honey bee colonies: Part II – What the VARROAPOP model reveals. Amer. Bee J. 145(8): 629-632.
Boot, Baalen, Sabelis 1995 Why do Varroa mites invade worker brood cells of the honey bee despite lower reproductive success? Behav Ecol Sociobiol 36:283-289.
D. Wilkinson and G. C. Smith 2002 A model of the mite parasite, Varroa destructor, on honeybees (Apis mellifera) to investigate parameters important to mite population growth. Ecological Modeling 148(3): 263-275.
VarroaPop download: http://gears.tucson.ars.ag.gov/soft/vpop/vpop.html
Literature Cited
Arechavaleta-Velasco, Guzman-Novoa. 2001. Relative effect of four characteristics that restrain the population growth of the mite Varroa destructor in honey bee) Apis mellifera) colonies. Apidologie 32: 157-174.
Aumeier, Pia. 2001 Bioassay for grooming effectiveness towards Varroa destructor mites in Africanized and Carniolan honey bees. Apidologie 32: 81-89.
Bieñkowska, Malgorzata & Zofia Konopacka 2001 Assessment of honeybee colonies infestation by the mite Varroa destruktor based on its natural mortality during the summer season. Journal of Apicultural Science 29(45)
Bieñkowska, Malgorzata & Zofia Konopacka 2001 Daily summer fall of Varroa destructor calculated from short (1,2,3, and 4-week) sampling periods to be used as an indicator of autumn mite infestation of honeybee colonies. Journal of Apicultural Science 143(45)
Currie & Gatien 2006 Timing acaricide treatments to prevent Varroa destructor from causing economic damage to honey bee colonies. Can. Entomol.138: 238-252.
Fries, Ingemar , Aasne Aarhus, Henrik Hansen and Seppo Korpela. 1991 Development of early infestations by the miteVarroa jacobsoni in honey-bee (Apis mellifera) colonies in cold climates. Exp. and App. Acarology 11(2-3): 205-214.
Harris, J.W., Harbo, J.R., Villa, J.D., Danka, R.G. 2003. Variable population growth of varroa destructor (mesostigmata: varroidae) in colonies of honey bees (hymenoptera: apidae) during a 10-year period. Environmental Entomology/Population Ecology 32(6):1305-1312.
Martin, S. J. & Medina, L. M. (2004) Africanized honeybees have unique tolerance to Varroa mites. Trends in Parasitology 20:112-114
Mondragon, Spivak, Vandame. 2005 A multifactorial study of the resistance of honeybees Apis mellifera to the mite Varroa destructor over one year in Mexico. Apidologie 36: 345-358.
Sumpter, D. J. T. & Martin, S. J. (2004) The dynamics of virus epidemics in Varroa-infested honey bee colonies. Journal of Animal Ecology 73:51-63 www.lasi.group.shef.ac.uk/pdf/Martin%2064.pdf
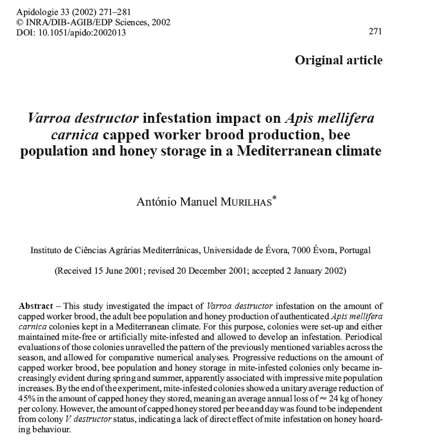
In Med climate, honey production was about half. Mite immigration up to 20/day for short period. Overall, about 1/day. Exponential growth 10x over 90 days = 1.026 by my calc.
![]()
![]()
Apidologie 2002 Not much difference in colonies on new comb, but twice the varroa on new comb.