


Sick Bees – Part 15: An Improved Method for Nosema Sampling
So How Did We Get on the Wrong Track?
How to Determine the Colony Infection Rate
So What if I Count the Number of Infected Bees out of 10?
An Assessment of Our Situation
From Where Should You Take Samples?
Practical Application: Completely Subject to Revision
Follow Up on the Quick Squash Method
From Where Should We Take Samples?
Sick Bees 15:
An Improved Method for Nosema Sampling
Randy Oliver
ScientificBeekeeping.com
In the previous articles in this series I showed how to use a microscope to view nosema spores and discussed from what part of the hive to take bee samples, and how researchers are interpreting spore counts. But spore counts don’t tell us what we really need to know!
Author’s Note
I’m hoping that the reader is benefitting from my digestion and summarization of current (and past) nosema research. There is a tremendous amount of information out there (much of it conflicting or confusing), but I’m trying my best to condense and simplify it into terms meaningful to Joe Beekeeper. The frustrating thing, though, is that it is clearly apparent that we still have a great deal more to learn about these parasites before anyone can make definitive recommendations as far as best management practices!
So my apologies in advance for the length and depth of this article. But I’m going someplace different, and feel that it would benefit the reader to follow the history and thought process that led to the conclusions that I reach at the end.
Samples from Within the Hive
Most researchers take bee samples for nosema testing from under the lid, or from an outside comb, since such samples are generally easier to take and presumably more consistent as far as bee age structure. The expectation also is that such a sample would be most representative of the colony infection as a whole, as opposed to samples from the entrance, in which spore counts are often sky high, or samples of nurse bees, in which counts are generally minimal. The assumption, of course, is that a “peripheral” sample would contain mostly mid-aged and older bees.
In early November, I had the pleasure of being visited by Dr. Dewey Caron, so I used the opportunity to put the above hypothesis to the test. We had experienced rainy weather and cold nights the two previous days, so the bees had not foraged nor broken cluster during that time. We went out to the bee yard and took samples of bees from the outermost portion of the cluster, from honey frames in the upper hive body (the bees were in fairly tight cluster, so I doubt that there had been much bee movement in the past two days).
As I illustrated in Figure 6 of my previous article, it is a normally a relatively simple matter to determine the “age” of the bees in a sample by seeing how much pollen is in their guts—it is generally assumed that only young bees (nurses) consume pollen. So we froze the bees and then spread them on a grid and crushed them to squash out their gut contents. As you can see in Figure 1, to our great surprise, the vast majority of bees in the samples from the three hives that we tested had guts full of pollen!

Figure 1. A sample of crushed bees from the periphery of the cluster (on an upper honey comb) after two days of confinement by cold weather in early November. Note that every single bee’s gut was full of pollen (the orange stains), indicating that they were likely nurse bees, rather than older bees, and thus would be less likely to be infected by nosema.
We confirmed by microscopy that the orange coloration of the gut contents was indeed due to pollen grains. I have done similar squashes during summer, and again found substantial proportions of bees throughout the hive to have pollen in their guts, as opposed to bees in entrance samples, which rarely contain appreciable pollen. In the sample illustrated above, the extremely high proportion (100%) of bees containing pollen could possibly be due to the population turnover in November, when the forager bees fly off to die, leaving only young bees in the hive to winter (Mattila and Otis 2007). I have not yet confirmed this.
Practical application: So I’m not clear at this point whether these pollen-filled bees are chronologically old bees or not!
Another interesting finding that we made was that in a 50-bee subsample of one of the above samples, the spore count (which appeared to be N. ceranae), was about 100 spores in a field of view, indicating an infection level of about 20M. This high count in ostensibly young bees caught my attention, so I squashed individual bees one at a time—in the first six, only one of them contained an appreciable number of spores. Apparently, in the 50-bee sample, a few highly-infected bees skewed the spore count to that alarming level (Fig. 2). My point is that you should not allow any individual spore count to scare you!
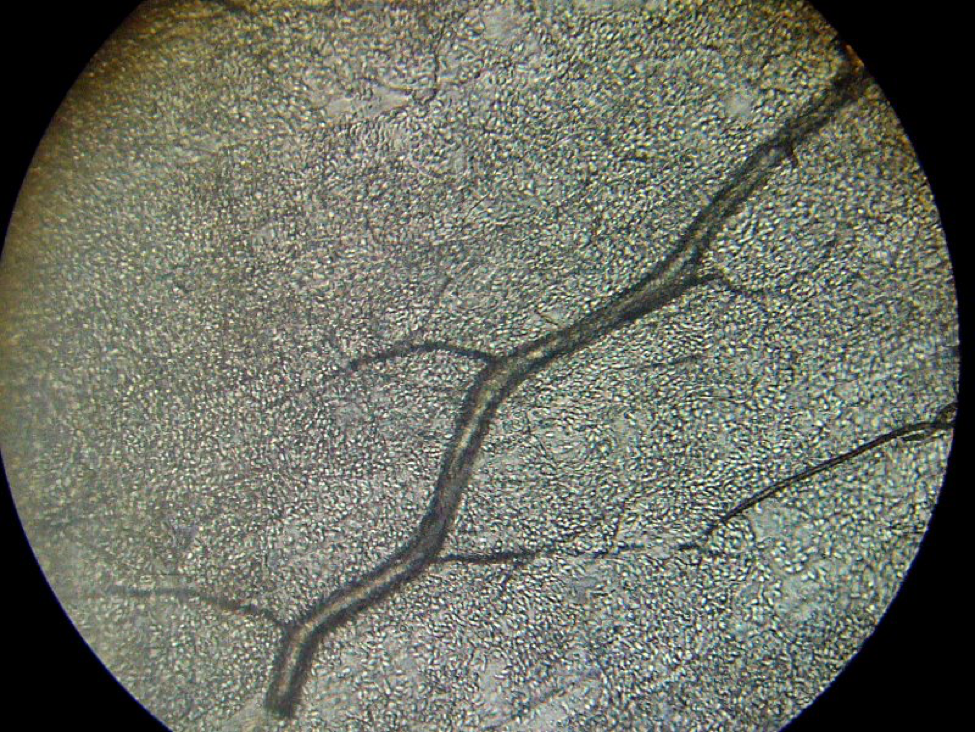
Figure 2. One highly-infected bee can really skew a spore count! This photo, taken at 400x, shows thousands of nosema spores packed into the Malpighian tubules (bee “kidneys”), which are running at an angle crossways. The treelike structure is a tracheal (breathing) tube. A bee infected to this degree could contain 500 million nosema spores!
Practical application: I would normally have been alarmed by a mean spore count of 20M in a sample of fifty young bees, but upon closer inspection, most of the bees in the subsample of 6 bees were not infected to any degree.
I have written extensively about varroa. Varroa is easy to monitor, and if one makes an effort to understand its well-documented biology and population dynamics, then it is a relatively straightforward matter to make wise and effective management decisions for controlling its degree of damage to bee colonies. Unfortunately, we are nowhere near that state of confidence with N. ceranae. Worldwide data from actual field studies are so conflicting that no one can really make meaningful recommendations as to what level of infection, based upon simple spore counts, is economically tolerable. Add to that, there are potential down sides to treatment—first, fumagillin’s expensive, it may have negative side effects upon bee health, may contaminate honey (and is not approved in many countries), and many beekeepers simply are adverse to adding one more danged treatment to their hives (Figure 3). I will discuss the above concerns, as well as the potential consequences (or lack thereof) of untreated nosema infection in later articles.
Practical application: I seriously question whether spore counts can be translated into meaningful treatment thresholds!
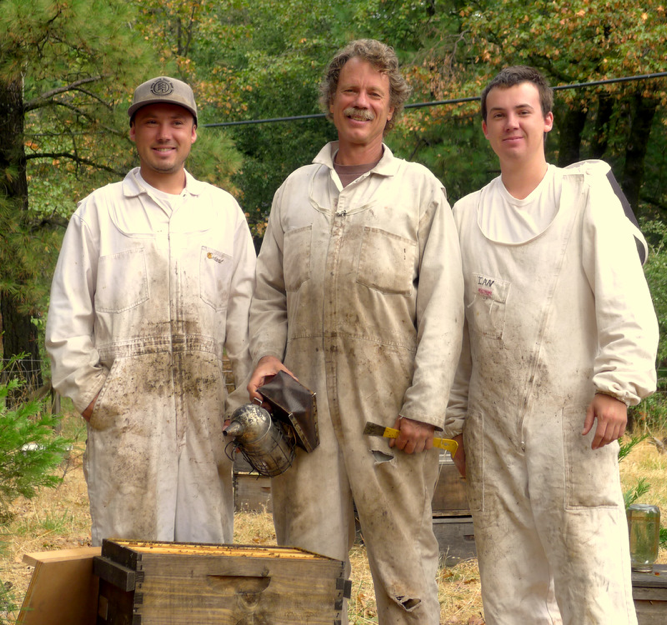
Figure 3. Let me warn you, that if you actually start sampling for nosema, it will give you much more to worry about! When we find high spore counts here at WishWeKnewWhatWeWereDoing Apiaries, my sons (Eric, on left, and Ian) and I worry about filling our almond pollination contracts.
Until recently, I pretty much blew off Nosema ceranae as not being much of an issue in my operation, despite finding spore counts in the millions or tens of millions, especially in spring. Our colonies have generally fared well, and I haven’t noticed any strong correlation between colony strength and nosema counts. However, I’m a bit uneasy since spore counts have seemed to climb each year, and are higher this season than ever.
What most troubles me, though, is recent evidence that nosema is more of a problem in colony health and mortality than I have previously suspected—I will be covering this in subsequent articles in this series (I often am forced to choose which subject to cover first). So I’m in the same boat with the rest of you who are wondering how best to diagnose the degree of nosema infection in your operations, and whether treatment would be worthwhile.
Soundbite Science
We currently live in an age of information overload, largely due to the internet, with snippets of knowledge thrown at us faster then we can put them all together. This is a mixed blessing with scientific research, as sometimes quality is sacrificed in the race to be first to report some finding. Due to competition for limited funding, we are seeing a lot of “soundbite science” being published by grad students and post docs fighting to make a name for themselves, or faculty needing to “publish or perish.”
But back in the day, the government subsidized the kind of painstaking, grinding, and detailed agricultural research seldom seen today. To see an example, download Dr. G.F. White’s 1919 exhaustive 9-year study on nosema (Google Books “bulletin 780 nosema”) undertaken after he discovered its presence in the U.S. —these guys with a government mandate were thorough! In this age of budget cutting and taxpayer support for giant agribusiness (less than 2% of USDA spending goes toward research these days), there is a strong case to be made for we beekeepers to encourage government funding of bee research.
Dr. White concluded:
“As a rule, colonies which in the spring of the year show less than 10 per cent of Nosema-infected bees gain in strength and the losses are not detected. This is often true also in cases where the infection is somewhat greater than 10 per cent. When the number of infected bees approaches 50 per cent the colonies become noticeably weakened and in many instances death takes place. When more than 50 per cent are infected they become weakened and usually die as a result of the infection. Generally speaking, therefore, it may be said that when a colony contains less than 10 per cent of Nosema-infected bees the prognosis is excellent; that when it contains more than 10 and less than 50 per cent the prognosis is unfavorable; and that when the number of Nosema-infected bees present approaches 100 per cent the prognosis is especially grave.”
Pay attention: This prognosis is remarkably similar to that of Higes (2008)—that the tip point for colony health appears to occur when more than about 40% of the bees in the hive become infected (a 40% infection rate). The practical application is that spore counts may not be the best way to assess the impact of nosema infection upon colony health—it may be more important to determine the relative proportion of infected bees to healthy bees.
I will continue to return to Dr. White’s findings in this series, as well as those by Dr. Mariano Higes and his collaborators in Spain, in which, by the way, there are about the same number of hives as in the entire contiguous U.S., in approximately 1/15th of the land area! What strikes me is the similarity in their conclusions, nearly a century apart, when they discovered, and then thoroughly investigated, nosema epidemiology and pathology in their respective countries!
Infection Rate
The proportion of infected bees in a hive is called the infection rate, and expressed as a percentage—if a quarter of the bees are infected, that would be a 25% infection rate. Remember, a colony of bees is a superorganism, with each individual bee somewhat akin to a single cell of your own body (of which millions die every day). A colony can easily handle the loss of a certain percentage of sick bees every day, especially if those bees are aged, and nosema infection is generally worse in the oldest bees (since aging allows more cycles of parasite reproduction within the bee).
Dr. White suggested that an average of about 10-15% infected bees in a hive is “normal.” The rate in sick hives could go up to 100%! He found that the infection rate would often go to 70% in experimentally-inoculated hives.
So let’s digest this. If only, say, 5 percent of the bees in a hive were actually infected (and only seriously infected during their last days of foraging life), the overall nosema infection would have little impact upon the colony, as they would be quickly replaced by the 1500-2000 new bees emerging each day. However, if 50 percent of the bees were infected, then that is entirely another matter! During the spring and summer, their shortened lifespan could seriously affect the population dynamics of the hive, reining back its normal population growth and ability to forage. And during the winter, when bees must live to a ripe old age in order for the cluster to survive until spring, a high nosema infection rate could lead to colony collapse. I will return to the details of this subject in an upcoming article.
Practical application: Nosema can be a serious problem during either winter or spring, should a high proportion of bees in the hive become infected. The infection rate is a more accurate measure of the seriousness of the infection than is a mean spore count, since a high spore count may merely reflect that one or a few highly-infected bees happened to be in the sample.
So why have we been focusing on spore counts, rather than infection rate? I just got off the phone with a large commercial queen producer who has closely tracked N. ceranae levels (and spent a large amount of money on treatments). He has nearly given up on looking at spore counts, since they simply did not appear to correlate to any significant degree with colony health and production. Ditto for my operation, and for much of the worldwide research. I feel that it is time for us to move beyond spore counts!
I’m not the only one who feels this way. Dr. Higes team’s recently entreated: “There is an urgent need … to decide on the reliability of standard methods to establish the levels of infection, a measure that will be necessary to standardize procedures to accurately, reliably and meaningfully quantify the degree of Nosema infection in honey bees” (Meana 2010). It’s time for a paradigm shift of moving away from sample means, and to go back to looking at the actual percentage of infected individual bees.
So How Did We Get on the Wrong Track?
Good question! I’ve always wondered how the 10-bee sample size figure ever got engraved in stone. It appears that it evolved from a statement by Dr. White himself, who wrote that “Ten bees from a colony constitute a satisfactory sample as a rule.”
So 10 bees became the typical sample size from the early 1900’s until we found out that we had N. ceranae. At that point, I was misled by “discovery sampling” statistics (Oliver 2008), since I thought that I needed to “discover” whether I had nosema in my operation, and thus recommended taking samples of at least 50 bees. This number (or even 100) is commonly used by researchers these days, since it also helps to minimize the influence of any single highly-infected bee upon the mean spore count.
Unfortunately, many of us became seduced by the attractiveness of thinking that the number of spores counted in a hemacytometer actually reflected the seriousness of an N. ceranae infection in a hive. Fifty-bee samples are good for discovery, but in truth, once you’ve discovered that you have N. ceranae in your operation, they actually can be misleading. Here’s the funny thing: Dr. White’s 10-bee samples are actually a better assessment of the seriousness of a nosema infection! But when he recommended 10-bee samples, he wasn’t talking about counting spores! What he actually recommended was:
“When a diagnosis of the disease is being made in practical apiculture, therefore, considerable caution should be observed. A colony showing only a small percentage of Nosema-infected bees and not other evidence of the disease is practically healthy. In reporting the presence of infection it would seem well to indicate in some way the amount of infection present. The percentage of infected bees among those examined might be given.”
This is a major point! Nosema infection at the colony level is not about spore counts—rather, it is about the percentage of the bees that are infected!
So why the heck did most everyone go from determining the infection rate to counting spores? Well, several researchers found that, at least with Nosema apis, spore counts of a 10-bee sample roughly correlated with infection rate. Then some Canadian scientists (Fingler 1982) found that a 25-bee sample was an even more “reliable method of assessing the degree to which colonies are infected by nosema.” But again, those researchers clearly understood that spore counts were merely crude proxies for the actual rate of infection. I doubt that beekeepers (or even many subsequent researchers) ever fully grasped that message.
So is a 10-bee sample enough? Look at it this way: since a single nosema-infected bee typically contains more than 10M spores (Forsgren 2010; Smart 2011), then having even one single infected bee in a 10-bee sample (indicating > than a 10% infection rate) would put the mean spore count above 1M—the typical rule of thumb for treatment. So what’s the chance of hitting at least one infected bee in a 10-bee sample.
In order to answer this question, we need to use probability theory, which was ironically, initially developed to help gamblers make better decisions in games of chance. As an aside, doesn’t it seem funny that the ABF national convention is going to be in Las Vegas? I mean, commercial beekeepers already live their lives gambling their life savings on the weather, the price of honey, varroa treatments, and honey flows, and are going to be in Las Vegas just before the big roulette wheel stops spinning and tells them whether they’ll hit the jackpot in the almonds the next month!
But I digress. Probability theory can be used to predict, for example, the chance of being dealt two aces in a hand of five cards (4/52 x 3/51 = 1/221, or less than half of one percent probability). Bee samples can be looked in a similar manner, since when you are squashing bee guts, nosema infections generally show as either positive (tons of spores) or negative (zero to a very few spores)—sort of a sick/not sick litmus test. So I did some homework with probability tables, and was able to answer my question about hitting 1 infected bee out of 10 (Figure 4).
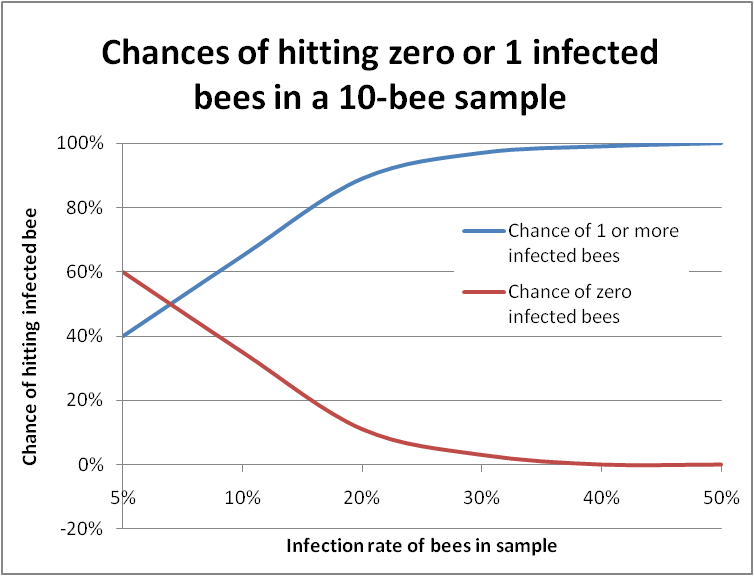
Figure 4. In this graph the bottom scale is the actual infection rate of the colony. The blue line plots the chance of hitting at least one infected bee in a sample of 10 bees. The red line indicates “negatives,” in which you would not find a single infected bee. You can see that it’s almost impossible to miss getting at least one infected bee in a 10-bee sample if the colony infection rate is over 30%.
So the 1M spore rule of thumb is very conservative, meaning that you certainly wouldn’t miss a nosema infection, but also means that you’d often wind up feeding fumagillin to apiaries that in actuality were dealing just fine with relatively “safe” infection rates. In the case of N. ceranae, in which individual bee spore counts may exceed 100M, having even a single infected bee would result in a mean spore count of 10M, which might scare the pants off you, despite the substantial likelihood that the colony was only infected at a minimal rate!
A recent study by Traver and Fell (2011a) supports the above interpretation—they found that colonies that tested low for nosema DNA exhibited zero spores in 10-bee samples about a third of the time, whereas samples from colonies with “high-level” infections seldom were free of spores. So it appears to me that the good old 10-bee spore count works fairly well as a crude but conservative proxy for the actual infection rate, with spore counts stepping up sharply with each additional infected bee in the sample. However, it should not be interpreted as any sort of linear measure of the degree of infection. It worked, but it likely led to too many unnecessary treatments.
The problem with spore counts: spore counts from a pooled homogenate of many bees are more or less a measure of the reproductive success of nosema in a relatively few bees. The infection rate (percentage of bees actually infected) is a much better measure of the actual impact of nosema upon colony health.
How to Determine the Colony Infection Rate
OK, I hope that I’ve convinced you now that it’s time to move away from counting spores—but that certainly doesn’t mean that you should throw away that shiny new microscope that I earlier convinced you to buy!
You may have wondered why, when I was squashing bees in my kitchen with Dr. Caron, that I stopped after crushing only six bees. Well, in truth, squashing individual bees is time consuming, and my gut feeling was that I would have hit more than one infected bee in the sample should the actual infection rate have been high.
Of course, my readers should know that I’m not about publishing “gut feelings.” So, being the curious sort of guy, I bit the bullet and plowed into an investigation to see whether I could come up with some sort of shortcut for determining a colony’s infection rate without having to individually squash a whole bunch of bees. I spent some serious time working out the math (much to my long-suffering wife’s dismay, such as when she groggily walked into the kitchen first thing in the morning, and was immediately barraged by me excitedly showing her the results of some probability calculations that I’ve been working on since before dawn).
My personal issues aside, what I found was that the problem with extrapolating from samples is that you want to avoid false negatives (missing a serious infection; easy to do with samples of only a few bees), while at the same time not misdiagnosing false positives (erroneously concluding that a healthy hive is seriously infected—which is a problem with the mean (average) spore count from of a pooled bee sample).
Scientists just love hard, accurate figures out to the third decimal place, with 99% confidence levels. But in reality, there is rarely that kind of certainty when you’re dealing with any data derived from bee samples! And there’s a lot of elbow room when making management decisions. So first, let’s perform a reality check. Suppose that you have a colony that is infected at the 40% rate, and that the infected bees are evenly distributed in the hive. And then suppose that you take a sample of 100 bees from that colony.
You’d expect that the sample would contain 40 infected bees (40 per 100 = 40%). And the average sample would indeed contain 40 bees. But no single sample is an average! Any single sample has only an 8% chance of containing exactly 40 infected bees!
That’s fine, you say—all that I really care about is whether that sample contains at least 40 bees. The chance of that happening with a single sample of 100 bees is still only 54%! You would still get 46% false negatives. A 46% chance at losing a bet isn’t bad if you’re betting five bucks in Las Vegas. But it’s pretty poor odds if you’re risking your bee operation on it!
Motivational message: For the arithmetically-challenged among you whose eyes are starting to glaze over because I’m using three-syllable words and talking about math, please hang in there!
So What If I count the Number of Infected Bees Out of 10?
You’d sure think that this would make sense! After all, Dr. White recommended this method. But surprisingly, it’s not that accurate. Let’s look at the probabilities. Suppose that a colony is actually infected at the 40% rate, and that you took a perfectly representative sample of 10 bees. You’d still have only a 25% chance of finding exactly 4 infected bees (but a 67% chance of hitting between 3 and 5 bees). So counting the number of infected bees in a 10-bee sample will give you only a very rough assessment of the actual infection rate.
But here’s a big surprise–counter intuitively, as the sample size goes down, your chances of missing that infection actually go down too! For that same 40% infected colony, here are the probabilities of underestimating the infection rate (Table 1):
| Sample Size | Probability of getting fewer than 40% infected bees in the sample |
| 100 | 46% (46 times out of 100) |
| 10 | 38% |
| 5 | 34% |
Table 1. Probabilities of underestimating the infection rate of a colony in which 40 out of 100 bees were actually infected, by sample size (number of bees in the sample), assuming a perfectly representative sample.
I’m hoping that you’re catching my drift here—that we may be able to streamline the process of estimating the degree to which a colony is infected, by utilizing 5-bee samples.
An Assessment of Our Situation
So let’s review where we stand with regard to nosema sampling methods and interpretation:
- We want to avoid dangerous false negatives, since they might lead you to not treat a truly sick apiary.
- However, you (and your bees) could live with false positives, since the worst that you’d do is to give unnecessary treatments.
- But you’re still a penny pinching beekeeper who doesn’t want to waste money (or you don’t want to use treatments for other reasons).
- Sending a sample of 10 bees to the lab for a spore count has an unacceptably high rate of false positives—at least two-thirds of the time.
- Spore counts of even 25-bee samples of either house or forager bees are still unreliable predictors of colony health (Meana 2010).
- And even individually squashing 10 bees one at a time will underestimate a serious 40% infection rate over a third of the time!
So what to do? I’m not telling you all this merely to frustrate you—I and my sons live off the income from our bees, so I’ve got a vested interest in finding a way out of this quandary! Researchers worldwide are coming to the conclusion that simple spore counts generally have little correlation with observed colony health status. What you really need to know is one of two things—are your bees in the “safe” zone (under 20% infected) or in the danger zone (over 40% infected). And what you don’t want to do is to spend all day squashing bees one at a time and viewing their guts under a scope. Are we all agreed on the above?
So I got out the probability tables, a pocket calculator, found a handy online binomial distribution calculator (http://stattrek.com/Tables/Binomial.aspx), and started playing with the numbers. I found that for our purposes of differentiating between a benign nosema prevalence and serious infection,that the sweet spot for sample sizes lies in the range of 5-10 bees (sort of a Goldilocks “not too many, but not too few”). See for yourself (Fig. 5):
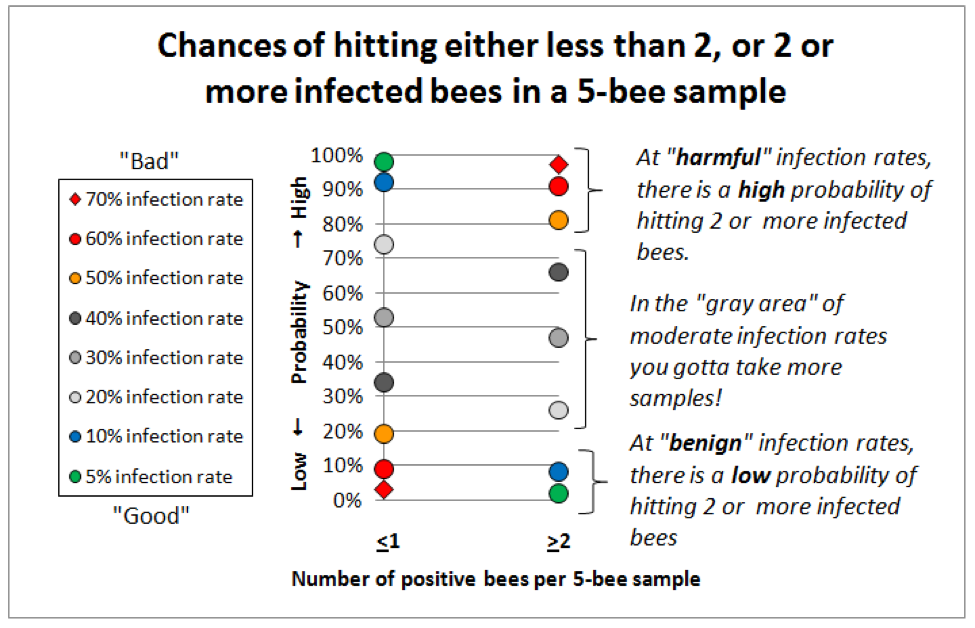
Figure 5. This graph is for 5-bee samples. Compare identical colored markers between the left column and the right column—the greater the vertical spread, the better the discrimination between infection rates. Note that at “benign” infection rates (green and blue dots) you’d nearly always hit either zero or 1 infected bee, but rarely 2 or more. At dangerous infection rates (red markers) the reverse holds true—you’d rarely hit zero infected bees (not shown), and seldom even 1, but nearly always at least 2 positive bees if the colony infection rate exceeded 60%. I will post this article to ScientificBeekeeping.com for handy reference.
One HUGE Assumption
All of these probabilities are contingent upon your taking a representative sample that reflects the overall infection rate of the hive. Would this be the case in real life? Would 5-bee samples give consistent results? I didn’t know, so l decided to put it to the test the day before I sent this article off to press!
Validation of the Method
The “boys” and I were treating colonies with an oxalic acid dribble in November (bees were still flying most days), so I took samples of bees from the weakest hives in each yard, and later processed subsamples of 5 bees at a time. Here are the results (Table 2):
|
Colony number |
Number of nosema-positive bees per 5-bee sample, and (below) per 10-bee sample (by subsequent pairs) |
Overall infection rate of sampled bees |
Notes |
|
1 |
0/5, 0/5 0/10 |
0/10 = 0% |
Appeared to be free of nosema. |
|
2 |
0/5, 0/5 0/10 |
0/10 = 0% |
Appeared to be free of nosema. |
|
3 |
2/5, 1/5, 2/5, 1/5, 2/5, 4/5, 0/5 3/10, 3/10, 3/10, 3/10, 6/10, 4/10 |
12/35 = 34% |
Only 1 zero in the 5-bee samples. Note the consistency of the 10-bee samples. |
|
4 |
0/5, 0/5 0/10 |
0/10 = 0% |
Appeared to be free of nosema. |
|
5 |
3/5, 2/5, 1/5, 3/5, 1/5, 1/5 5/10, 3/10, 4/10, 4/10, 2/10 |
11/30 = 37% |
No zeroes. Only the last pair of 1/5’s would have missed the infection. |
|
6 |
4/5, 0/5, 3/5, 5/5, 2/5 4/10, 3/10,8/10,7/10 |
14/25 = 56% |
The 10-bee samples certainly picked up the infection! This colony had the most intensely infected bees, plus a serious amoeba infection. |
|
7 |
0/5, 0/5 0/10 |
0/10 = 0% |
Appeared to be free of nosema. |
|
8 |
0/5, 1/5, 0/5, 0/5, 1/5 1/10, 1/10/ 0/10, 1/10 |
2/25 = <1% |
Very consistent results |
|
9 |
3/5, 0/5, 3/5, 1/5, 0/5 3/10, 3/10, 4/10, 1/10 |
7/25 = 28% |
2 bees were only slightly infected. One 10-bee sample underestimated. |
|
10 |
2/5, 2/5, 3/5, 0/5, 2/5 4/10, 5/10, 3/10, 2/10 |
9/25 = 36% |
2 bees were only slightly infected. The last 2/10 missed, but the 2/5 would have flagged the infection. |
Table 2. Results of bee samples from 10 weak colonies in the fall. I sub sampled each sample, 5 bees at a time, with each bee being individually squashed (total of 205 bees), and rated each bee as to whether it was positive for nosema spores or not. I stopped counting after two groups of 5 if I hadn’t yet detected any nosema. Out of 31 pairs of 5-bee samples (the lower figures in column 2), in only 2 cases out of 31 would I have underestimated the actual colony infection rate (by not hitting either 2 positive bees in 5, or 3 in 10). Note how consistently the paired 10-bee samples reflected the overall infection rate!
Practical application: I found the above reality check instructive, to say the least! In fact, I could say that I learned more about the degree of nosema infection in my operation in three hours of bee squashing than I’d learned in the last four years of counting spores! I doubt that I will ever do another spore count.
I love this method! For one, I learned that nosema was only associated with half of my weakest hives, so I can now sleep a bit better. On the other hand, half of those weak hives did have high nosema levels, so I need to address this (spot treatment?). I’m now eager to go sample some strong colonies. What is also apparent is that the method worked remarkably well! It’s not perfect, but it appears that I’d rarely miss an infection if I processed two samples of 5 bees for each tested hive. And the method readily picked out the really sick hive! Clearly, this is only a preliminary test of the procedure, and needs to be repeated with a lot more hives, but the apparent accuracy of the method is very encouraging to me.
The only remaining problem is that most beekeepers will choke at the thought of how much time it would take them to squash and microscopically view 10 bees out of each sampled hive. And that leads us to:
Sequential Sampling
Think of this Quick Squash method as similar to doing an alcohol wash of 300 bees. If I only see 1 mite, no worries for a while, as mite populations take about a month to double. If I see more than 6 mites, I treat. In between, I make a note to check back soon. It’s a similar case for nosema sampling (although it may take less time for the infection rate to double).
I’m immensely grateful to Dr. Jose Villa of the Baton Rouge Bee Lab for bringing to my attention that I was reinventing the wheel—this sort of decision making process based upon small sample sizes already has a fancy name: it’s called “sequential sampling,” and was develped for quality control inspections during World War II. Furthermore, Dr. Villa dug into the library and forwarded me existing “Decision Tables” for tracheal mite sampling produced by Tomasko (1993) and Frazier (2000). They exactly fit the bill for what I was crudely trying to work out!
Sequential sampling is all about the tradeoff between tedium (the number of bees that you need to squash and view) and confidence (the error rate which you are willing to accept). And it appears that for our purposes I estimated the minimum number of bees to sample right on the nose!
So here’s the gist (backed by some complex math) for the following parameters. Given that you want to decide whether about 10% or fewer of the bees in the population are infected (the “tolerable” level), or if the rate is above the 30-40% range (“intolerable”), and are willing to allow an error rate of 20% for overestimating (“false positives”), but only a 10% limit for underestimating a serious infection (I’m intentionally avoiding most of the associated mathematical jargon). The cutoffs are:
Practical application: it appears that in order to make a decision whether to treat or not, that a couple of 5-bee samples should be adequate, interpreted as follows:
0 positive bees out of 5, or no more than 1 positive out of 10 indicates < 10% infection
3 positive bees out of 5, or at least 4 positives out of 10 indicates > 30% infection
Any number of positive bees lying between these cutoffs (e.g., 2 bees out of 5, or 3 out of 10) suggest an infection level that lies in the gray zone, but I doubt that going beyond a 10-bee sample is worth the effort—I’d just move on to the next sample.
So I’ve got us down to 10-bee samples. But even so, I must advise you that nosema infection appears to exist in “pockets” of bees in the hive, so any single small sample is inadequate for making an apiary-level decision (Botias 2011). It’s obvious that what is needed is a quick method for processing samples of 10 bees at a time!
Acknowledgements
I wish to thank my wife Stephanie for her patience, and helpful comments on my manuscripts. As always Peter Borst helped with the research for this article. Thanks to Dr. Jerry Bromenshenk for his helpful suggestions. And a big thanks to Drs. Mariano Higes, Aránzazu Meana, and Raquel Martín-Hernández for their diligent work on nosema! For financial support toward this research, I’ve very appreciative of Joe Traynor, Heitkam’s Honey Bees, Jester Bee Company, the Virginia State Beekeepers Assoc, and individual beekeepers Paul Limbach, Chris Moore, and Keith Jarret.
References
Botías, C, et al (2011) Critical aspects of the Nosema spp. diagnostic sampling in honey bee (Apis mellifera L.) colonies. Parasitology Research (in press).
Fingler BG, WT Nash, and TI Szabo (1982) A comparison of two techniques for the measurement of nosema disease in honey bee colonies wintered in Alberta, Canada. ABJ 122(5):369-371.
Forsgren, E, and I Fries (2010) Comparative virulence of Nosema ceranae and Nosema apis in individual European honey bees. Veterinary Parasitology 170: 212–217.
Frazier, MT, et al (2000) A sequential sampling scheme for detecting infestation levels of tracheal mites (Heterostigmata: Tarsonemidae) in honey bee (Hymenoptera: Apidae) colonies. Journal of Economic Entomology 93(3):551-558.
Higes, M, et al (2008) How natural infection by Nosema ceranae causes honeybee colony collapse. Environ Microbiol 10: 2659–2669.
Mattila HR, and GW Otis (2007) Dwindling pollen resources trigger the transition to broodless populations of long-lived honeybees each autumn. Ecol Entomol 32:496–505.
Meana, A, et al (2010) The reliability of spore counts to diagnose Nosema ceranae infections in honey bees. Journal of Apicultural Research and Bee World 49(2): 212-214.
Oliver, R (2008) The Nosema Twins Part 3: Sampling. ABJ 148(2): 149-154. https://scientificbeekeeping.com/the-nosema-twins-part-3-sampling/
Porrini, MP, et al (2011) Nosema ceranae development in Apis mellifera: influence of diet and infective inoculum. Journal of Apicultural Research 50(1): 35-41
Smart, MD and WS Sheppard (2011, in press) Nosema ceranae in age cohorts of the western honey bee (Apis mellifera). J. Invertebr. Pathol. doi:10.1016/j.jip.2011.09.009
Tomasko, M. Finley, J. Harkness, W. Rajotte, E. 1993. A sequential sampling scheme for detecting the presence of tracheal mite (Acarapis woodi) infestations in honey bee (Apis mellifera L.) colonies. Penn. State College of Agricultural Sciences, Agricultural Experiment Station Bulletin 871.
Traver, B., and RD Fell (2011a) Prevalence and infection intensity of Nosema in honey bee (Apis mellifera L.) colonies in Virginia. J Invertebr Pathol 107 (1):43-49.
Traver, BE MR Williams, and RD Fell (2011b; in press) Comparison of within hive sampling and seasonal activity of Nosema ceranae in honey bee colonies. Journal of Invertebrate Pathology.
White, GF (1919) Nosema-Disease. USDA Bulletin No. 780.