


Sick Bees – Part 16: The “Quick Squash” Method for Determining Nosema Prevalence in a Colony
Summary (completely subject to revision)
2019 Quick Nosema Prevalence Assessment Method
First published in ABJ February 2012
Updated March 13, 2019
Randy Oliver
Since the discovery of Nosema ceranae, I and many other beekeepers and researchers have been frustrated by the tedium and apparent futility of counting nosema spores, since many of us haven’t seen any meaningful relationship between spore counts and colony health or production. I strongly suspect that the issue is not that N. ceranae does not cause problems, but rather that our methodology for assessing the degree of infection has been flawed.
The quickest way that I’ve found to determine the degree of nosema infection in a hive is to do a 2-step sampling.
Step 1: open the hive and take a sample of about 50 workers from an outer frame, or from under the hive cover. These bees can be salvaged from an alcohol wash for varroa. Set at least 15 bees aside for the time being, and use the rest for the next step.
I now typically use only 10 bees. This is based upon the thorough research on Nosema apis by GF White in the early 1900s. What he found was that individually sampling 10 bees in order to determine the prevalence of nosema infection in the house bees gave the best indication of its biological relevance–a finding later suggested by Cameron Jack in Colony Level Prevalence and Intensity of Nosema ceranae in Honey Bees (Apis mellifera L.).
Be sure to read https://scientificbeekeeping.com/the-seasonality-of-nosema-ceranae/
Step 2: place at least 25 of the bees in a ziplock sandwich bag, and roll a round jar over them to crush their guts thoroughly. Then add about 3 mL of water for every 10 bees in the sample, and massage the bag in your fingers until you’ve homogenized all the gut contents into the water, creating a semi-opaque suspension (not too clear, not too thick). For details on this step, see https://scientificbeekeeping.com/sick-bees-part-13-simple-microscopy-of-nosema/
Step 3: immediately place a drop of the suspension on a slide, drop on a cover slip, and view under the scope. Scan a few fields of view for nosema spores. If you don’t see any (or only one or two), that indicates that the infection prevalence of that sample of bees was zero–end of assessment.
On the other hand, if you see spores in the sample, then perform 10 individual bee gut squashes from the remaining bees in the original sample in order to determine the biological relevance of the infection prevalence in the colony–details below.
Infection Prevalence
The current “standard” method for monitoring nosema “level” in hives is to determine the mean spore count per bee in an aggregate sample (of typically 10-100 bees). The method is relatively quick and gives the sort of quantifiable numbers that scientists love. Unfortunately, as noted by Meana (2010), “the spore count is not directly related to the parasite burden and health status of whole colonies naturally infected by N. ceranae under field conditions.”
Spore counts certainly have their uses, such as quantifying the progress of nosema infection in individual bees in cage trials by researchers. They are also appropriate as a method for “discovery sampling.” For example, one can “discover” whether nosema is present to any extent in an apiary by taking an aggregate sample of say ten bees from the entrance of every hive and determining the mean spore count. If the count is less than 1M (1 million spores per bee), then nosema is likely not a problem in the sampled hives.
The point that I’m trying to make about sampling for nosema is that we are well beyond the “discovery” phase. Rennich (2011) found N. ceranae in at least half of all random bee samples taken in the U.S. during winter and spring.
So instead of “discovery” sampling, what we need to do is to shift to the most meaningful way to measure the potential impact of nosema upon colony health—the proportion of infected bees. Of the various terms used to describe this measure—“proportion of infected bees in a sample,” “percent infected,” or “infection rate”– I prefer the term used by epidemiologists: “prevalence.”
Practical application: I henceforth plan to use the term “prevalence” as the measure of the proportion of bees infected by nosema. For example, if 2 bees out of 10 were infected, that would be a prevalence of 20%.
There is a strong case to be made for shifting our assessment of nosema infection from “intensity” (as measured by spore counts) to “prevalence” (the percent of bees actually infected). The only problem with determining prevalence is that most of us choke at the thought of having to inspect jillions of bees one at a time. Luckily, there are practical shortcuts:
Sequential Sampling
In my last article, I proposed that even a small sample of bees might be adequate for making management decisions. I’m immensely grateful to Dr. Jose Villa of the Baton Rouge Bee Lab for bringing to my attention that I was reinventing the wheel—this sort of decision making process, based upon small sample sizes, already has a fancy name: it’s called “sequential sampling,” and was develped as a time-saving method for quality control inspections during World War II. Furthermore, Dr. Villa dug into the library and forwarded me existing “Decision Tables” for tracheal mite sampling produced by Tomasko (1993).
Dr. Maryann Frazier (2000), following up on Tomasko’s work, discussed the situation regarding the assement of tracheal mite prevalence as opposed to “parasite load” (analagous to spore counts). It is remarkable in that it almost exactly mirrors today’s situation with nosema! And in her paper she validated the accuracy of sequential sampling.
Sequential sampling is all about the tradeoff between tedium (the number of bees that you need to squash and view) and confidence (the error rate which you are willing to accept). And it appears that for our purposes, I estimated the minimum number of bees to sample right on the nose!
So let’s set some arbitrary parameters for our decision making:
- An infection prevalence of 10% is “tolerable.”
- A prevalence of 30-40% is “intolerable.”
- We’ll accept a 20% error rate for overestimating the prevalence.
- But we won’t accept an error rate above 10% for underestimating the prevalence.
We’ll use the above parameters to set our treatment thresholds—below 10% prevalence, don’t treat; above 30%, treat. The math gets complex, but here’s the gist of the outcome:
Practical application: it appears that in order to make a decision whether to treat or not, that a couple of 5-bee samples should be adequate, interpreted as follows:
0 positive bees out of 5, or no more than 1 positive out of 10 indicates < 10% infection
3 positive bees out of 5, or at least 4 positives out of 10 indicates > 30% infection
Any number of positive bees lying between these cutoffs (e.g., 2 bees out of 5, or 3 out of 10) is not enough to make a firm decision, but suggests an infection level that lies in the gray zone. But I doubt that going beyond a 10-bee sample is worth the effort—I’d just move on to the next sample.
With true sequential sampling, you’d keep sampling until you hit a critical number of positive or negative bees in order to make a treatment decision. However, my limited experience suggests that we hit a point of diminishing returns after viewing 10 bees.
Update July 5, 2012 Beekeeper Ruary Rudd (ruaryrudd@iol.ie) has developed a great Excel spreadsheet for sequential sampling. You can write him for a copy–thanks Ruary!
So I’ve got us down to sampling a maximum of 10-bees. But even so, I must advise you that nosema infection appears to exist in “pockets” of bees in the hive, so any single small sample is inadequate for making an apiary-level decision (Botias 2011). Therefore, it’s necessary to process a number of samples. What’s been holding us back from determining actual nosema prevalence is the lack of a quick method for processing a number of samples of 10 bees!
Nosema apis becomes a serious problem if about a third of the bees in a hive become infected. It appears that Nosema ceranae may be a problem at even a lower prevalence.
A Neat Little Shortcut
Since I really wanted to find a quicker way to prepare and view the 200 bees for the validation table in the previous article, I racked my brain trying to figure out a technique for speeding things up, and finally hit upon a relatively simple procedure (Figures 1,2, and 3). I’ve now got over 400 individual gut squashes under my belt, and am pretty excited about the method! This solution allows me to process bees at an overall turnaround rate of less than five minutes per sample of 10 bees!
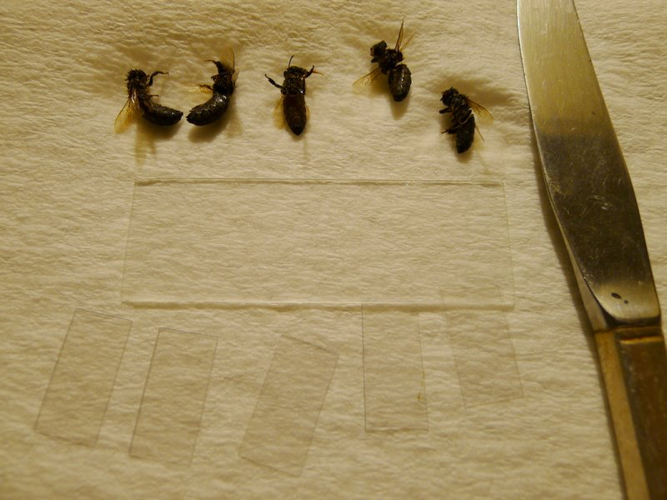
Figure 1. This photo shows the necessary equipment for a Quick Squash—5 bees, a plain microscope slide, 5 custom-made thin plastic cover slips, a table knife, and a paper towel.
The size of the cover slips is critical—they must be narrow enough not to touch at the edges, in order to keep the individual gut slurries from mixing. The easiest solution is to cut off-the-shelf plastic microscopy cover slips in half with scissors. You can then just discard them after use (cost about 20¢/10-bee sample), or wash and reuse (use your mite shaker jar).
Update Feb 2019: I prefer to recycle rather than discard. But when I looked at costs, getting a large order of #1 thickness glass cover slips works out to only about a penny a slip. At Amazon: Karter Scientific 211Z2 Standard Microscope Cover Slip, #1 Thick, 22x22mm, 200pk (Case of 2000).
Be sure to order #1 thickness cover slips, since thicker cover slips won’t allow you to focus upon the spores.
The other thing is that you don’t need to make custom cover slips at all. Three standard glass cover slips will fit across a slide, and can be discarded after use if you don’t want to wash them (although they wash easily in warm water with a tiny bit of dishwashing detergent).
But if you don’t have plastic cover slips at hand, don’t despair! You can make cover slips out of clear plastic scrap around the home—but only some plastics will work; I’ve experimented with several. Clear plastic transparency sheets unfortunately refract light in such a way that they make nosema spores look like little rectangles, so they don’t fit the bill.
The heavy blister packs from the hardware store are too thick to focus through—a cover slip for 400x viewing needs to be thin. But then I found just the thing—the clear lid from a tub of the Colonel’s Kentucky mashed potatoes (get the gravy too, so you get an extra lid). Cut it into 11mm x 22mm rectangles—they work perfectly! You can wash them in soapy water, rinse, blot, and reuse until they get scratchy.
![]() Practical tip: Cut a whole bunch of cover slips and keep them in a custard dish for easy pick up—this greatly expedites the slide prep time. Look for thin clear plastic with the #1 recycling symbol for polyethylene terephthalate:
Practical tip: Cut a whole bunch of cover slips and keep them in a custard dish for easy pick up—this greatly expedites the slide prep time. Look for thin clear plastic with the #1 recycling symbol for polyethylene terephthalate:
Beekeeper Health Breakthrough: Wracked as I was by images of beekeepers stuffing themselves with mashed potatoes in order to be able to monitor nosema levels, I forayed to the grocery to see if I could recommend a more healthful suggestion. To my great relief, I found that the rectangular containers for the nutritious “Baby Mixed Greens” are also made from PETE, and make excellent cover slips!
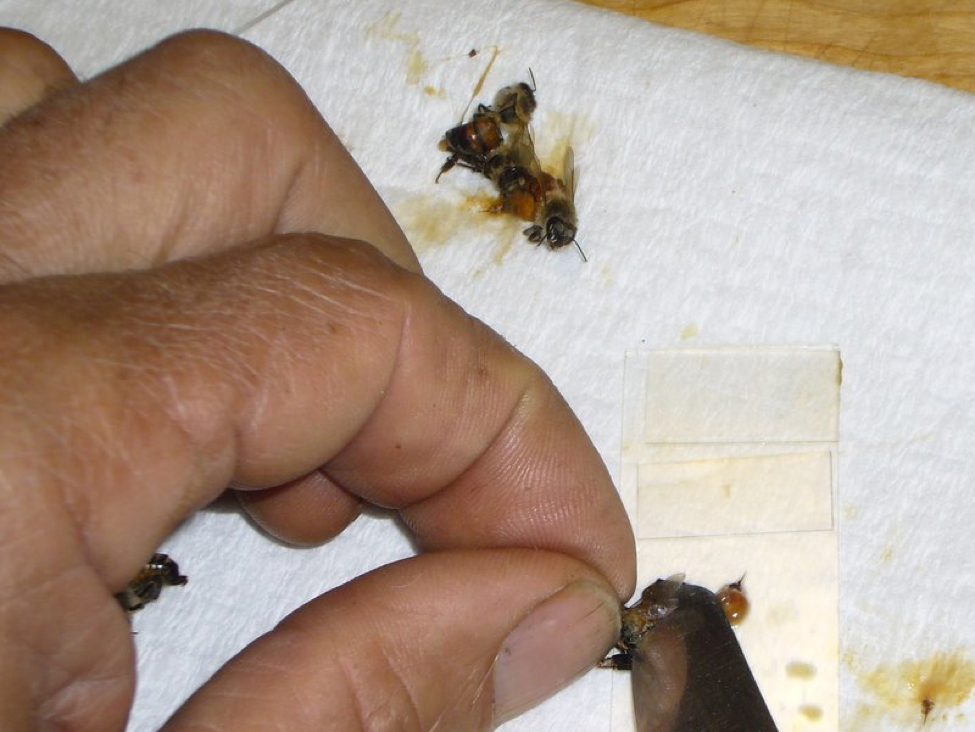
Figure 2. Hold a bee by the head/thorax, then use the table knife to “milk” the gut contents (or the gut itself) out of its abdomen directly onto the slide. Use the knife tip to mash the material in a droplet of water in order to distribute any spores into the macerate. Then remove any excess bee tissue, leaving a thin slurry (note the stinger and rectum on the slide, and on the towel to the right). Finally, place a cover slip over the drop of slurry. In this photo, I’ve completed two preps at the top (neither contained much pollen). I’m working on the third, which will make a more opaque slurry.
The technique of “milking” the bee’s abdomen by rocking a flat blade from front to rear will quickly cause the discharge of the gut contents, or with increased pressure, the gut itself. It is critical to thoroughly crush and mash these in a little water—I wet the tip of the knife blade in a stream of water if necessary—until you create a cloudy, but not opaque, macerate. Tip: it’s critical to be able to press the knife tip down flat against the slide, so work with the slide near the edge of a raised cutting board, so that your knuckles can drop below the work surface level. Be careful to keep the macerate on the portion of the slide that will be under each cover slip. Then be sure to flip off any thick chunks of excess tissue, especially the sting or any dark pieces of exoskeleton, or they will space the cover slip up too high. Clean the knife tip under running water, and wipe it on the dry towel between each bee. With practice, this entire process takes only a few seconds!
Repeat the process down the slide, exercising caution to wipe the blade thoroughly between bees, and not allowing any liquid to run from sample to sample. The separate cover slips keep the samples from mixing. After you’ve crushed and covered 5 gut samples, then fold the towel over the slide and press down firmly and evenly to set all the cover slips down flat, and to absorb any liquid that might otherwise get onto the microscope lens.
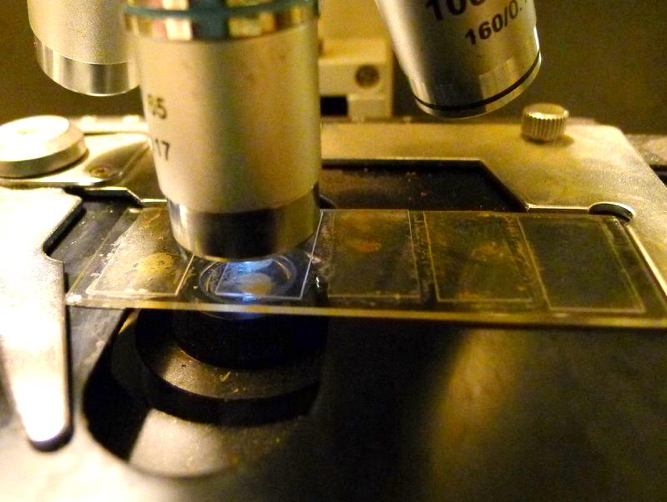
Figure 3. Presto—you now have a 5-bee gut sample ready to view under a scope. It’s then a simple matter to glance at each of the samples in turn to check for nosema spores. This technique works for either freshly-killed or preserved bees.
At this point is really helps to have a scope with an adjustable stage (having turnable knobs to move the slide around). Then you can easily move from one cover slip to the next, and quickly scan up and down each slip if necessary. It’s also very easy to see whether you’ve gotten nurse bees or foragers, since each gut squash clearly shows any contained pollen (Figs. 4 and 5).
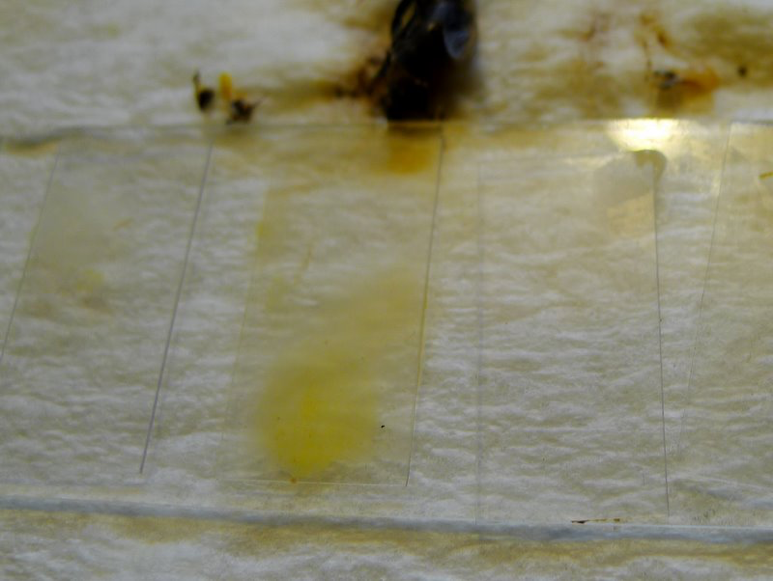
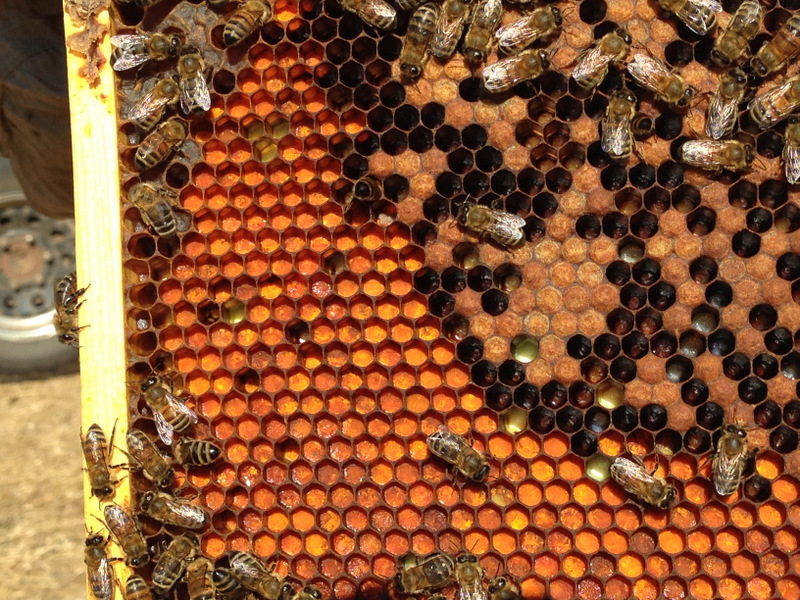
Figure 4. Close up of the differences between squashes containing pollen (center) and those from without. This sample was taken from the entrance on a cold November morning with minimal flight. See the following photos for how the two left-hand squashes looked under the scope. Two out of 5 of these bees were infected.
Squashed bee guts, especially the midgut, are typically either free of nosema, or strongly infected, as above.
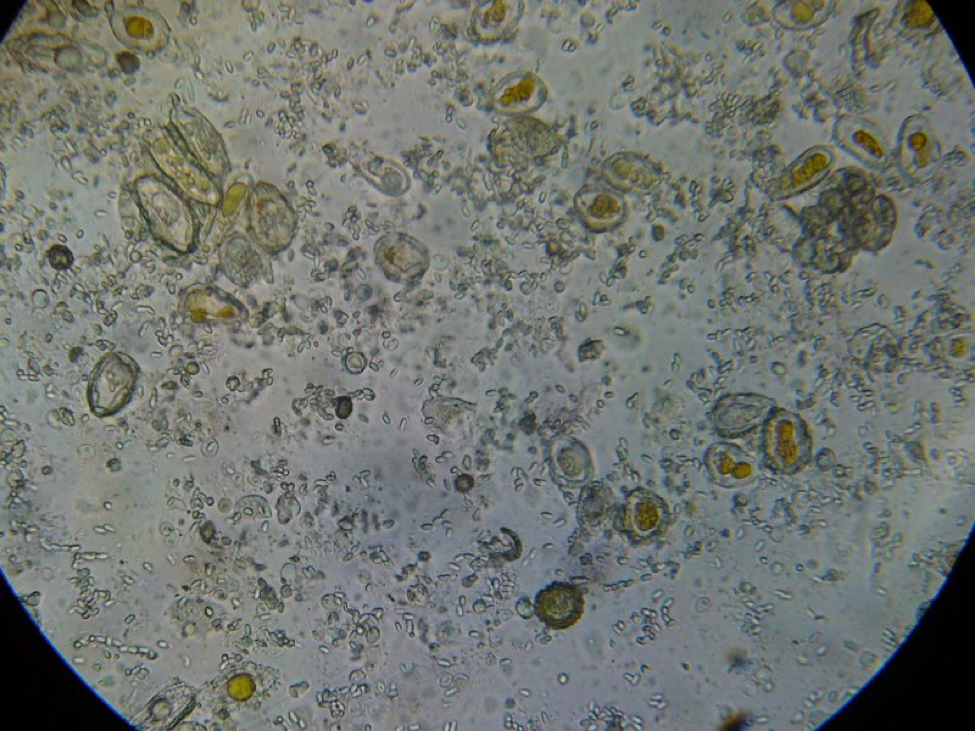
Figure 5. This is a view of the orange-colored center squash shown above. This bee is only moderately infected with Nosema ceranae, and the gut also contains some orange-centered rust fungus spores–which are unhealthy for bees to consume.
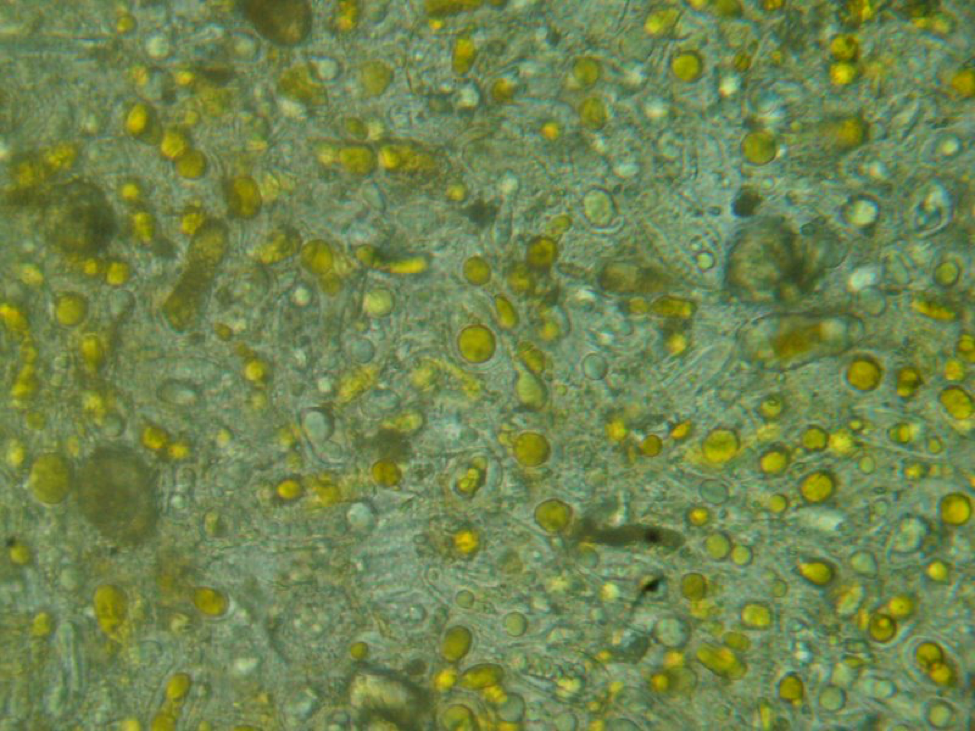
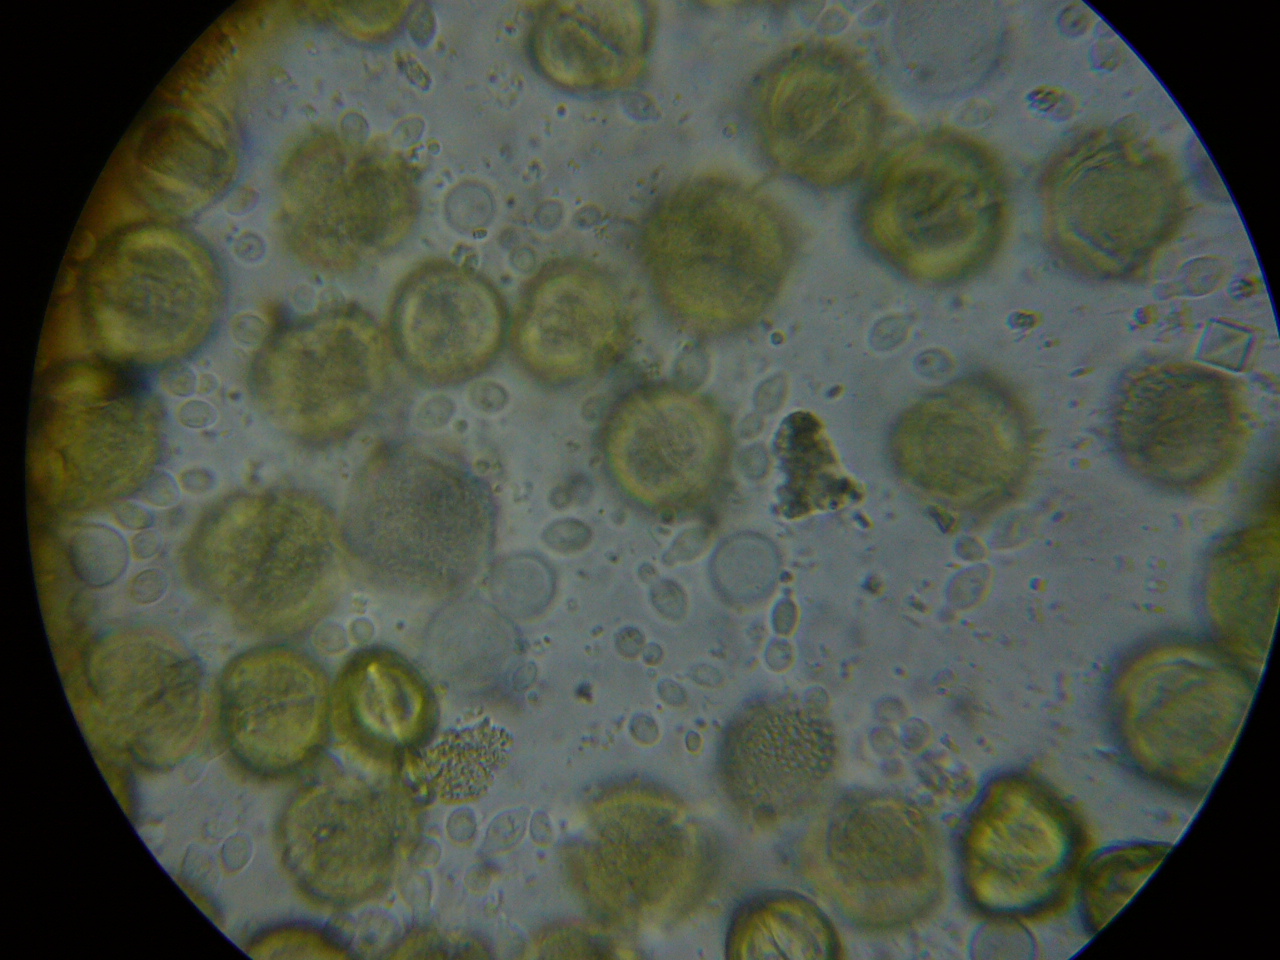
Figure 6. A close up from a gut packed full of “fried eggs.” It took me a while, but I finally identified these spores as being from rust fungus.
It took me quite a while, but I eventually identified the “fried eggs” in the bees’ guts as being spores from a blackberry rust fungus. In the photo above, you can see the fluorescent-orange spores packed as beebread–this is not pollen! The fungus tricks the bees into gathering its spores. Note the dying larvae next to this abundant beebread–although this colony appears to have abundant beebread, in fact, the fungal spores are unhealthy to the hive. In my area, hives full of such spores go downhill, unless we feed them all the pollen sub that they will eat. See “Fried Eggs” Identified!
Back to nosema sampling, one of the major beauties of the Quick Squash method is how quick it is, since you don’t need to count spores at all (Fig. 7)!
Practical application: After a bit of practice, my turnaround time for the entire process of preparing, viewing, and recording results for 10 bees (two 5-bee slides) is just over four minutes if I don’t fumble something along the way. Tip: have plenty of precut cover slips at hand in a small bowl.
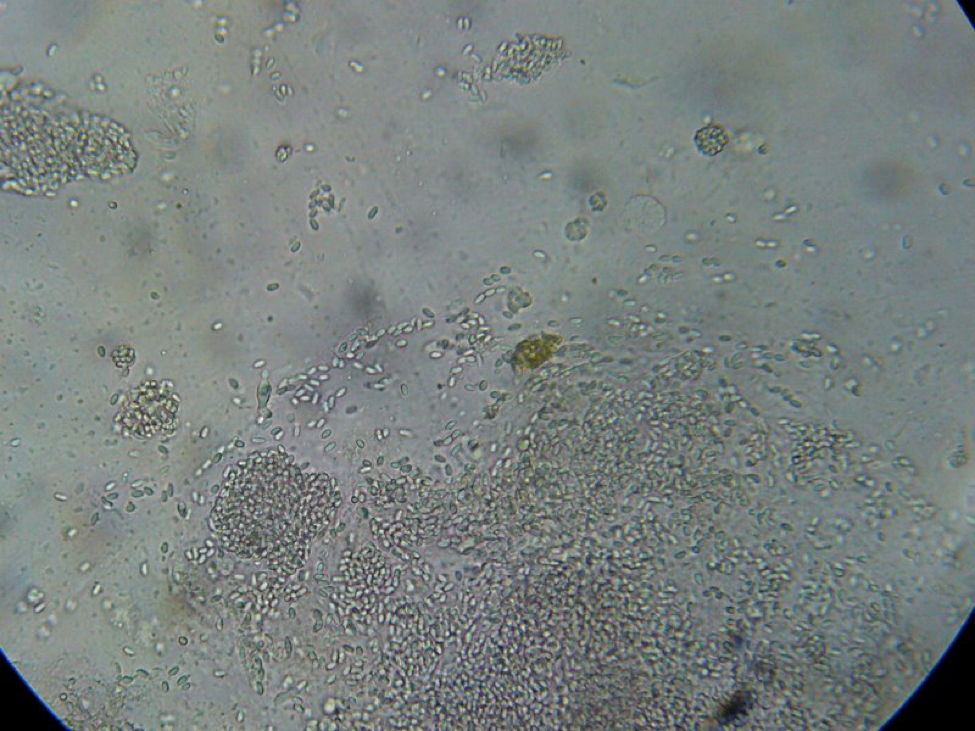
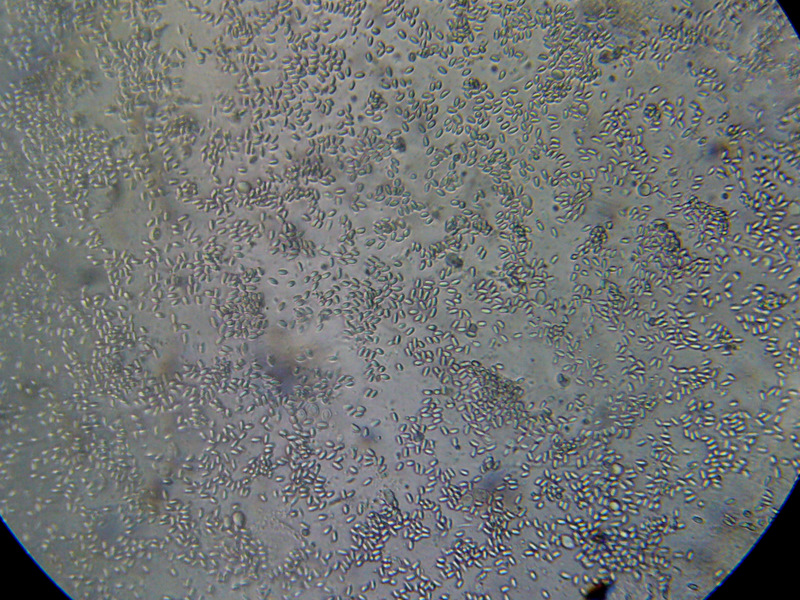
Figure 7. This is a view of the far left-hand squash from an older bee, whose gut does not contain pollen. Even though the preparation looked nearly clear to the naked eye, it is easy to see the degree of nosema infection.
Viewing individual bees gives you a much better idea of just how greatly the gut contents of bees vary from bee to bee within the same hive! Sometimes each of the 5 gut contents look completely different. All that I can say is that bees have a lot of different things going on in their guts, and numerous infections, most of which I can’t identify (Fig. 8).
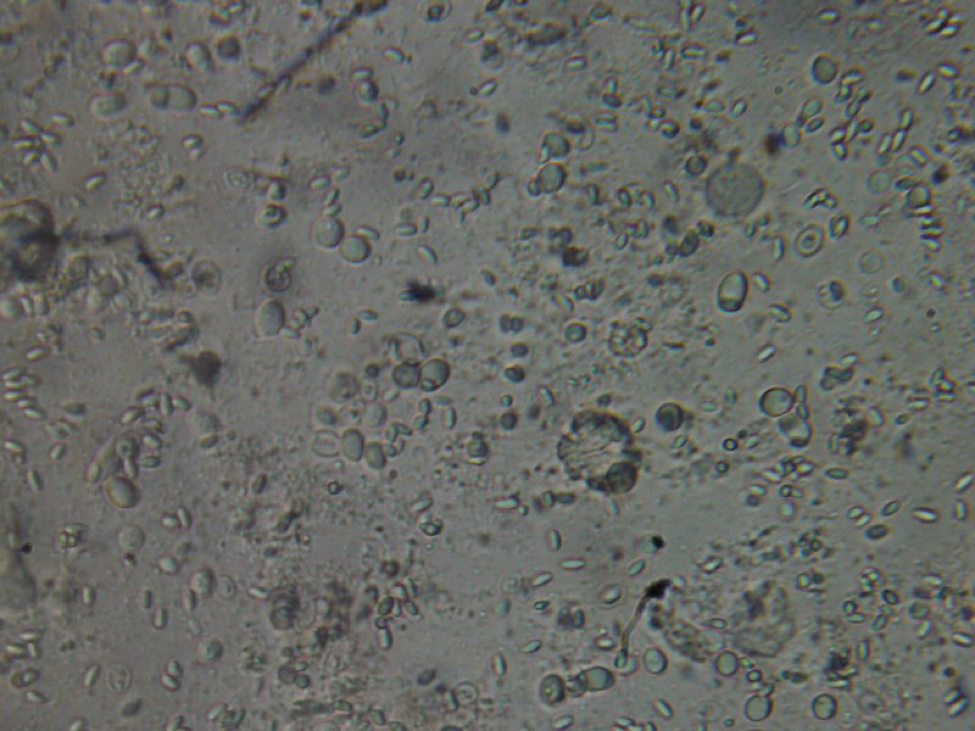
Figure 8. This poor bee is suffering from both Nosema ceranae and what appears to be a Malpighamoeba mellificae infection (the larger oval cysts). Amoeba infection is not something that most beekeepers even consider, but I find it commonly in failing hives.

–
I’m not a microbiologist, and have trouble differentiating yeast cells in the gut from amoeba cysts. Here’s a photo of beebread to which I added a weak sucrose solution, and allowed to ferment. I’m guessing that the cells between the pollen grains are yeasts. If anyone can help me, please let me know!
This method takes less time than a standard hemacytometer count, yet provides you far more useful information.
Economic analysis: A scope (which will last the rest of your life) costs less than the rental rate for two hives in almonds. You can easily run a dozen of these samples in an hour, which would give you a good idea of the infection rate for the weaker hives a 50-hive apiary. This method can quickly let you know if you have a serious nosema problem. On the other hand, bottle of fumagillin to unnecessarily treat those 50 hives would set you back $140, plus syrup and labor.
Update: time and again I’ve had beekeepers tell me that they’ve been trying to control dysentery by feeding fumagillin. When I ask them to send me bee samples, I often find that there is no nosema present, suggesting that they’ve been blaming the wrong suspect! As far as I can tell, nosema does not cause dysentery–this is a common misconception. Dysentery can spread nosema in the hive, but it doesn’t appear to be an indicator of nosema.
There is nothing new about knowing that measuring the infection rate is a better assessment of nosema infection than that of taking spore counts—Dr. White made that clear back in 1919, and it has been confirmed again and again. The problem has always been that it is simply too tedious to individually squash hundreds of bees (Dr. White individually squashed and microscopically viewed over 3000 bees). What has always been lacking is a time-efficient way to determine the infection rate, and that is what I tried to develop with this “Quick Squash” method. Shy of an automated device, this method may be the best practical assessment of colony infection rate, and appears to have a reasonable degree of accuracy.
Validation
OK, so this past week I took samples from the strongest hives and from dinks in some of my yards, and have so far processed a total of 40 samples (I still have a backlog at press time, and favored the samples from weak hives). I’ve graphed the results below (Fig. 9):
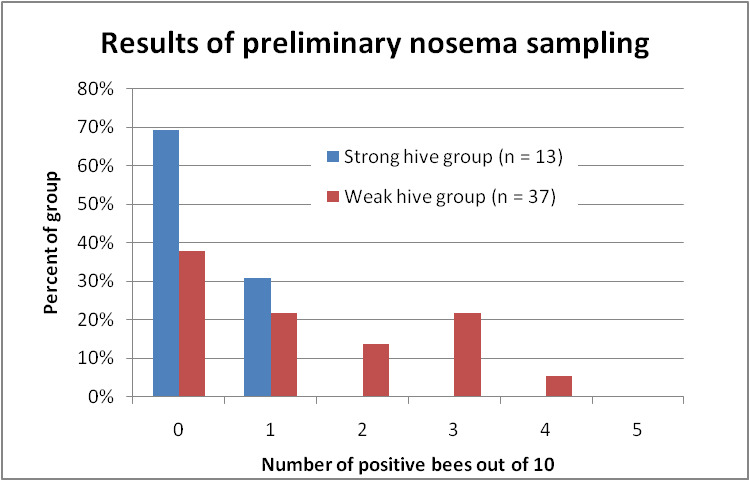
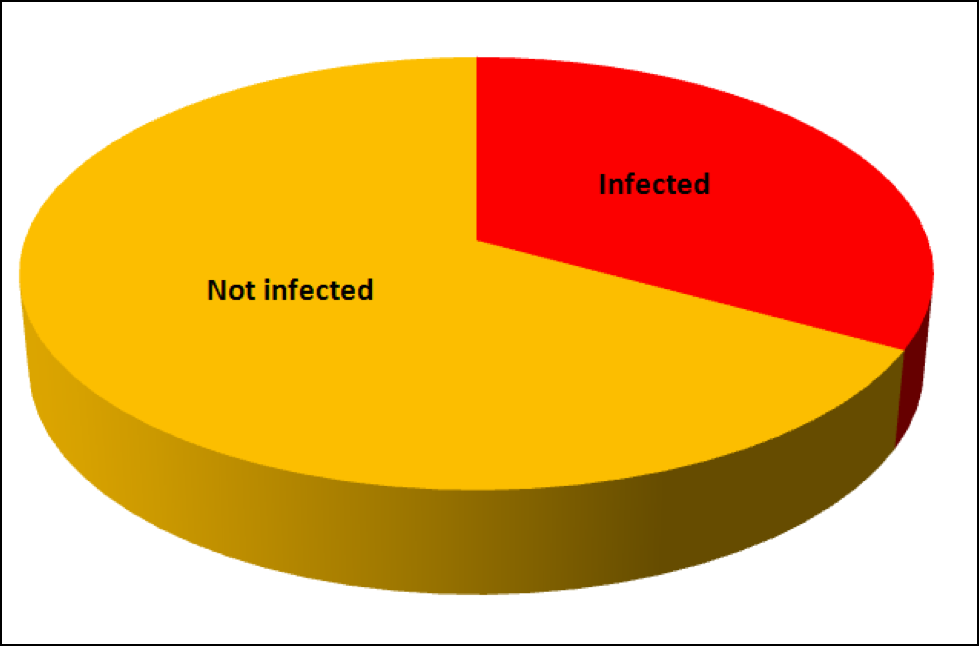
Figure 9. Distribution of nosema prevalence in the weakest and strongest hives in my apiaries in early December, based upon 10-bee samples taken from under the lid or outside combs. In none of the strong hives were more than 1 bee out of 10 infected; whereas the majority of the weak hives scored at least 1 or more infected bees out of 10, and 40% scored 2 or more positives.
The preliminary data above strongly suggest that Nosema ceranae infection is associated with colony weakness in my own operation, which is not surprising, based upon the vast body of previous research on the negative effects of nosema! At this point in time, I am rather disillusioned with any field research findings based upon spore counts, and hope that other researchers follow the lead of Dr. Mariano Higes and include the percentage of infected bees.
Practical application: The point of the above graph is that up ‘til this point, I have never been able to correlate N. ceranae infection intensity, based upon spore counts, with either colony health or production. But when I switched to a different assessment method—quantifying nosema prevalence based upon the number of infected bees in a sample of 10—the relationship jumps right out!
Summary (completely subject to revision):
Early spring and early fall are likely the most appropriate times to sample, or during winter if you’re going to almonds. No need to look for nosema in July or August, as it normally “disappears” during that time.
- Take samples any time of year from any colonies or yards that appear to not be performing well—lagging, poor weight gain, lack of foragers or bees over the brood. I’m not sure whether it’s worthwhile to routinely bother with taking nosema samples, provided that your colonies are not under stress, and so long as they are kicking butt.
- Brush a dozen bees from under the lid or an outside comb into a ziplock bag, and add a glug of rubbing alcohol (for long-term storage use bottles and additional alcohol, or freeze). If you wish to label the sample, make sure the marker is alcohol resistant, or write with a pencil and put the label inside the bag.
- (Alternate assessment) Process about 50 bees by the ziplock method (see Sick Bees Part 12). If you see fewer than about 5 spores in a field of view (about 1M equivalent), then you’ve got nothing to worry about. If more, go to the next step.
- From each sample, prepare two slides of 5 bees each per the “Quick Squash” method in this article.
- Interpret the entire 10-bee sample as follows:
- 0-1/10 positive for spores–likely safe
- 3/10–likely moderate infection
- 4/10–likely serious infection
- >4/10– very likely serious
- Be concerned any time that you hit 2 or more positive bees out of 5.
- The odds of hitting 3 or more bees out of 10 climbs rapidly with infection rate—to a definitive 95% chance once half the bees in the hive are infected!
- 6. I feel that it is likely not worth the effort to sample more than 10 bees from any single hive–10 bees should give you a fairly close estimate of infection prevalence in that hive. Better to spend the time sampling more hives!
- 7. Important: don’t base any management decisions upon only a single sample! Keep sampling until you are comfortable with the consistency of the results.
I realize that I just threw a lot of numbers at you, but in practice the method is really intuitive. It’s very much like playing poker—your brain easily grasps the probabilities of getting either one ace or four in a hand. Chances are that you’ll get more positive hits from colonies with a serious nosema infection, and few or no hits from healthy colonies.
Processing bee samples by this “Quick Squash” method offers an easy way for beekeepers to monitor whether nosema is actually a problem in their operations. It takes me less time to process a 10-bee sample than it does to do a single hemacytometer count, but the results of this method are much more meaningful from a practical standpoint. The “old school” researchers found this method to be a reliable assessment of the seriousness of nosema infection for N. apis; I suspect (subject to verification) that it may also prove to be the best for N. ceranae.
It sometimes seems that beekeepers need to reinvent the wheel. Anyway, I just came up with this quick method and really like it! My sons mastered the technique in a couple of tries. My favorite part is that I no longer need to count spores—a quick glance gives you a yes/no for infection. I’d be a happy guy if I never had to count another varroa mite or nosema spore—I’d much rather be counting all the money I’ll be making from my healthy hives!
I feel that it is time for a paradigm shift in the way that we assess the impact of nosema infection upon colonies—moving from spore counting back to determining the proportion of infected bees! To that end, this method is practical and surprisingly quick, and gives you a much better idea of what’s actually happening in the hive. I’d really appreciate hearing your results or suggestions for improvement if you try it (randy@randyoliver.com).
More Details—Web Version
I’m not looking to belabor the point of the reliability, or lack thereof, of spore counts, but I feel that this is an important enough issue to the beekeeping industry, in light of potential reduced honey production, increased colony mortality, and the cost of treatment, that interested beekeepers have a thorough understanding of the strong and weak points of various sampling methods.
The key question then is whether researchers, testing labs, and beekeepers can all agree upon a “standardized” method of testing, so that we can all compare results and recommendations. The current problem is that spore counts, even from the same colony, are frustratingly variable, depending upon the time of day at which the bee samples are taken (Fig. 1), the weather conditions, the place in the hive from which they are taken, the number of bees in the sample, how they are processed (mortar and pestle, filtration, squashing, etc.), how they are viewed (simple microscopy or hemacytometer), and even then counts are largely based upon the pure chance of whether or not one gets one or more highly-infected old bees in the sample!

Figure 1. Spore counts of four 25-bee samples taken each day from the same hive—from the entrance or the inside, and at either 9:30am or 12:30 pm. Note that counts on the same day varied from nearly zero to 10M spores—testament to the inherent variability of spore counts! It is also unlikely that the infection level varied as greatly from week to week as the data suggest. This finding really makes me question the comparability of spore counts unless they are taken at exactly the same time of day, under similar weather conditions, and from the same place in the hive each time! Data reworked from Meana (2010).
The colony sampled in Figure 1 was presumably moderately-infected, but in apparent good health. The researchers concluded, “This strong variation in the spore count was not associated with signs of illness and indeed, the colony was apparently as healthy (asymptomatic) as any other. It would thus appear that the spore count is not useful to measure the state of a colony’s health [emphasis mine].” I echo this conclusion (as do a number of other studies), since while monitoring nosema counts in my own operation over the past four years, I have been unable to detect any correlation between spore counts and colony health, productivity, nor survival.
The above authors conclude that “the mean proportion of infected bees may be a more reliable method to establish colony health.” This suggestion goes right back to Dr. White’s findings at the beginning of the last century, and has withstood the test of time. I guarantee that looking at the individual gut contents of a sample of 10 bees gives one a much better feeling as to the severity of nosema infection in that hive!
From Where Should We Take Samples?
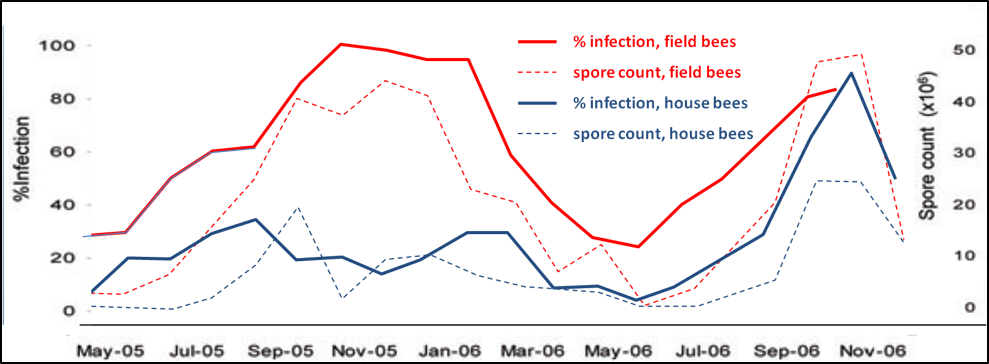
Figure 2. Spore counts vs. percent infection for house and field bees, n = 30 for each sample; all samples taken at 12:30pm. Data reworked from Higes (2008). Note that spore counts roughly reflect the percent infection rate for either group, but that spore counts of house bees may not be a particularly good indicator of the infection rate of field bees, which is likely the best assessment of the impact of nosema upon colony health. On the other hand, in this data set, the infection rates of both house and field bees roughly tracked each other. This data set suggests that spore counts of field bees is the most sensitive measure of the degree of nosema infection in a hive.
Experts’ Opinions
Smart and Sheppard (2011) concluded that: “Based on these findings, we speculate that bees collected from the inner hive cover represent a mixture of age classes of bees and, depending on the goals of the sampler, may provide a better estimate of the whole colony mean infection level than sampling just foragers.
So I asked Dr. Brian Johnson, who had considerable experience with tracking bees in observation hives. He told me:
“The bees just under the lid tend to be older middle age bees, while the bees on the outside combs are mostly middle age bees with smaller numbers of nurses and foragers. In general, the foragers are near the entrance, the nurses are in the brood zone, and the middle age bees are everywhere, but with a slight bias for the honey zone.”
I also asked the preeminent bee behavioralist, Dr. Tom Seeley. His response:
“Interesting question. The only information that I have regarding the age distribution of bees who are spending time just under the lid or on one of the outer combs (i.e., ones without brood) comes from a study that I did back in 1982. In it, I mapped out the locations (in a large observation hive) of various activities and at the same time I took data on the age distributions of the bees performing these tasks. These results make it clear that the middle-aged bees are mainly working in the peripheral (outside the brood nest) regions of the nest. So if bees are collected from these areas during the day, then they will be mainly middle-age and forager-age bees. At night, the percentage of forager-age bees will be higher. You’ve probably seen in observation hives how the foragers literally hang out in the edge areas of a hive at night.”
Finally, there is one more piece of supportive evidence for taking samples from under the lid: Moeller (1956) found that “nosema-infected bees congregate in and above warm brood areas.”
Conclusions
Hey, I’ll leave the conclusions up to you. Today, I did some spore counts of 20-bee samples of piles dead bees from the front of three hives in one yard. They had little nosema—about 5 spores per field of view, so approx. 1M/bee. So not enough spores to indicate that a 10-bee squash would be useful. Since the bees were dead, it would have entailed rehydration in order to do gut squashes.
I also did some Quick Squashes of bees from under the lid for other hives. Each method has its advantages and limitations. The smart beekeeper understands them!
Next Month
Nosema: The Smoldering Epidemic
Acknowledgements
I wish to thank my wife Stephanie for her patience, and helpful comments on my manuscripts (she chokes on math and graphs, and is immensely helpful to me for making my charts more user friendly). As always Peter Borst helped with the research for this article. A special thanks to Dr. Jose Villa, as mentioned previously. Thanks to Dr. Jerry Bromenshenk for his helpful suggestions. And a big thanks to Drs. Mariano Higes, Aránzazu Meana, and Raquel Martín-Hernández for their diligent work on nosema! For financial support toward this research, I’ve very appreciative of Joe Traynor, Heitkam’s Honey Bees, Jester Bee Company, the Virginia State Beekeepers Assoc, and individual beekeepers Paul Limbach, Chris Moore, and Keith Jarret.
References
Botías, C, et al (2011) Critical aspects of the Nosema spp. diagnostic sampling in honey bee (Apis mellifera L.) colonies. Parasitology Research (in press).
Fingler BG, WT Nash, and TI Szabo (1982) A comparison of two techniques for the measurement of nosema disease in honey bee colonies wintered in Alberta, Canada. ABJ 122(5):369-371.
Forsgren, E, and I Fries (2010) Comparative virulence of Nosema ceranae and Nosema apis in individual European honey bees. Veterinary Parasitology 170: 212–217.
Frazier, MT, et al (2000) A sequential sampling scheme for detecting infestation levels of tracheal mites (Heterostigmata: Tarsonemidae) in honey bee (Hymenoptera: Apidae) colonies. Journal of Economic Entomology 93(3):551-558.
Higes, M, et al (2008) How natural infection by Nosema ceranae causes honeybee colony collapse. Environ Microbiol 10: 2659–2669.
Mattila HR, and GW Otis (2007) Dwindling pollen resources trigger the transition to broodless populations of long-lived honeybees each autumn. Ecol Entomol 32:496–505.
Meana, A, et al (2010) The reliability of spore counts to diagnose Nosema ceranae infections in honey bees. Journal of Apicultural Research and Bee World 49(2): 212-214.
Moeller, F.E., 1956. The behavior of nosema infected bees affecting their position in the winter cluster. J. Econ. Entomol. 49 (6), 743–745.
Oliver, R (2008) The Nosema Twins Part 3: Sampling. ABJ 148(2): 149-154. https://scientificbeekeeping.com/the-nosema-twins-part-3-sampling/
Porrini, MP, et al (2011) Nosema ceranae development in Apis mellifera: influence of diet and infective inoculum. Journal of Apicultural Research 50(1): 35-41
Smart, MD and WS Sheppard (2011, in press) Nosema ceranae in age cohorts of the western honey bee (Apis mellifera). J. Invertebr. Pathol. doi:10.1016/j.jip.2011.09.009
Tomasko, M. Finley, J. Harkness, W. Rajotte, E. 1993. A sequential sampling scheme for detecting the presence of tracheal mite (Acarapis woodi) infestations in honey bee (Apis mellifera L.) colonies. Penn. State College of Agricultural Sciences, Agricultural Experiment Station Bulletin 871.
Traver, B., and RD Fell (2011a) Prevalence and infection intensity of Nosema in honey bee (Apis mellifera L.) colonies in Virginia. J Invertebr Pathol 107 (1):43-49.
Traver, BE MR Williams, and RD Fell (2011b; in press) Comparison of within hive sampling and seasonal activity of Nosema ceranae in honey bee colonies. Journal of Invertebrate Pathology.
White, GF (1919) Nosema-Disease. USDA Bulletin No. 780.
Tags: infection, n. apis, N. ceranae, nosema apis, Nosema cereanae, squash