


Understanding Colony Buildup and Decline – Part 1
Understanding Colony Buildup and Decline – Part 1
Randy Oliver
ScientificBeekeeping.com
First Published in ABJ in February 2015
CONTENTS
How Populations Grow
Measured Population Growth of Colonies
A Question on Methodology
A Case of Unfettered Egglaying
Acknowledgements
Citations and Footnotes
During my recent trial of the pollen subs, I was able to watch small colonies recover and rebuild the moment that natural pollen became available. But there are intrinsic limits to how rapidly a colony can grow. An understanding of the factors involved can help us to manage colonies most effectively.
At my last writing, I was freshly returned from an inspection of our five worst yards. We had left those yards thoroughly depressed, and I feared that we’d need to change our name to “Diminished Expectations Apiaries.” Luckily, after I sent the article off for publication, we checked the next 35 yards, which were in far better shape, leaving us in the state of being “guardedly optimistic” (my sons’ new favorite term).
There being no time to waste, we immediately hopped on mite management (a combination treatment of 25g of Apiguard plus a 7mL oxalic dribble [1]). The next question was whether we would be able to fill our almond contracts. After nearly 35 years of pollinating almonds, I’ve come to the conclusion that a realistic “lift the box and grade from the bottom” assessment of colony condition is a much better predictor of what I should promise my growers than the (perhaps buttered rum influenced) imaginative hive counts proffered by some beekeepers in December (which so often disappointingly evaporate come February).
Our situation was that we had a bunch of 3- to 6-framers in mid December. The question was whether we could realistically turn them around with stimulative feeding to make grade in almonds. I really didn’t know, since we don’t normally waste time on dinks (taking our winter losses in fall). It occurred to me that I had a data set on hand that should answer that question—from the previous winter’s trial of pollen subs [2]. So I graphed it out (Fig. 1):
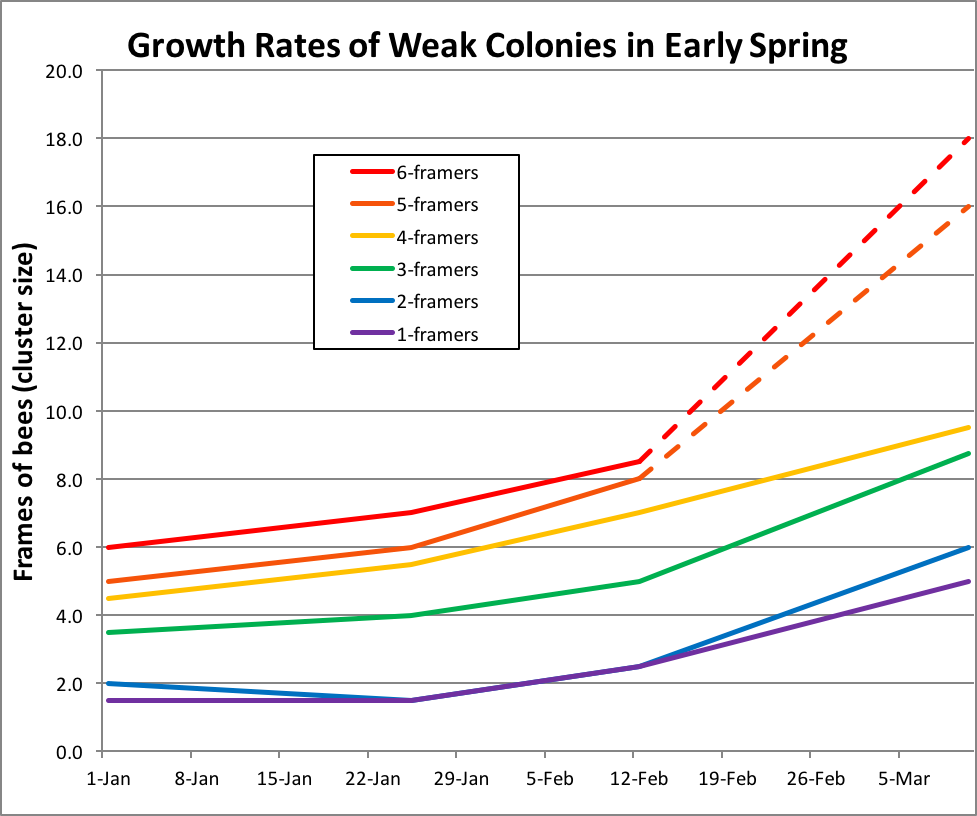
Figure 1. Median values for each group of colonies by starting frame strength; data only for colonies that did not go downhill between Jan and Feb. The dotted lines are strength guesstimates for the colonies that went to almonds, but were not individually graded when later we split them in March and April.
Practical application: these colonies were all fed ad libitum with sugar and pollen subs during the winter. Only those at or above 4-frame strength on Jan 1 could be expected to make 6-frame strength by the beginning of almond bloom.
I’m not clear why the 4-framers during this time did not grow as well as the smaller colonies, but it was likely a fluke. But what surprised me was that the growth rates (the slopes of the plots) from January 25 through February 12 were nearly identical for colonies over the entire range of starting strengths. How could this be? I’d always assumed that colonies grew exponentially–the larger the cluster, the faster they’d grow.
The data above suggest that very weak colonies lose strength between Jan 1 and Jan 25, but that after that point they built just as fast as the stronger colonies. That just didn’t make sense to me! And I had a practical reason for trying to understand what was happening:
Practical question: should I boost the dinks with frames of bees from my strong colonies now, or would I be better off leaving those strong colonies to build up (presumably more rapidly) and steal from them later?
Trying to find an answer to a simple question about beekeeping often shows me how little I actually know. Cursed by curiosity, this then leads me to spending days of reviewing literature, correspondence with other beekeepers and researchers, doing calculations and creating spreadsheets, and sometimes performing field experiments myself in order to find the answer(s).
In this case I realize that I didn’t really understand why colonies grow and shrink as they do. In the rest of this article, I’ll share what I’ve learned.
How Populations Grow
Biological growth curves are typically exponential—the larger the population (or the developmental stage of a single organism), the faster it grows (think of varroa or other rapidly-growing pest populations, such as the number of humans on Earth). This is called exponential growth, in which the population seems to expand slowly at first, and then increase explosively. In the real world, such unfettered growth is eventually reined in by limiting factors such as running out of food or habitat, disease or predation, or by reaching the maximum body size of the organism. Growth eventually approaches a maximum value (the asymptote). The result is that the growth of any individual plant, animal, or entire population typically follows a “sigmoid” (“S”-shaped) growth curve. Since the general shape of colony population growth also follows a generally sigmoid curve for the first half of the season, I had erroneously assumed that colonies grew exponentially. In fact, this isn’t the case at all, which became obvious when I looked carefully at data tediously collected in past years by some dedicated researchers.
A few diligent researchers [3] have taken copious measurements of the amount of sealed brood in colonies over time. From those, by using estimated survival curves for the emerged bees, they could estimate the total population of the colonies. Let’s first take a look at an example from one of the earliest, and well-cited, data sets:
Measured Population Growth of Colonies
I’ve gone over the classic study by Nolan (done in 1926 and ’27) with a fine-toothed comb (he performed the study during the early establishment of the package bee industry in order to determine the optimal size package to use). I’ve included one of his figures below (Fig. 1).
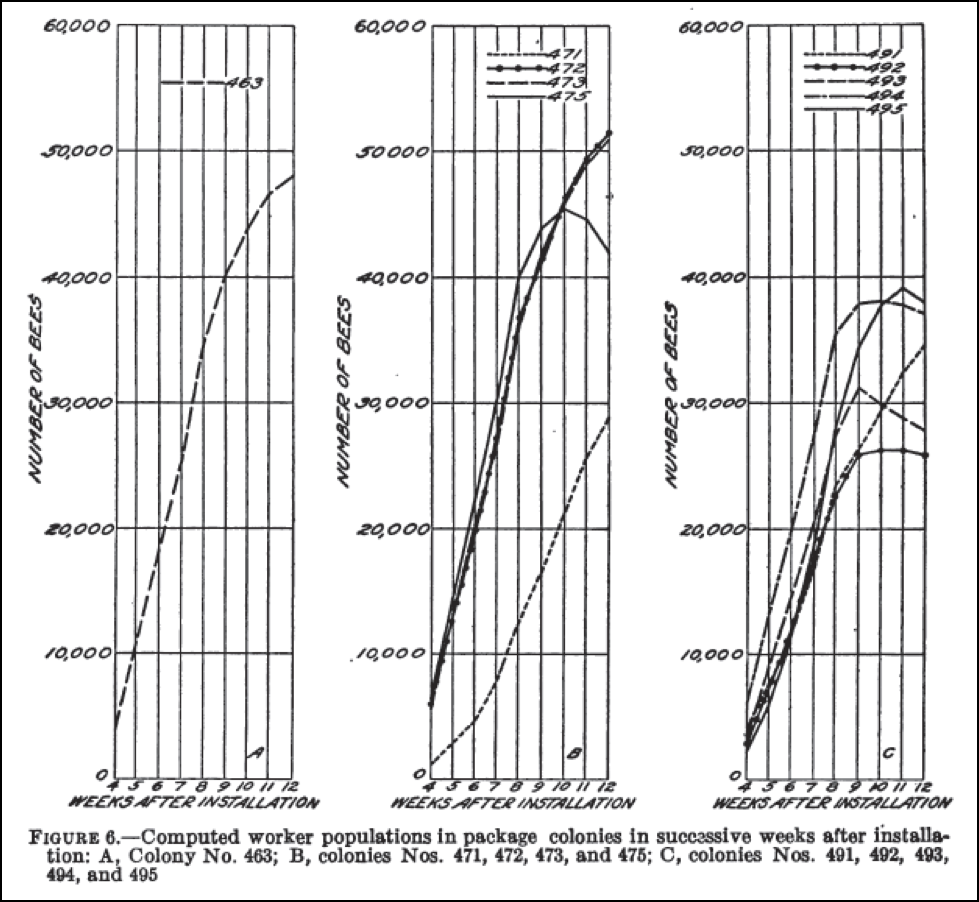
Figure 1. Plots of growth of colonies started from packages in Maryland. The three groups were started May 11, May 13-21, and May 28-June 2, respectively. Note that all colonies peaked in mid July no matter the starting date. Also note that population growth was linear for most of the buildup. Colony #463 (far left) increased between weeks 4 and 9 at the calculated rate of 1044 bees per day.
The most striking thing to me about these plots is the remarkably fast growth of these package colonies [4] (which I’ll return to in a bit). The other thing that catches my eye is that, in every case, the growth is absolutely linear for about a 5-week period. What happened to exponential? Although Nolan started his colonies in a warming spring, there was little difference in the rate of growth (the slopes of the straight portions of the curves) from colony to colony despite starting size or date of installation. Another surprising observation was that at 8, 10, or 12 weeks after installation, there was no particular trend in difference in colony populations, no matter whether they were started with anywhere from a pound of bees to 5½ lbs! [5]. Go figure.
Of greatest interest to me is that all healthy colonies appear to grow at nearly exactly the same rate once they get into the linear portion of the growth curve, no matter what the colony size. And it’s not just Nolan’s data; other data sets show the same.
A Question on Methodology
It’s important to keep in mind that Nolan determined calculated estimates of colony populations, based upon the assumption that emerging bees lived for an average of 35 days. I take such figures based upon assumptions with a grain of salt, unless they’ve been validated by actual field measurement. His colony population estimates are figured forward from measuring the amount of sealed brood at 12-day intervals, rather than by actually counting bees or frames covered with bees. Luckily, some other researchers have gone to that effort–they would validate their calculations by counting or weighing all the bees in the hives at various time points), I’ve checked and their hard-earned counts of bees appear to validate the calculated values [6]. So let’s compare the calculated growth rates from a wide range of studies, including some of my own (Fig. 2).
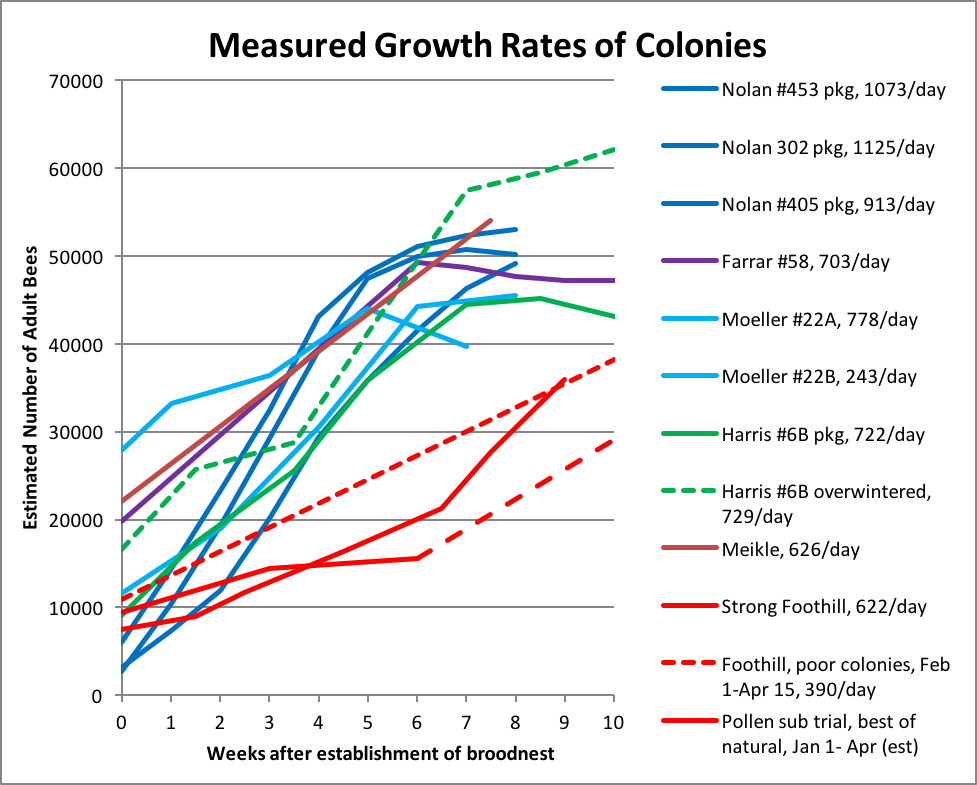
I’d recently heard Dr. William Meikle from the Tucson Bee Lab mention that he had collected data on colony size by shaking all the bees from the hives and weighing them, so for a reality check I asked him for his data; one of his colonies on a mesquite flow grew at 626 bees per day (the brown line above).
The data for the red lines come from my own colonies, calculated from frame strengths; the dashed portions are based upon estimates. The solid red line is derived from the mean of 21 intentionally-chosen poor colonies, growing (on average) from 6 to 21 frames of bees, over the period of Feb 1 through April 15 (including going to almonds).
I spent a lot of time working up the above graph, and found that the clearest way to compare data sets was to convert the slopes to net bee gain per day, which I put in parentheses. The linear slopes of growth are remarkably similar for colonies from different decades, and under varied conditions and times of year, suggesting that a gain of about 700-750 bees per day is about the best you can hope for.
Practical application: at 700 bees/day, a the cluster size will grow at a rate of a little better than 2 ½ frames of bees per week.
Still, the fact that Nolan’s best colonies outshone mine (at gains of up to 1125 bees/day) bugged me. How the heck could a colony, when most studies find that queens lay at a sustained rate of only about 1000 eggs per day, ever gain over a thousand bees per day? I’ll return to the limitations on queen laying capacity in a later part of this article, but for now, I’ll give you a teaser—Nolan was dealing with package bees on drawn combs, and providing ample space for unfettered broodnest expansion. I’ve done something similar…
A Case of Unfettered Egglaying
Here in California I can purchase bulk shook bees after almonds, and occasionally find them useful. A couple of springs ago, we were driving home from delivering an order of frames of bees and brood, and had 50 caged year-old queens in full laying condition on the truck seat. There was a honey flow on, and 10 days of clear weather ahead. So I called my buddy Keith Jarrett and asked him to deliver 500 lbs of bulk bees the next day (my sons thought that I was crazy). The following morning we set up 50 double deeps of drawn comb, stuck a queen in each, and dumped 10 lbs of bulk bees in front of each hive (Figs. 3 and 4).
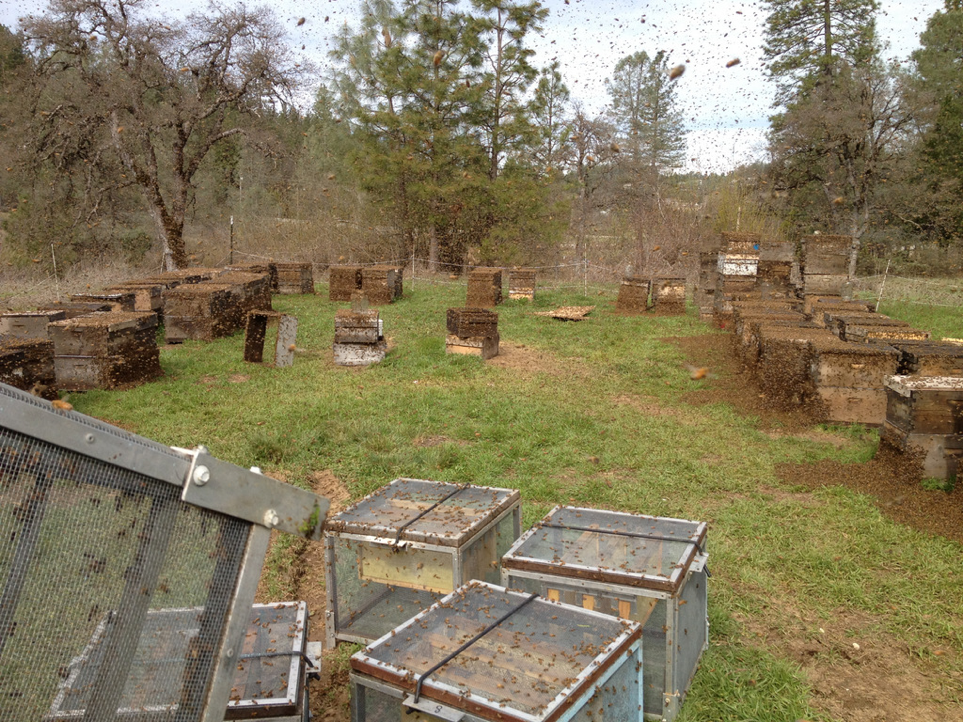 Fig. 3. Some of the hives shortly after dumping 10 lbs of bulk bees in front of each. That’s enough bees to cover all 20 frames of drawn comb in each hive. Most all the queens were accepted and recommenced laying immediately.
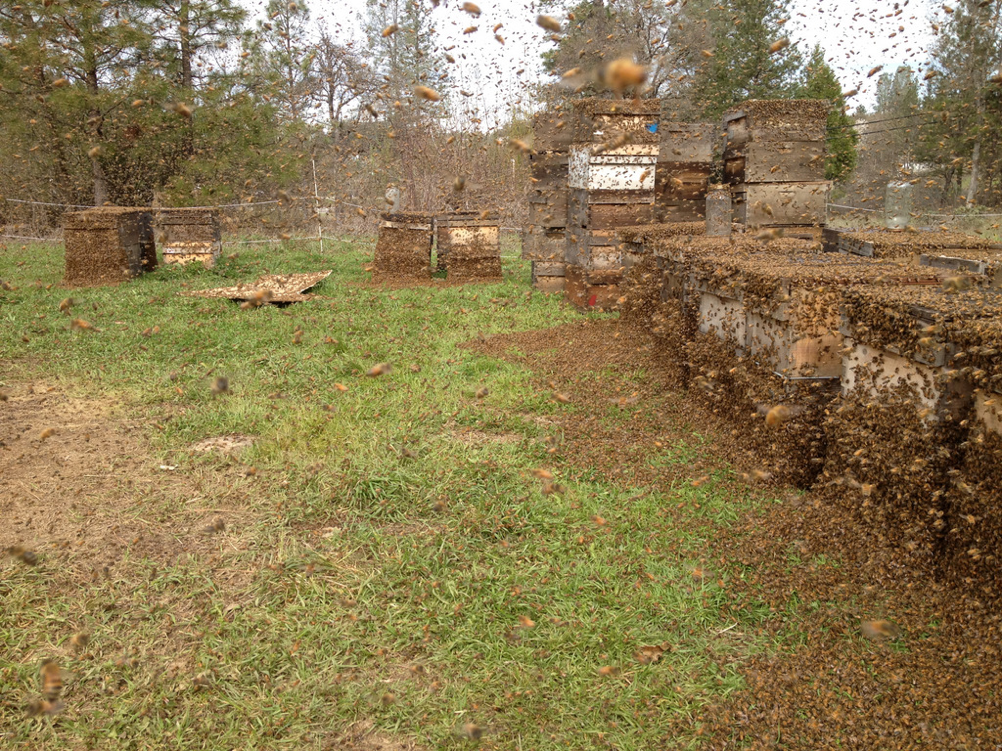 Figure 4. A closer view. We returned in late afternoon to brush off any clusters gathered outside of hives, and swapped the second boxes (above excluders) to balance the populations.
Before any brood reached maturity, many of the colonies had put on about 40 lbs of honey, and contained up to 8 frames at least partially covered with brood (which we then sold as nucs in order to easily pay for the bulk bees). This suggests that many of the queens, under ideal unrestricted conditions, were laying at least 2000 eggs a day.
Practical application: if you’ve never tried starting colonies with 10-lb packages, it’s pretty amazing. I’ve done this several times over the years.
Anyway, the above observation also helps to explain why package bees dumped into hives of drawn comb can build up so quickly in the North. Let me wrap this segment with some remarkable observations by Nolan on the growth of smaller package colonies back in the day:
For instance, among some exceptional examples, it was reported that 1-pound packages in Ontario in 1916 built up sufficiently to gather an average of 100 pounds of surplus honey in one season. In the sweetclover [sic] region of the North a 290-pound crop was reported as the 1924 total from a 2-pound package installed in North Dakota on May 22 of that year. This particular region is marked by high colony yields because natural conditions make possible both exceptionally high daily gains and an exceedingly long period during which nectar is available. Sweetclover may bloom for about three months in North Dakota. A 3-pound package received in that State on June 5, 1922, was reported to have gathered a honey crop of 485 pounds before the end of the same season.
Yeah, the Dakotas used to be pretty good, huh? Nolan continues:
The points just discussed are of special interest and importance since, coupled with the fact that none of the packages studied for 10 or more weeks reached its maximum population before the ninth week, they would seem to indicate that packages should be installed at least eight to nine weeks in advance of the main honey low if they are expected not only to replace themselves but also to reach approximately their maximum strength before the nectar flow is on.
Practical application: Nolan’s data also suggest that it takes a small cluster of bees about 8 weeks to reach 8-frame strength (in relatively warm spring weather).
I’ve run out of room for now, but I’ve only just begun on this subject!
Acknowledgements
I’m especially appreciative to Lloyd Harris, who collected one of the best data sets on colony population development ever, and to me appears to be the most knowledgeable researcher on bee population dynamics. Lloyd generously provided me with much information, and has helped me with this article. I also wish to thank ARS researcher William Meikle, who provided me with unpublished data, and offered helpful suggestions to the manuscript.
Of course I cannot forget my comrade in research Peter Borst, and also wish to thank the donors to ScientificBeekeeping.com, who allow me to spend the (unbelievable amount of) time necessary in writing these articles.
Citations and Footnotes
[1] We used a heavy application of the 3.2% formula at https://scientificbeekeeping.com/oxalic-acid-treatment-table/ and ~20 g of Apiguard; the colonies tolerated this treatment well.
[2] https://scientificbeekeeping.com/a-comparative-test-of-the-pollen-sub/
[3] Nolan, WJ (1932) The development of package-bee colonies. USDA Technical Bulletin No. 309. Available online from Google Books.
Moeller, FE (1952)The effect of stock lines upon the honeybee population-production relationship. Thesis (Ph. D.)–University of Wisconsin—Madison
Harris, JL (1980 A population model and its application to the study of honey bee colonies. MS Thesis, Univ of Manitoba. http://mspace.lib.umanitoba.ca/bitstream/1993/14743/1/Harris_A_population.pdf
[4] See my comparison of the growth rate of honey bee colonies to that of today’s broiler chickens at https://scientificbeekeeping.com/sick-bees-part-17-nosema-the-smoldering-epidemic/
[5] See his Table 10.
[6] Some cyanided colonies and counted or weighed the bees. Lloyd Harris, needing to appease his advisor, “killed 43 colonies and counted them bee by bee. All 1.6 million of them.” Others weigh the hive before the bees start flying, then shake all the bees from the combs, and weigh the hive again. Either process, as you can imagine, is tedious.
[7] I arrived at rough estimates of my populations by counting the number of frame interstices filled with bees, and then multiplying that number by 1820 (the approx. number of bees on a covered frame, as determined by a large data set of computer-generated counts vs. our visual gradings).