
A Comparative Trial of the Pollen Subs: Part 5– Revisiting de Groot

January 10, 2022
Understanding what De Groot did
The problem with normalizing to tryptophan
Re-interpreting de groot’s findings
Protein conversion — Patty into bees
Justus von Liebig’s Law of the Minimum and essential amino acids
So how about the tested diets?
A COMPARATIVE TRIAL OF THE POLLEN SUBS
Part 5: Revisiting de Groot
Beekeeper-Funded Research
Randy Olivera and Vincent Riciglianob
aScientificBeekeeping.com, bUSDA ARS
First published in ABJ November 2021
Any apicultural paper that mentions the amino acid requirements of honey bees references the monumental landmark study by Antonius de Groot published in 1953. But that was early in our scientific understanding of animal nutrition and artificial diets. I have nothing but admiration of de Groot’s work, especially since he was quite clear about the limitations, shortcomings, and interpretation of his pioneering study. However, I feel that it’s perhaps time to reinterpret his findings.
DIVING INTO DE GROOT
De Groot was a brilliant, meticulous, and dedicated researcher, whose monumental work [[1]] is astounding and impressive. I have no criticism whatsoever of any part of his 80-page paper, because as you’ll see, he was very cautious about drawing hard conclusions from what he understood to be pioneering research. The first five chapters of his paper cover the state of knowledge at that time about honey bee and insect nutrition, in which he states that “the knowledge regarding the amino acid requirements of insects is still only fragmentary.”
He reviewed previous research indicating that expeller-processed soybean flour, brewer’s yeast, cow’s milk, and chicken egg were useful components in artificial diets for honey bees. He spent a great deal of time comparing various experimental methods that could be used to determine the nutritional adequacy of a diet, such as the development of the hypopharyngeal glands or longevity of adult caged bees. However, as he explains, “testing for longevity doesn’t tell us the nutrition that bees require to grow from egg to adult.” Ideally, one would study the nutritional requirements for growing larvae through to pupation, but unfortunately, no one had yet figured out a method for growing them on artificial diets.
So de Groot settled upon “studying the growth of just emerged bees on different diets with the aid of weight and nitrogen determinations,” following the findings of Haydak in 1934 (Figure 1).
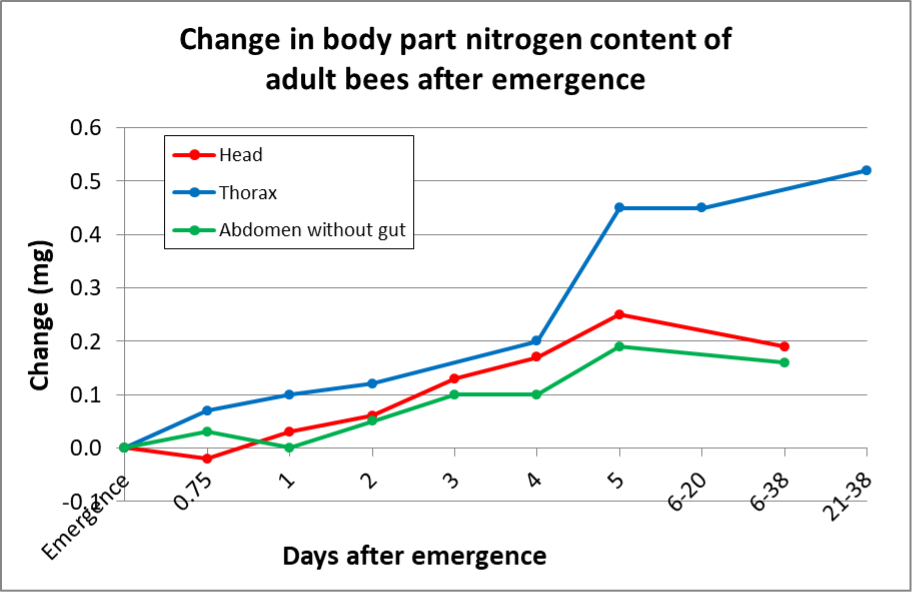
Fig. 1 Newly-emerged worker bees loose in a colony begin consuming some pollen shortly after emergence, and then eat ravenously after around 40 hours [[2]]. During this time they add proteinaceous tissue to their bodies (as measured by nitrogen content) for a few more days, gaining roughly an additional third of nitrogen content over that at emergence. Data plotted from Haydak [[3]].
The above weight gains are largely due to the development of the hypopharyngeal (brood food) glands in the head, the fat bodies in the abdomen, and finally the development of the wing muscles in the thorax.
Practical application: This prodigious rate of tissue growth in the emerged adult worker requires good conversion of the protein from a highly-nutritious diet.
De Groot’s preliminary research indicated that a combination of casein (milk protein) and sucrose alone supplied an adequate diet for worker post-emergence development. This is rather surprising since he didn’t find a need for lipids, sterols, vitamins or minerals in his experimental diets, presumably because the workers emerged with enough body reserves of those nutrients for further development on a diet consisting solely of mixtures of pure amino acids (replicating those in casein) and sucrose.
Practical application: This raises the question of whether testing diets on newly-emerged workers is actually the best test of an artificial diet, since those workers already contain reserves of essential nutrients that they can get by without for some time. I’ll later return to this subject of how we should be testing diets designed to promote colony growth as a whole, rather than only adult bee weight gain.
It isn’t until page 65 that de Groot begins the tests to determine the “Quantitative Amino Acid Requirements” ratios for the growth of newly-emerged workers. With that goal in mind, de Groot measured the changes in dry weight and nitrogen content (as proxy for protein content) of caged newly-emerged worker bees then fed controlled diets. Although they grew best on a diet of natural pollen, they grew nearly as well on diets of “vitamin-free” casein (milk protein). Surprisingly, the biological value (the percent of nitrogen in the diet that was retained in the bees’ body tissue) was greater for the artificial diets than for natural pollen.
Practical application: Although de Groot’s findings were for caged bees and an unnamed pollen, the bees needed to consume far more protein in the form of pollen to obtain the same amount of growth as when the protein or amino acids were provided in pure form. So although pollen is the natural source of nutrition for bees, the protein in an artificial diet may be more efficiently digested and/or utilized.
Then de Groot shifted to using acid-hydrolyzed casein (milk protein) as an amino acid source, and since tryptophan is destroyed during hydrolysis, discovered that it was an indispensable amino acid. From this point on, he fed his test bees diets of sucrose and mixtures of amino acids, in order to determine which amino acids, if lacking, would prevent growth, and then, in a series of meticulous experiments, the minimum amount of that EAA that needed to be added back to allow for “normal” growth.
UNDERSTANDING WHAT DE GROOT DID
De Groot was now ready to move on to determining exactly how much of each individual EAA was required in a diet. He painstakingly measured the increases in dry weight and body protein of samples of caged newly-emerged worker bees fed standardized artificial diets of amino acids (based upon casein), each formulated with up to nine different concentrations of the single amino acid to be tested. To do this, after feeding, he tediously dissected out the alimentary track from the bees in each sample in order to remove any gut contents, dried the remaining bee carcasses, weighed them, and then ran chemical nitrogen analyses. And he did this for a minimum of 8 replicates of 5 bees per test, for all 10 EAAs — nearly 400 tedious tests and analyses in all.
I graphed his data for isoleucine to illustrate how he interpreted his results (Figure 2).
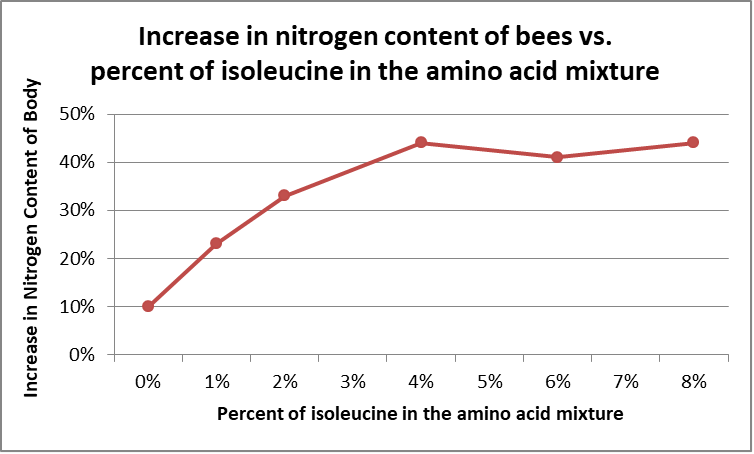
Fig. 2 This graph shows the increase in bee body nitrogen from feeding a diet of sugar supplemented with a mixture of 18 amino acids at 3% of the weight of the sugar, with the proportion of isoleucine (relative to the total amount of amino acids) ranging from zero to 8%. Note the inflection point in the curve at 4% on the x-axis, indicating that there was no benefit to increasing the proportion of isoleucine to above 4% of the total amino acid mixture.
De Groot then plotted graphs for all 10 EAAs (Figure 3):
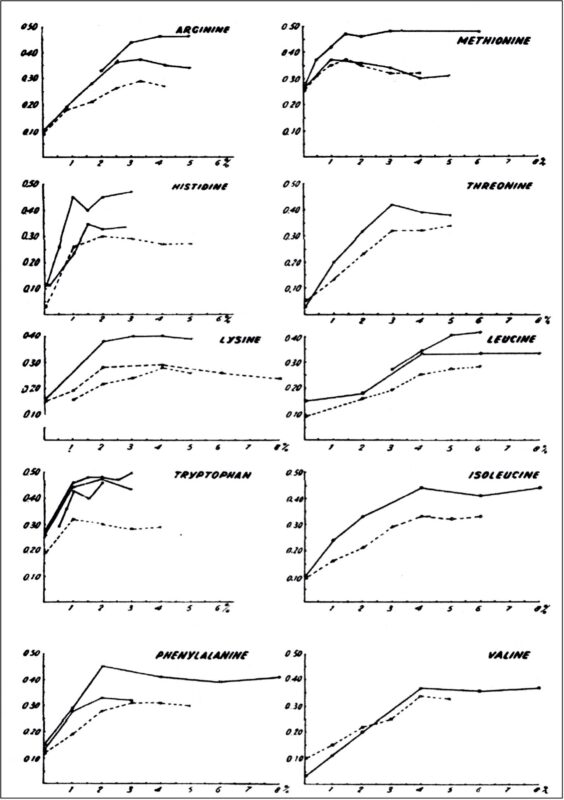
Fig. 3 The principal and most-cited finding from de Groot’s research come from the above chart, with the y-axis indicating nitrogen content, and the x-axis showing the proportion of that amino acid relative to the total. The two lines indicate feeding at either of two amino acid-to-sugar proportions — 2% (dotted) or 3% (solid). De Groot explained, “Each curve shows a rise with increasing concentration until a further increase is no longer accompanied by an upward trend of the curve. In the latter region the concentration is above its minimal level for maximal growth. Obviously, this minimal level is situated near the angle of the graphs.” Source [[1]].
Practical application: The reason that I included the figure above is that these curves are the basis for de Groot’s widely-cited amino acid proportions, the point being that those “hard” numbers were based upon his eyeball interpretation of rather crude data plots.
But those minimal levels also came with an important disclaimer. Allow me to again quote de Groot directly:
It may be emphasized, however, that the observed minimal concentrations for maximal growth have nothing to do with the minimal required intake for maximal growth under natural conditions. They only represent the minimal amounts which, in combination with the amounts of the other amino acids, induce a growth rate maximal under the conditions of these experiments. Even though we are not justified in attaching absolute value to these minimal concentrations, they are valuable in combination with each other. From the minimal concentrations supporting maximal growth, an approximation of a proportionality pattern of essential amino acids can be deduced, supplying information regarding the relative quantities which are required for protein synthesis [boldface mine].
Practical application: De Groot was very clear that his findings should not be taken as gospel, but rather as suggested guidance. And he makes very clear that the oft-cited “minimal level required in honeybee” in his Table 25 [[4]], is not for determining the optimal percentage in a formulated diet, but rather to pay attention to the proportions of the EAAs relative to each other.
But one must keep in mind that in his studies, those levels were estimated from very rough weight gain and body nitrogen content curves of adult bees fed a 2 or 3% (relative to sugar) highly artificial mixture of 18 essential and nonessential amino acids “approximating the composition of casein.” But what is often overlooked is that de Groot himself was clear that bee growth was suboptimal on this diet:
However, it may be noted, that as a result of the concentration of the nitrogen compounds in the diets employed, growth was suboptimal. Whether the same applies to conditions enabling a higher growth rate remains to be investigated. Therefore, we are justified in concluding only, that under the conditions concerned, a ration containing 18 amino acids supported a growth rate equal to that obtained with a comparable amount of casein.
And in fact, bees grew slightly better on an “isonitrogenous” diet of natural pollen. De Groot’s observation that adult bee growth was suboptimal on his experimental diets must be kept in mind. The protein-to-carbohydrate ratio at the highest tested concentration was 3% (1:33). Altaye [[5]], allowing bees to balance their own protein-to-carbohydrate ratio found that bees targeted a 1:12 ratio when the provided protein source was casein. De Groot’s test diets were clearly protein limited.
De Groot also made clear that:
Under the conditions of the above described experiments, the rate of growth is relatively slow as compared with that observed under natural conditions.
He explains that he used the low concentrations of amino acids relative to sugar in order to avoid the toxic effects of protein overload observed in longevity experiments. He also notes that some of the non-essential amino acids may exert stimulatory effects under conditions of “normal” growth — notably serine, glycine, and proline.
Practical application: It is more important to pay attention to de Groot’s proportionality relationships for the EAAs rather than to the absolute values for each EAAs percentage of the total protein as listed in his Table 25.
THE PROBLEM WITH NORMALIZING TO TRYPTOPHAN
Early in his research, de Groot kept having tryptophan come on his radar, mainly because it is destroyed by acid hydrolysis of a protein into its constituent amino acids, and thus needed to be added back in experimental diets. Tryptophan is mentioned 75 times in his study, and by mention 47 he’d already put it at the top of his list of EAAs. So when tryptophan happened to come in at the 1% level, de Groot used that value as “unity” to compare all the other EAA minimal levels to.
Practical application: That arbitrary decision by de Groot to use tryptophan as the reference EAA was unfortunate because the quantification of tryptophan is more difficult than for the other amino acids (since it is destroyed during acid hydrolysis). Therefore, many published amino acid profiles for natural pollens [[6]] and feedstuffs lack a value for tryptophan. But even more importantly, tryptophan is not the major EAA required in bee diets.
We’ve learned a bit about animal nutrition since 1953. So let’s back up a bit.
RE-INTERPRETING DE GROOT’S FINDINGS
Is there a better EAA to use for reference instead of tryptophan? I suggest that we back up 15 pages in his paper. In his preliminary research, De Groot had prepared 17 diets, each deficient in one amino acid, to see how well newly-emerged bees gained weight (Figure 4) or increased nitrogen content (not shown).
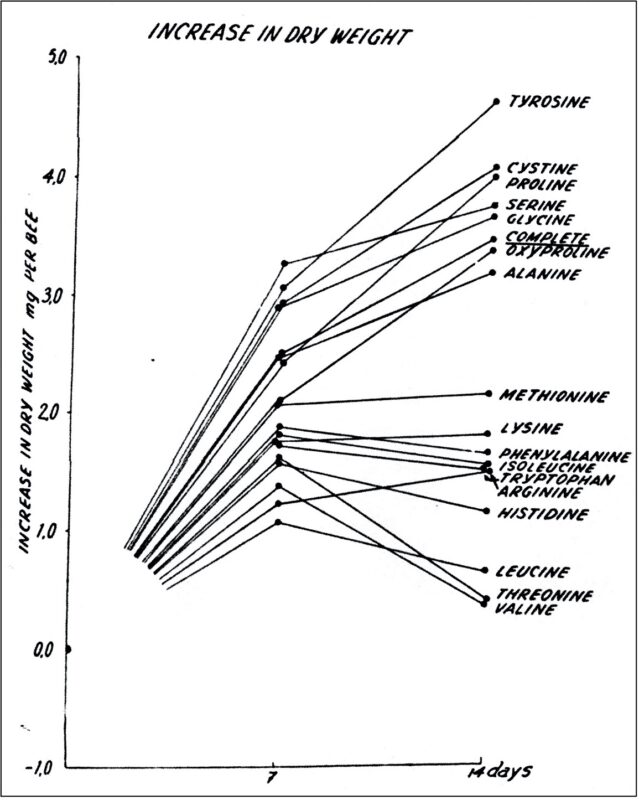
Fig 4 This graph of bee weight in response to amino acid deficiencies is how de Groot determined which amino acids were “essential.” Note how bees grew “normally” in the upper group, on diets lacking any of the non-essential amino acids (“complete” contained all 17), but ceased gaining weight in the lower group, due to those diets lacking one of the ten “indispensable” or “essential” amino acids. Source [[1]].
Practical application: The key take-home from the graph and information above is that bees can grow pretty well for the first week of their lives even with a deficiency of one EAA, but in the second week a deficiency in the most critical amino acids becomes apparent. Note the critical importance of valine, threonine, and leucine (noticing this was my aha moment). Since leucine is the EAA required in greatest proportion in a honey bee diet (and the EAA in highest proportion in all the pollen subs that I tested other than Homebrew), it occurred to me that perhaps we should use leucine, instead of tryptophan, as the reference EAA when analyzing diets for EAA balance (Figure 5).
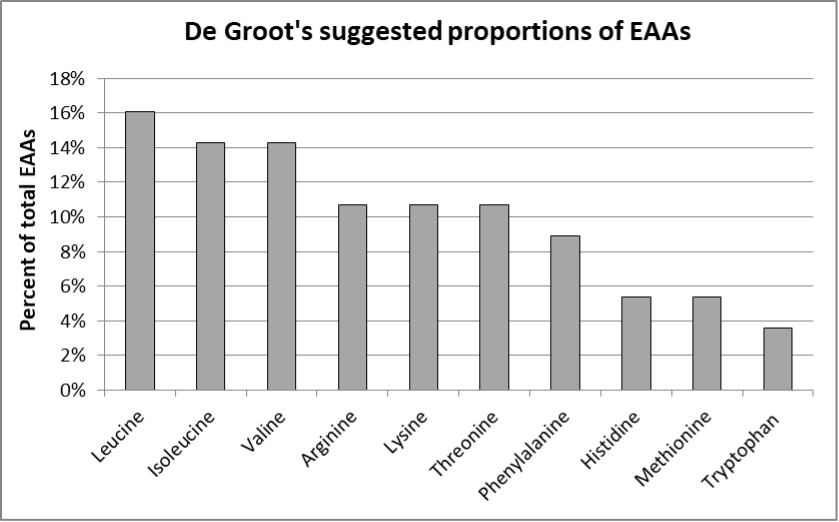
Fig. 5 Leucine is the predominant EAA required for honey bee growth, and thus determines the proportion of total protein that gets utilized. Since it is also the predominant EAA in most feedstuffs used in pollen subs, I propose that it should be the EAA to which we compare the amounts of the other EAAs in order to determine EAA deficiencies.
De Groot’s research suggested that leucine should constitute 16% of total EAAs. Of interest is that of the diets that I tested, the top performers were those that were closest to that percentage (Figure 6).
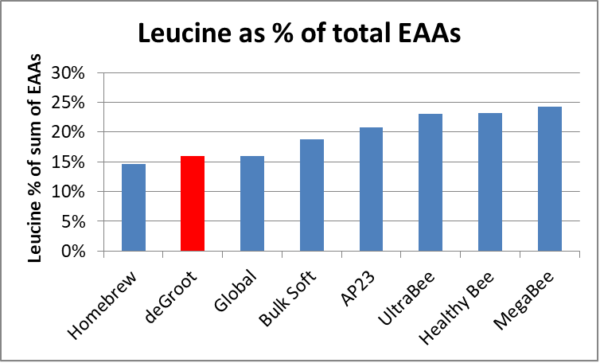
Fig. 6 Is it just by chance that the performance ranking of the tested subs almost exactly followed how close their leucine percentage was to de Groot’s recommendation? Did the poorer-performing diets contained an excessof leucine, or were they instead deficient in the other EAAs?
Practical application: Refer back to Figure 4 to see how important the predominant EAA, leucine, was for bee weight gain. So perhaps what we should be focusing upon is a diet’s ability at converting leucine into bee body mass.
PROTEIN CONVERSION — PATTY INTO BEES
Nutritionists often calculate a diet’s Protein Efficiency Ratio (PER) — the gain in body mass of the fed animal, divided by the amount of protein in the test diet. I didn’t weigh the bee cluster in every hive, nor did most colonies grow in strength during the first half of the trial, but based upon the amount of patties consumed, their protein contents, and the change in cluster size, I could very roughly calculate approximate figures for the efficiency in protein conversion for each test diet to cluster size (Figure 7).
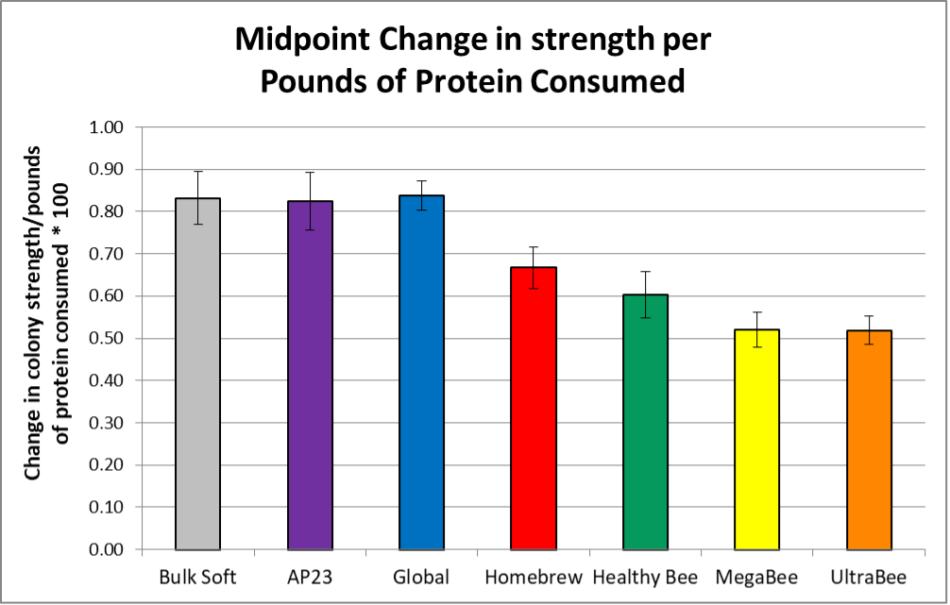
Fig. 7 Please take the results above with a big grain of salt, due to the number of variables involved. But since the error bars for the 18 hives in each test group are really small, the data suggest that the protein in the products to the left (which happened to be the best-performing diets) was utilized more efficiently than in those to the right, at least during the late-summer feeding period.
Practical question: Why was the protein in some diets more efficiently converted into bees than in others? Compare the above graph to Figure 6, and note how diets with excess leucine were poorly utilized. This brings us to the subject of:
JUSTUS VON LIEBIG’S LAW OF THE MINIMUM AND ESSENTIAL AMINO ACIDS
In the late 1800s, the above-named agricultural chemist proposed a groundbreaking concept regarding the fertilization of crops. He pointed out that the most efficient use of nutrients was not to dump on an excess of any one, but rather that the amount of growth is determined by the essential nutrient in shortest supply, whichever nutrient it may be.
Then in the 1930s, W.C. Rose published studies in which they found that it was possible to identify certain amino acids as being “essential” for animal growth [[7]]. Just as von Liebig had realized that optimal plant growth can be attained by addressing any “limiting nutrients,” this concept also applied to the growth of animals, and in our case, to the growth of honey bees and their colonies (Figure 8).
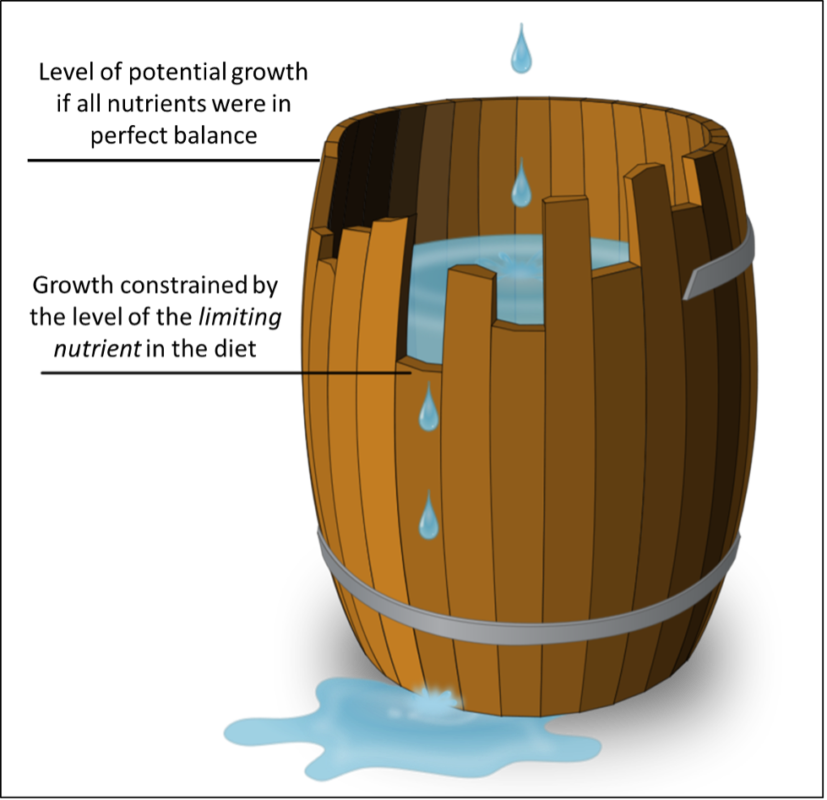
Fig. 8 In the case of honey bee diets and the ten EAAs, imagine the barrel above as having only ten staves, and that a diet in which the EAAs were in perfect balance would fill to the brim. The most important stave would likely represent the predominant EAA, leucine, with the other stave heights representing the proportion of each other EAA if it were in the correct ratio to perfectly complement leucine [[8]]. In diets with an excess of a certain EAA, that stave would be above the maximum fill level (determined by the leucine stave), whereas EAAs in deficit would be below the leucine brim, and not allow full utilization of the leucine.
Practical application: It’s all about providing the optimal “balance” of nutrients, rather than an underutilized excess of any one.
For me to visualize EAA deficiencies, I created a calculator with somewhat similar “staves.” So for example, suppose you made a patty of equal parts of soy flour and brewer’s yeast (plus sugar of course), the EAA ratios would look like the “staves” below (Figure 9).
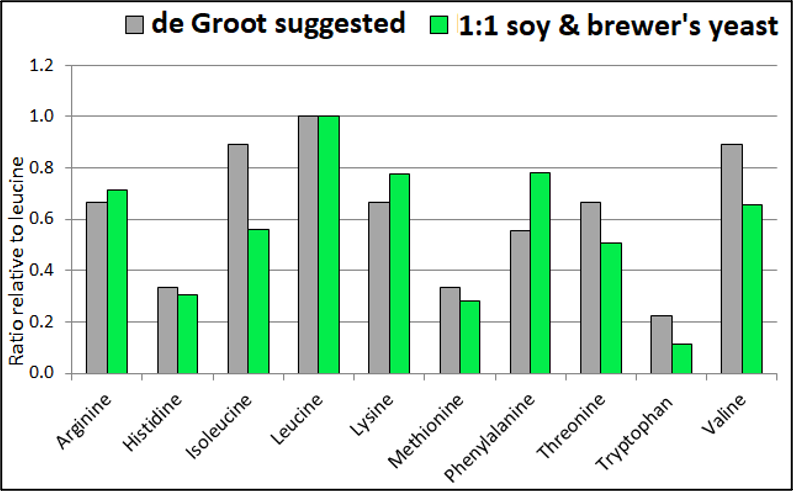
Fig. 9 The EAA proportions of a soy/yeast diet. The gray “staves” represent de Groot’s suggested proportions; the green “staves” represent the proportions in the formulated diet, normalized to leucine. Note the serious deficiencies of isoleucine and tryptophan.
When I looked at the EAA ratios of the diets that I tested in this way, it was obvious that the bees could only fully utilize some fraction of the leucine in each diet, since in every case, some other EAA would have been proportionally limiting.
Curious, I spent hours looking for correlations between the EAA ratios in the diets relative to my measured outcomes. I’d be happy to hear other interpretations [[9]], but what stood out to me was the strong correlation between head & thorax mass at the midpoint, and the sum of the proportional deficiencies in EAAs relative to leucine (Figure 10).
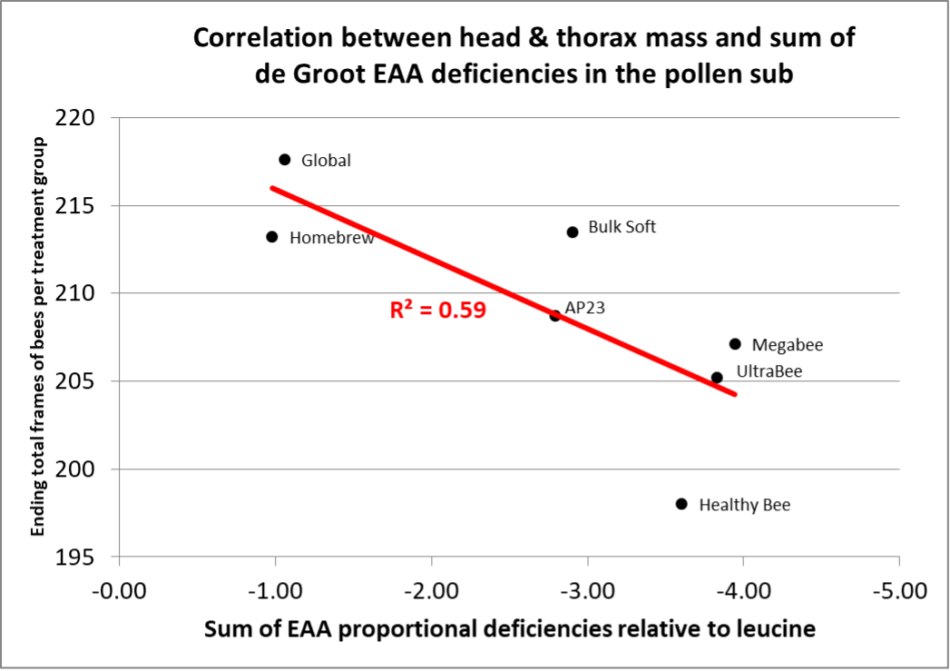
Fig. 10 There was a strong correlation between head and thorax mass at the midpoint compared to the sum of EAA deficiencies relative to leucine (p = 0.0449).
I obtained an even better correlation when I compared total frames of bees in February (Figure 11).
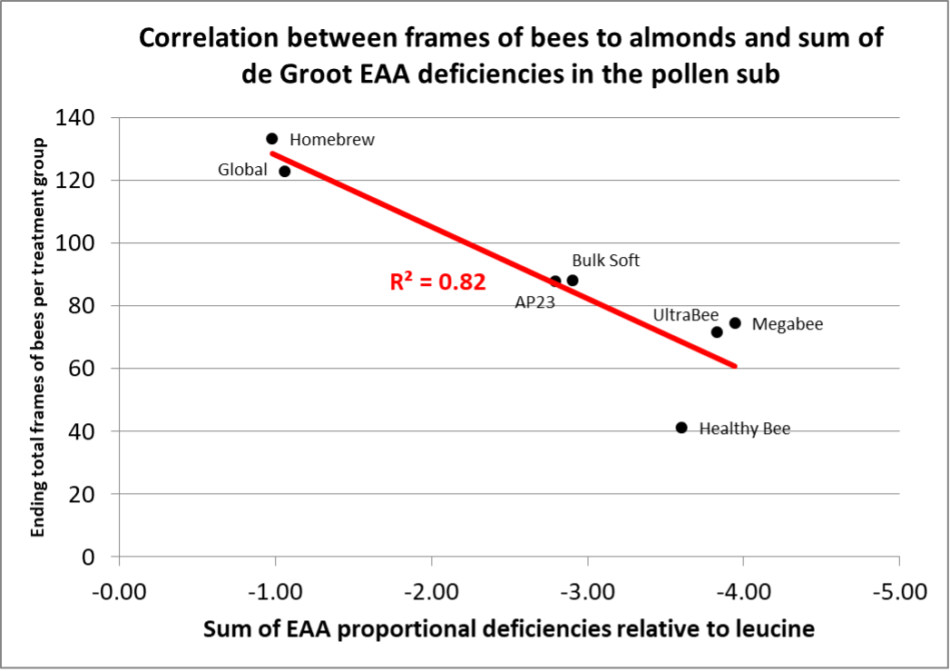
Fig. 11 There was a strikingly close correlation between the number of frames of bees available for almond pollination in each diet group, relative to the sum of the proportional EAA deficiencies in the diets (p = 0.0048).
For the non-statisticians, the R2 (R-squared) value indicates that 82% of the performance of the diets is explained by the independent variable (the sum of proportional EAA deficiencies). The p value indicates that the odds of getting this strong a correlation was less than 5 in 1000. This strongly suggests that we’re onto something important!
Practical application: Liebig’s concept of focusing upon limiting nutrients (in this case EAAs) stepwise, did not result in the best correlations. I obtained the best correlations when I calculated the sum of proportional EAA deficiencies, relative to leucine [[10]]. The take-home seems to be that for best performance, all the EAA deficiencies add up, so we should really strive for balance across the board.
Could we indeed predict the performance of an artificial diet simply from its ratio of EAAs? De Groot’s research suggests yes, as do the results of this trial. Could it be that the EAA ratio relative to leucine is more important than having natural pollen as an ingredient, the protein content or lipid level, or amount of sugar in the diet?
Let me point out an interesting caution from de Groot:
Attention may be drawn to the distinct growth which occurs during the first 7 days on diets devoid of an essential amino acid…It is recognized that in our experiments with suboptimal growth rates, one must be careful in classifying amino acids the omission of which does not result in a perceptible growth inhibition. These compounds, though not required for growth may exert stimulatory effects.
Practical application: For long-term feeding of a colony (as opposed to the feeding of individual bees for short periods), the “balance” between all necessary nutrients likely becomes more important. Perhaps the addition of natural pollen helps, but perhaps it would be unnecessary if an artificial diet were better balanced. Balancing the EAAs appears to be a good starting point!
To that end, I offer a contribution to our industry…
MY DIET CALCULATOR
In order to make it easier for those developing pollen subs, I’ve created an easy-to-use calculator that allows one to add ingredients together to create a diet with EAA ratios to match de Groot’s recommendations, normalized to the predominant EAA, leucine, rather than tryptophan (Figure 12).
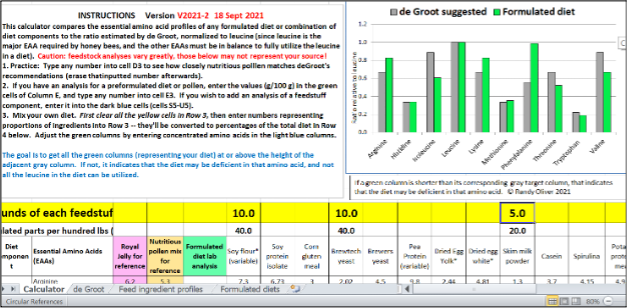
Fig. 12 A partial snip of the calculator. Here’s an example of what the EAA ratio looks like for a 10:10:5 mixture of soy flour, brewer’s yeast, and skim milk powder. Unfortunately, most commonly-available feedstuffs are short in isoleucine, threonine, and valine. You can’t see it here, but the calculator allows one to easily figure out how much of each of those readily-available amino acid concentrates to add in order to balance the green columns to de Groot’s recommendations. The Excel file for the calculator is available at [[11]].
So for comparison, let’s take a look at the EAA ratios of a mixture of natural pollens [[12]] (Figure 13).
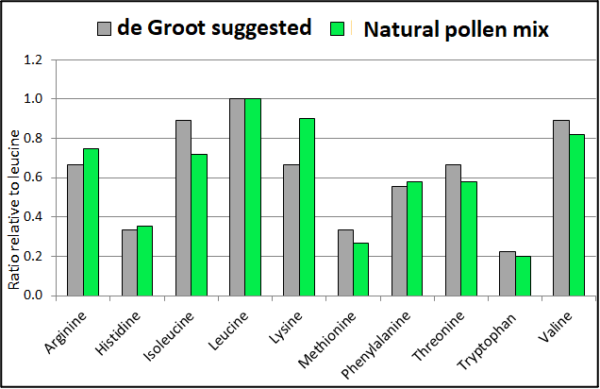
Fig. 13 Not surprisingly (since honey bees and bee-pollinated flowers coevolved), the EAA ratios of a mixture of natural pollens (green columns) closely match de Groot’s recommendations (gray columns).
SO HOW ABOUT THE TESTED DIETS?
Finally we get to the meat (actually just the amino acids) of this study. I used my calculator to create graphs for each of the tested pollen subs (Figure 14).
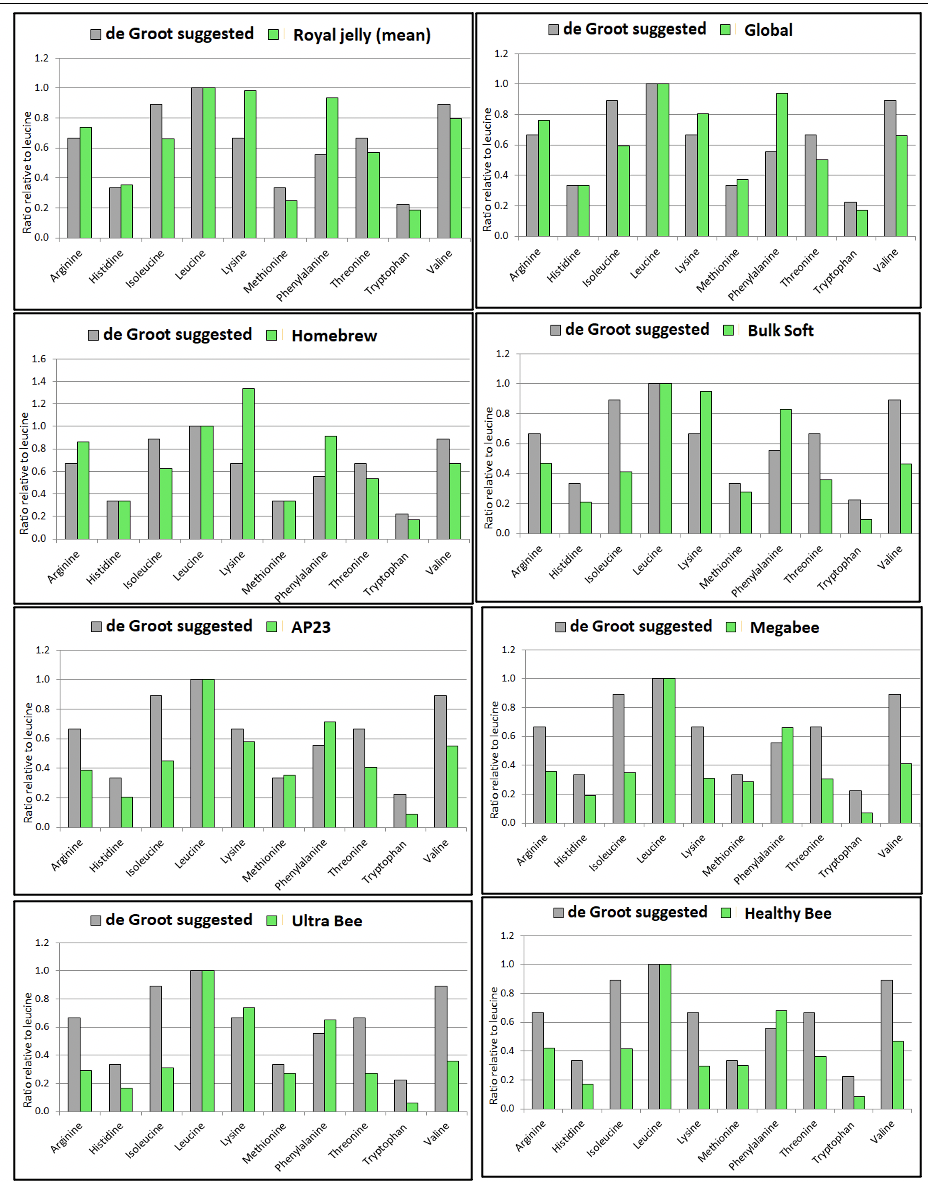 |
Fig. 14 For comparison, I placed the ratios for royal jelly at the top, and placed the subs roughly in order of performance top to bottom. Note how the better-performing subs exhibit fewer gross deficiencies in EAAs. For full utilization of the leucine, every tested diet could likely use addition of isoleucine and valine, and some, threonine.
Since I ran this trial for everyone’s benefit, I sent each manufacturer the calculations for the exact amounts of each EAA to add to their formulations to balance them out. I’m very curious as to whether doing so can improve the performance of a diet.
Practical application: I suggest that it’s time for our industry to move beyond the “by guess and by golly” method for formulating pollen subs. Since field trials to test performance are costly and require many hives placed where there is no natural pollen flow, formulating diets based upon EAA nutrient model might be a good first step. I hope to run trials next season to validate this hypothesis.
Since the availability of affordable feedstuffs available for bee diets varies greatly from country to country, I designed my calculator for use by beekeepers worldwide by providing the ability to enter the EAA analysis of anyfeedstuff, as well as the option of adding EAA concentrates. You can download a copy of Randy’s Amino Acid Ratio Calculator at https://scientificbeekeeping.com/7333-2/
THE HOMEBREW FORMULATION
Oh yes, lots of you are likely curious about the ingredients in the high-performing Homebrew formulation. The beekeepers who provided me the patties helped to fund this project, but wish to remain anonymous (I can say that they were assisted by advisor Alisha Taff [[13]]). However, for the benefit of beekeepers everywhere, they are generously allowing me to share their recipe:
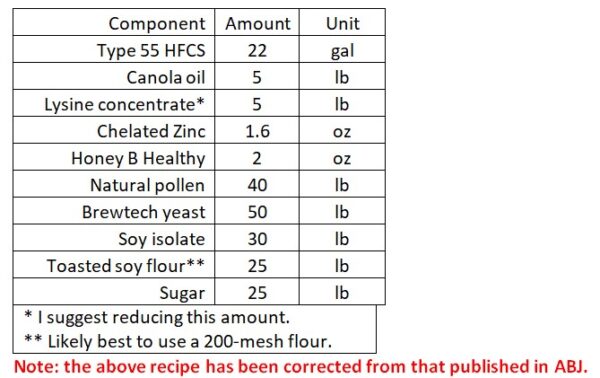
The beekeepers also added a gallon of a seaweed extract from New Zealand [[14]].
NOT YET DONE …
De Groot understood that as monumental as his research was, his suggested EAA ratios may not apply to the most important factor involved in colony buildup — the dietary requirements of the nurse bees for producing the jelly to feed larvae. There may also be separate optimal ratios for the creation of the “storage proteins” necessary for the health and longevity of “winter bees.” I’ll address these subjects in my next article.
REFERENCES
[1] de Groot, A. (1953) Protein and amino acid requirements of the honey bee. Physiol. Comp. Oecol. 3, 197–285.
[2] Hagedorn, H (1967) The rate of pollen consumption by newly emerged honeybees. J. Apic. Res. 6, 159–162.
[3] Haydak, M (1934) Changes in total nitrogen content during the life of the imago of the worker honeybee. J. Agr. Research 49: 21-28.
[4] Please refer to Figure 3 in the previous (October) installment of this series: A comparative trial of the pollen subs Part 4: Why did some subs outperform others?
[5] Altaye, S, et al (2010) Convergence of carbohydrate-biased intake targets in caged worker honeybees fed different protein sources. The Journal of Experimental Biology 213: 3311-3318.
[6] Somerville, D (2001) Nutritional value of bee collected pollens. RIRDC Publication No. 01/047.
[7] McCoy, R. H., Meyer, C. E. & Rose, W. C. (1935) Feeding experiments with mixtures of highly purified amino acids VIII. Isolation and identification of a new essential amino acid. J. Biol. Chem. 112: 283–302.
[8] Which requires dividing its proportion by de Groot’s recommended proportion.
[9] The raw data is available at https://scientificbeekeeping.com/7333-2/
[10] The raw data is available at https://scientificbeekeeping.com/7333-2/
[11] https://scientificbeekeeping.com/7333-2/
[12] Taken from de Groot’s Table 25, which is similar to other pollen data that I’ve found.


