
A Study on Bee Drift and Mite Immigration: Part 3

July 22, 2023
Contents
Did the Tagged Bees Behave Normally?. 2
Observations from the Donor Hives. 5
Correlation With Varroa Infestation. 6
Timelines of Recovery of Drifted Bees 9
Relevance to Mite Immigration. 10
A Study on Bee Drift and Mite Immigration:
Part 3
Randy Oliver
ScientificBeekeeping.com
First Published in ABJ April 2023
Last month I showed how we set up a field study to try to answer a number of questions about mite drift from collapsing colonies. Let’s continue.
The Donor Colonies
We had set up two mite-free Control Donor hives, and nine high-mite Donor hives intended to collapse (the tenth collapsed before we were ready). Colony strengths averaged nine frames covered with bees (range 7-13). Starting varroa mite infestation rates of the high-mite Donors (determined by alcohol wash) averaged 26 mites (range 11-55, per level half cup of bees [[1]]).
Tagging
At the start of the study on 17 September, we glued color-coded steel tags onto 50 non-flying bees in each hive, and then later tagged additional cohorts of bees (100-250 at a time) when their colony’s mite count exceeded 30, or we observed signs that collapse was imminent (loss of strength, deformed wings, or dying pupae). In some Donors that collapsed slowly, we tagged additional bees during the process. In all, we tagged a total of 6230 bees, averaging 585 per hive.
Results and Discussion
Did the Tagged Bees Behave Normally?
I showed last month how we lightly anesthetized and tagged the bees. A critical question to consider is whether the process of tagging those bees changed their behaviors. So I watched them closely afterwards (Figure 1).
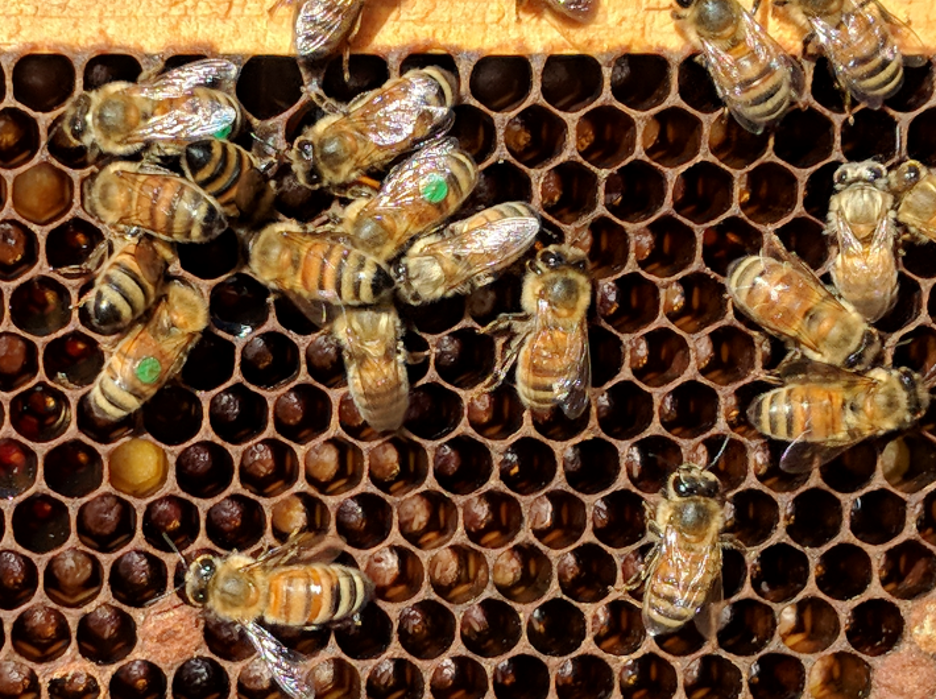
Fig. 1 We tagged workers shaken from brood combs, and then behaviorally-sorted to obtain non-flying, presumably “young” bees. Checking back in the days after applying the tags, the tagged bees appeared to be behaving like “normal house bees” on the combs, as in this photo.
What was striking was that in the first days after the initial tagging, we didn’t see any tagged bees at the entrances or flying. But after around 10 days, we were surprised by seeing tagged bees suddenly appear en masse at the entrance — presumably as they shifted from nursing behavior to guarding and foraging (Figure 2).
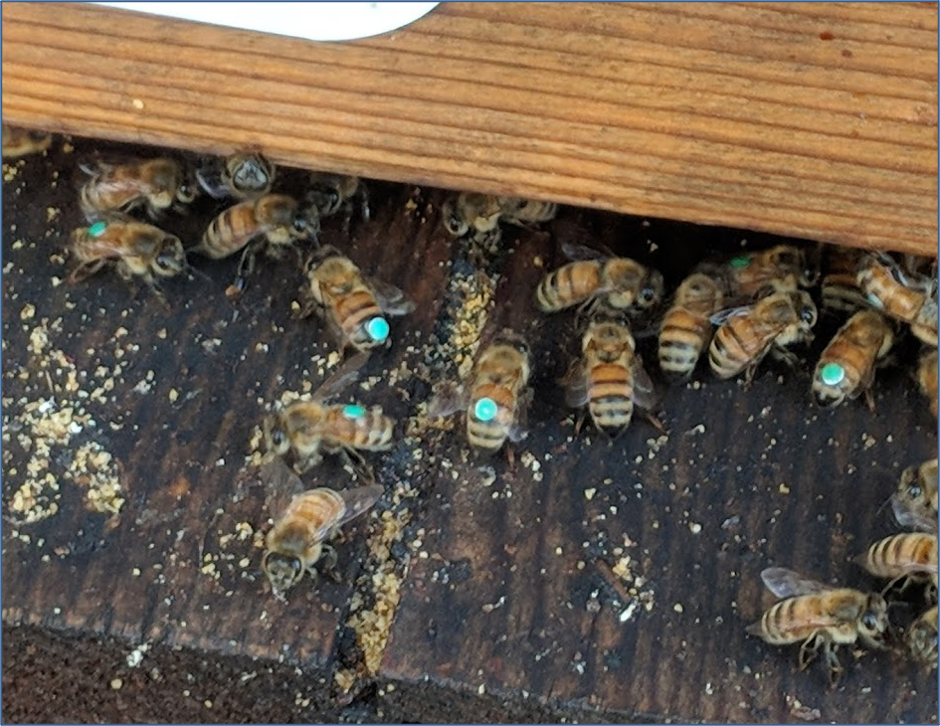
Fig. 2 What a surprise to come out to the Donor yard one day and see the tagged bees suddenly showing themselves, exhibiting “normal” progression in behavior. It was really conspicuous and impressive! This confirmed that we were tagging cohorts of bees of similar behavioral “age.”
And then a few days later, we noticed tagged bees acting as foragers (Figure 3)
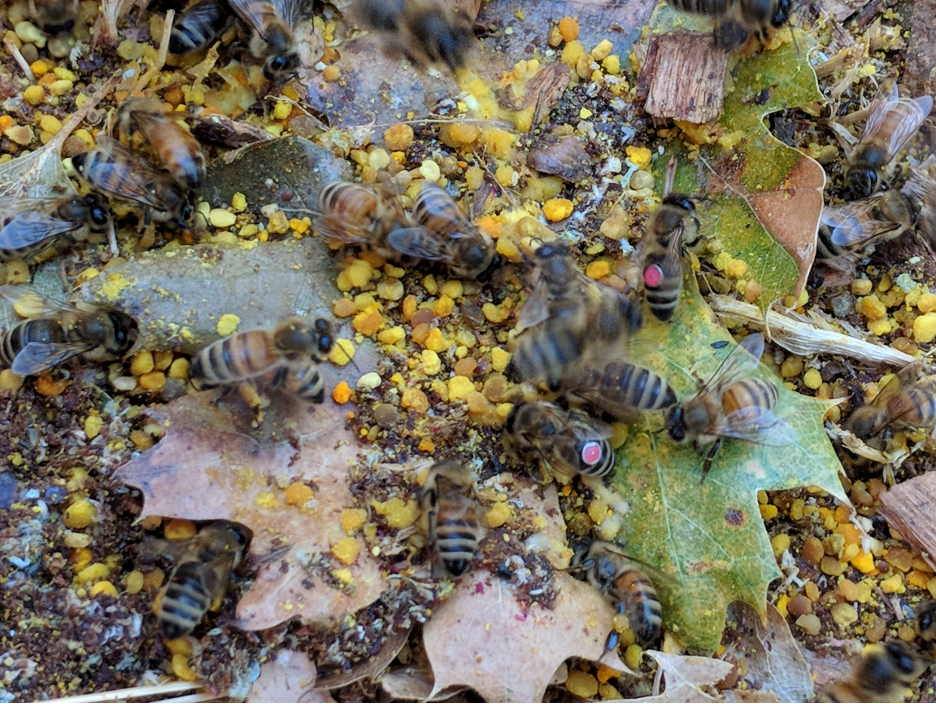
Fig. 3 I watched a single red-tagged bee show up at some pollen that I had spilled, and then apparently recruit other foragers with the same tag color. I also observed tagged bees foraging upon spilled syrup where we fill our feeder jars. All indications were that the tagged bees were behaving completely normally.
Progress of the Colonies
The Donors: The two mite-free Control Donor colonies retained their strength and health throughout the 74 days of data collection.
All the high-mite Donor colonies save one, at some point collapsed (D7 only dwindled a bit). Some began collapsing in September, but most did so during mid-October. Some colonies collapsed relatively quickly, others more slowly.
The Receivers: All Receiver colonies remained in good health. Those in the home yard with stickyboards maintained mite wash counts of zero throughout the study, other than four that had counts of 1 during the peak of bee drift on 15 October.
Answering our Questions
We had a number of questions to answer; let’s go over them one by one.
Question: What proportion of workers from collapsing colonies drift to other hives?
This is one of the primary questions that this study was designed to answer.
Observations from the Donor Hives
It quickly became clear that workers drift freely between nearby hives (the Donors were several feet apart from each other) (Figure 4).
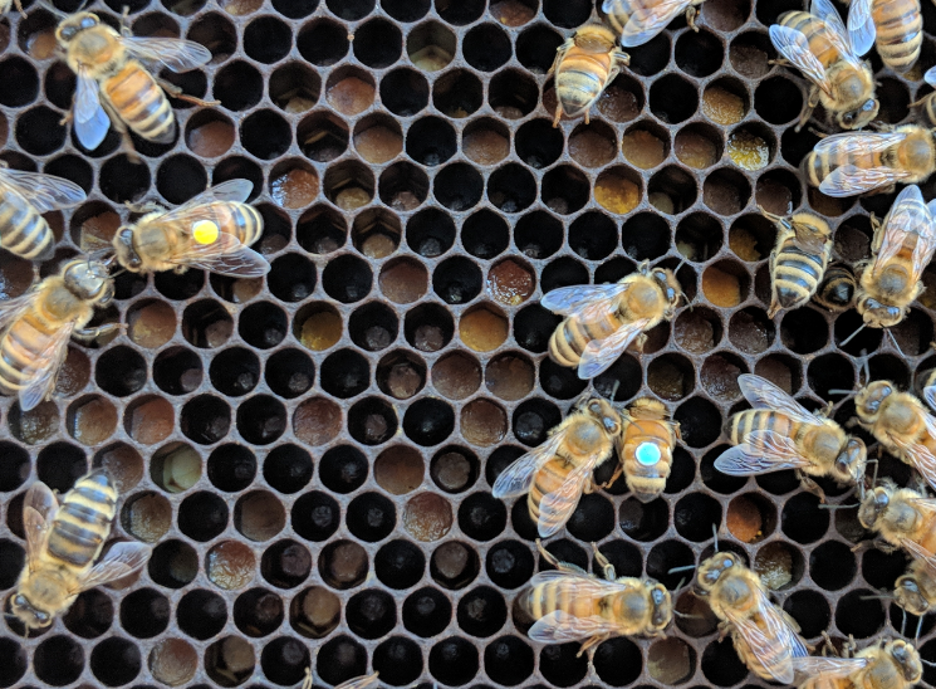
Fig. 4 There was considerable drift of tagged bees between the Donor hives, as evidenced by bees with different tag colors showing up on the combs, as in the photo above. But since those hives did not have magnetic traps, we could not quantify the full amount of drifting taking place.
At final cleanup at the end of the study, we recovered 44 drifted tags from the bottom boards or ground in front of the Donors (2-13 tags per hive, with the drifted tags often from the most closely-adjacent colonies). That works out to 20% of all tags recovered, confirming that there’s a lot of drift between nearby hives.
Experimental limitation: Those 44 recovered tags can be considered as a gross underestimate of how many tagged bees actually drifted into nearby Donors, since the Donor hives did not have magnetic traps. Any drifted bee would most likely have later flown out to die without leaving a tag behind (as evidenced by the fact that there were very few tagged bees or dropped tags remaining in the Donor hives at the end of the study).
Previous studies have found that rates of worker bee drift between nearby hives can be up to 40% [[2], [3], [4], [5], [6]], but has been more generally been found to be in the 3-10% range. In this study we recovered drifted tags from 3.6% of our tagged bees (Table 1), but I’ll explain in a moment why that can be assumed to be an underestimate of the actual amount of drift that occurred during this study.
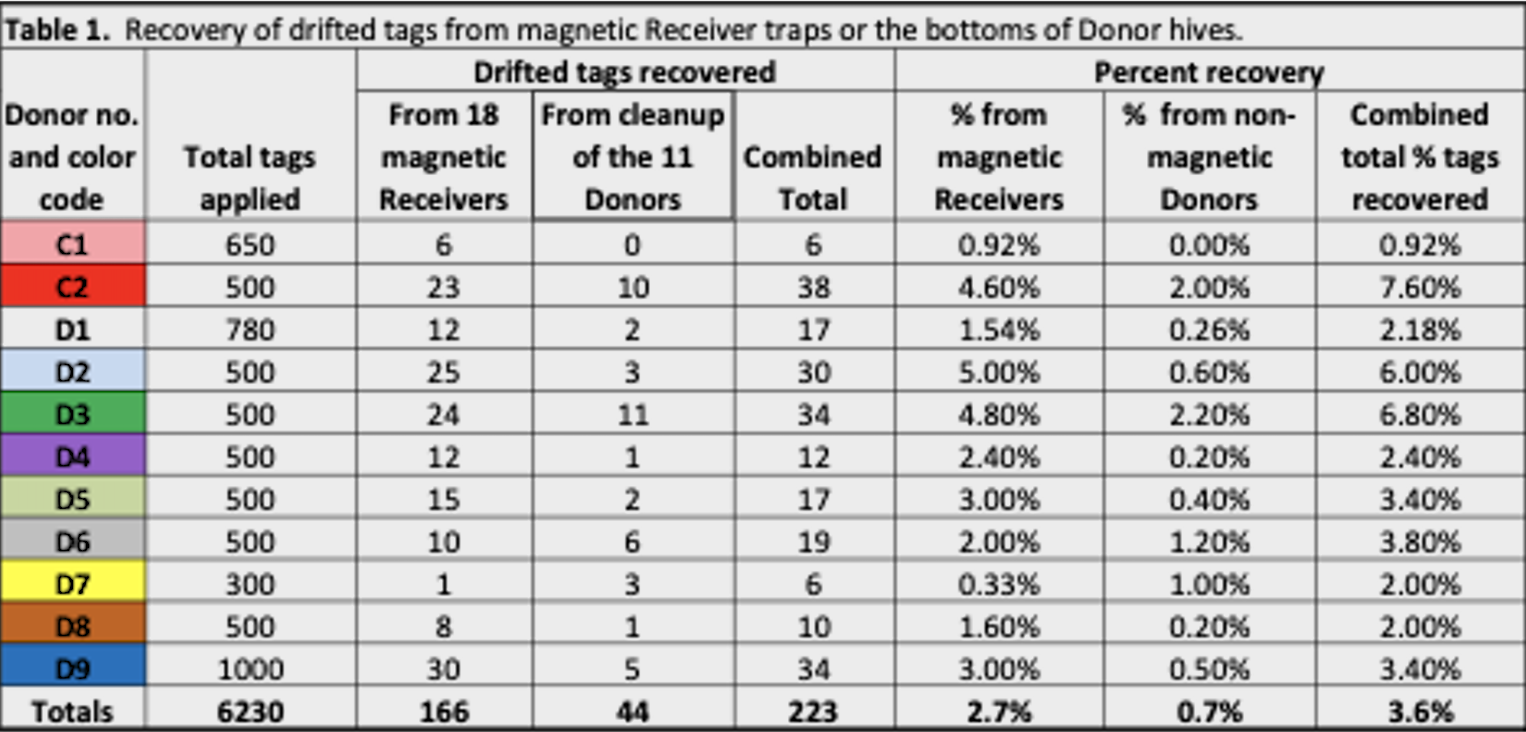
Table 1. Of the 6430 tags that we glued onto young workers, we recovered 3.6%, mostly from the magnetic traps of the Receiver hives, but also some from the bottom boards and ground in front of the Donor hives. I’ll go over this data graphically further along.
It’s an open question as to where the 6000 unrecovered tags (and their bees) wound up. The tagged bees may have drifted to colonies not involved in the study, or just eventually died in the field, as do the vast majority of workers.
We can justifiably assume that our count is an underestimation of actual drift, is since we had magnetic traps on only 3 of the 30 hives in each of our surrounding outyards, so would only expect to recover 10% of the drifted bees to those yards. Similarly, we don’t know how many of each cohort of tagged bees drifted into unknown hobbyist or feral colonies in the neighborhood.
Conclusions: Bees did indeed drift from collapsing colonies, but also from mite-free hives. Our quantified 3.6% drifted tag recovery rate can be safely assumed to be a substantial underestimate of the actual percentage of tagged bees that drifted from our Donors to other colonies.
Correlation With Varroa Infestation
Question: Does the varroa-virus complex increase the rate of bee drift into other hives?
Despite the fact that a number of parasites have been shown to affect host behavior in order to increase transmission, there’s little or no evidence to date that either varroa or DWV [[7]] induce increased drifting of honey bees [[8]].
So since this wasn’t a primary question to answer, in designing this study I included only two mite-free Control Donors, erroneously assuming that their drift rates would be similar. I could not have been more wrong! (Figure 5).
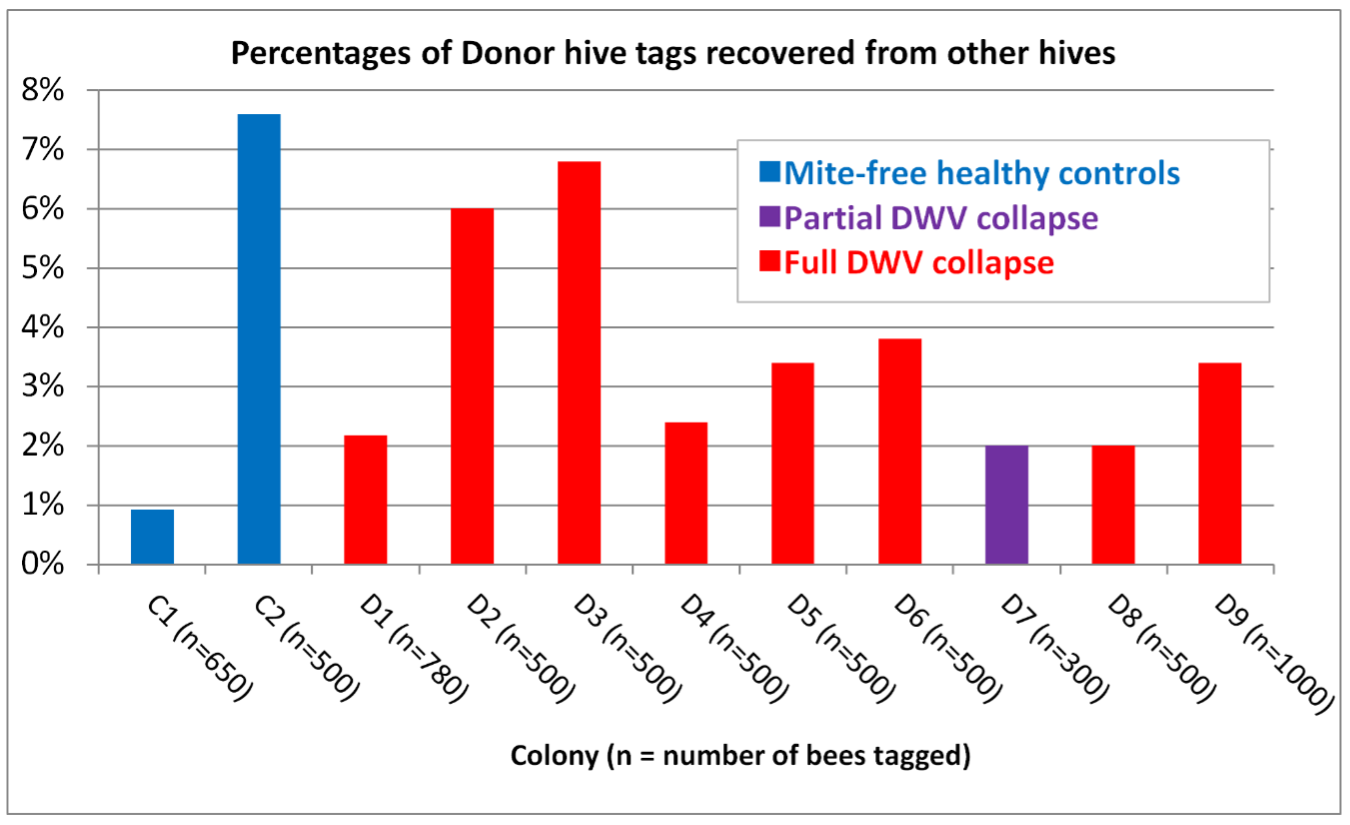
Fig. 5 It turned out that of all the Donors, the two mite-free Controls exhibited not only the lowest, but also the highest rate of drift! The rates of drift from the nine varroa-collapsing Donors all fell between that of the two mite-free Controls.
In retrospect I wish that I had run a larger number of mite-free Controls, and thank my lucky stars that I didn’t run only one, since drawing conclusions from the data of either Control alone would have been very misleading. Fortunately, these two Donor hives showed us how greatly the rate of bee drift can vary between healthy colonies.
Still curious, and since we did take periodic mite washes from the Donor colonies, I also looked to see whether there was a correlation between the intensity of the varroa infestation rate, and the degree of drifting (Figure 6).
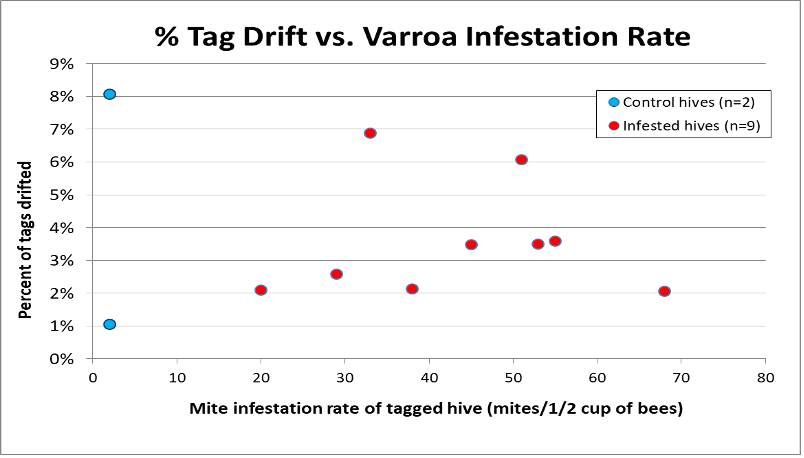
Fig. 6 I did not plan specifically to create this graph, so used mite wash data taken from our 15 October washes, or the mid-September mite counts from two Donors that had already largely collapsed by that later date. Again, there was no apparent correlation between varroa infestation rate and the rate of bee drift.
I’m not about to make any statistical claim based upon an “n” of only two hives in the Control group, but our results exemplify the sort of “ugly facts” that Thomas Huxley was referring to in his famous quote: “The great tragedy of science — the slaying of a beautiful hypothesis by an ugly fact.”
Conclusions: It would make “total sense” for the varroa-DWV complex to cause infected bees to drift to other hives. But, as found by others, our field data do not support that beguiling hypothesis.
Tag Recovery by Date
Even if the varroa-DWV complex is not the cause, that doesn’t necessarily mean that worker bees don’t tend to increase their amount of drifting as their colony collapses. Free [[9]] found that:
An individual bee is more likely to drift from a small to a large colony than vice versa.
We observed that two Donors collapsed shortly after the start of the study, whereas most of the rest collapsed in mid-October. Let’s see whether that’s reflected by tag recovery (Figure 7).
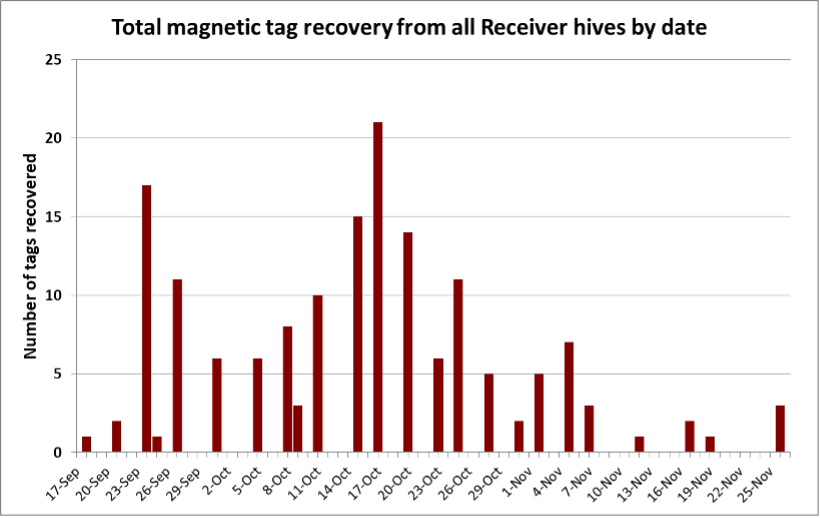
Fig. 7 The recovery of tags correlated pretty closely with the collapses of two colonies in late September, and then with the rest of the Donors in in mid-October.
The above data certainly suggest that bee drift correlates with the timing of colonies collapsing, so let’s take a closer look at our recovery of drifted tags, Donor-by-Donor.
Timelines of Recovery of Drifted Bees
My quandary when designing and executing this study
Keep in mind that this study was about mite immigration, and we’re looking at bee drift in the context that immigrated mites would need to have caught rides on either drifting or robbing bees [[10]]. From other studies, as well as my own observations, I suspected that substantial mite immigration due to drifting bees might occur from September through November in my area. That covers a 90-day timespan. But worker bees during that time of season live for an average of only about 35 days [[11], [12], [13]], so I didn’t want to mark all 500 bees at the start of the study, since many might not still be alive by the time that their colony actually collapsed.
An alternative design would have been to set up equal numbers of mite-free and high-mite Donors, and on the same day of each week, tag 50 bees in each hive, simultaneously grading each colony for strength, and then look for a correlation between loss of strength and bee drift. But since I don’t have grad students at my disposal, the logistics would have been tough. Of greater importance, there would have been smaller numbers of tagged bees in a hive at time of collapse, and my objective was to focus upon obtaining the most possible data on the drifting of workers during the time of actual collapse. That said, I strongly encourage someone to run the study described!
Did the act of tagging bees cause them to drift?
Another question arises comes from observations by a number of other researchers that bees marked shortly after emergence may exhibit high rates of “loss” within the first days after being marked. This made me curious as to whether those “losses” are an artifact of something do with the process or marking them (which would have confounded our data), or whether that early loss of tagged bees was simply due to them getting confused and drifting during their first defecation flights.
In this project, during the 5-day period between 17 and 21 September, we glued tags onto over 3000 workers, checking the magnetic traps on the Receivers on a daily basis. During this time period we recovered only a single tag the day after our initial tagging of 550 bees, and only 2 more drifted tags through the 21st. We then took the weekend off, and checked the traps on 24 September, when we recovered 17 drifted tags.
Conclusion: The above findings suggest that the manner in which we tagged bees did not initiate immediate drifting.
Relevance to Mite Immigration
I’ve confirmed that shaken non-flying “house bees” (such as we tagged) tend to exhibit a higher rate of mite infestation compared to “flyers” [[14]]. This is presumably due to the observation that nurse bees are most attractive to varroa, and thus have the highest infestation rate of any workers in the hive.
So at what age would we expect bees to tend to drift? Again returning to King’s observations in 1932:
The ages at which drifting appeared to be most prevalent were between the fifth and tenth days, which corresponds rather closely with the age at which young bees show a tendency to shift from activities within the colony to field work.
Free [[15]] followed up on this in 1958, finding that:
- Most of the bees which drift do so during their orientation flights and before they become regular foragers.
- Bees emerging in August and September drift less than those emerging earlier in the year.
- Drifting varies considerably in different circumstances, and may be extensive.
- Drones drift two to three times as frequently as workers.
And finally, Bordier [[16]], tracking 1000 tagged bees with a receiver hive placed to either side, found that 10% of them drifted to another hive, mostly when they were over 10 days of age.
We didn’t specifically set up this study to determine age of drift, but since we only tagged bees that didn’t fly off after shaking them from the combs, we can likely assume that they were young “house bees.”
Practical application: Since the issue of interest is transfer of varroa via drifting, if we’re trying to correlate mite immigration with bee drift, it’s important to know the behavioral “age” of those drifted bees. Is it mainly young workers getting lost during cleansing or orientation flights, foragers returning from their first exploratory flights, or older foragers that either got lost, disoriented, confused, or unable to resist the alluring scent of another colony?
So with the above caveats and applications explained, let’s see what we can tease out of our data. I’ve created graphs of tag application and recovery for each individual Donor colony, with the date and number of bees that we tagged in blue columns (on the left hand y axis), and the number of their tags magnetically recovered in Receiver hives in red columns (on a different scale on the right axis). The columns don’t include drifted tags later recovered from Donor hives.
Question: At what age do bees tend to drift?
We tagged bees in the mite-free Control Donor hives only in the first few days, which gives us an opportunity to get an idea of at what ages those bees drifted from those healthy colonies (Figure 8).
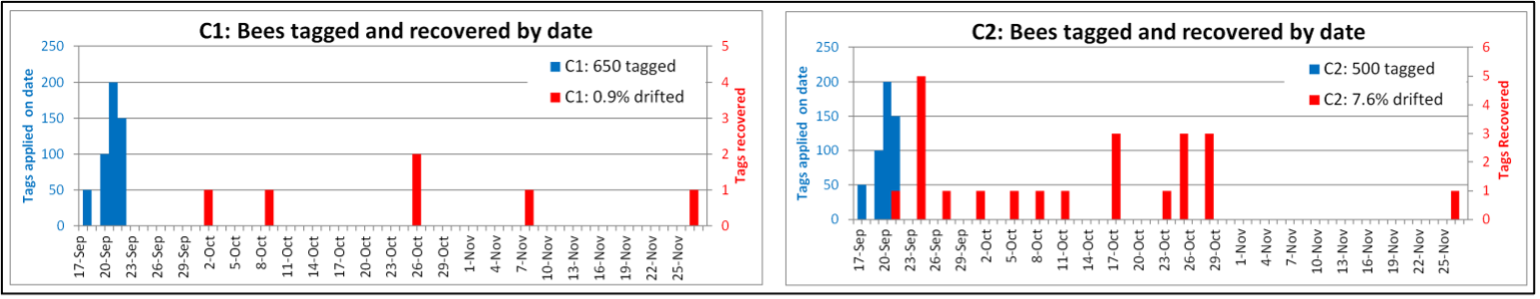
Fig. 8 These first two graphs are for the two mite-free Control Donor hives, in which we tagged bees only in the first few days (the blue columns). As I’ve already said, C2 then exhibited far more drifting (the red columns) than did C1 (and a greater amount shortly after tagging). Colony-to-colony variation is always the bugaboo of field research!
Interpretation: The amount of drifting of bees from the two Control Donor colonies was as different as night and day, but the overall timing of bee drift was well spread out for both colonies — indicating that the tagged bees drifted at all different ages. Surprisingly, we recovered a tag from each colony on the 70th day after first tagging, which means that even very old workers may drift.
Now let’s move to the high-mite Donors.
Question: Does bee drift correlate with the collapse of a hive?
Note: This study was designed to quantify the degree of drifting as colonies collapsed, not the correlation between collapsing and drifting. In these colonies, the correlation of drift with age or collapse may be confounded by our tagging of additional bees over time. In retrospect, if I were to run this study again, based upon the unevenness of drift from the Controls above, I might only tag bees during the first week, rather than waiting for their colonies to begin collapsing.
That said, I still find it of interest to look closely at the data. As opposed to the mite-free Controls above, all but one of the high-mite Donors did collapse. In each of those Donors, we tagged 50 bees initially, but then waited, if necessary, for signs that the colony was collapsing (decreasing strength, deformed wings, or dying pupae) to tag another 450 (or more) bees. You can tell when we thought that collapse looked imminent by the timing of the additional blue columns.
Due to the difficulty in creating a three-axis graph in Excel, I’ll provide starting and other appropriate mite wash counts in the captions. Take your time in analyzing the graphs below (and the information in the captions), as they tell us a lot about the drifting of bees during a colony’s collapse due to varroa.
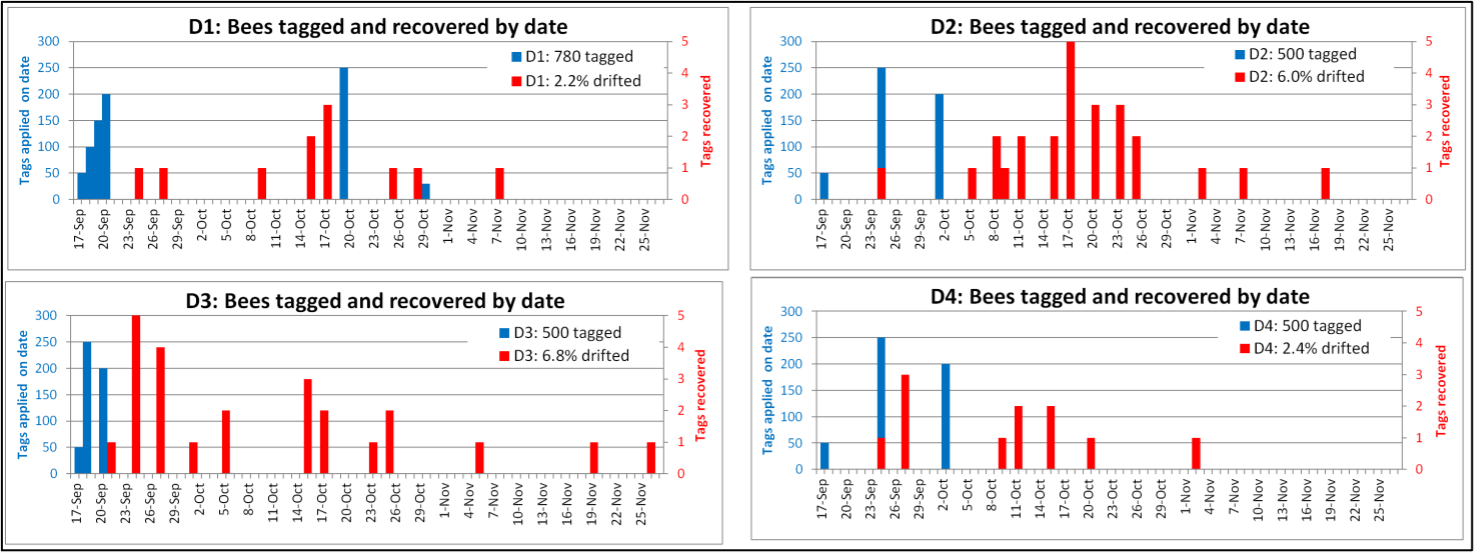
Fig. 9 Keep in mind that the scales for the blue and red columns are different. D1 started with a high mite count (30) and we expected it to collapse quickly, but it didn’t start to do so until mid-October, and then did quickly. D2 started with a relatively low mite count (19), and was still strong on 1 October, but then was collapsing quickly by 15 October, with a mite count of 51. D3 started with high mites (33), and also crashed by mid-October. Of interest, it graded at only a quarter frame of bees on 31 October, yet three of its tagged bees drifted during November (perhaps from a second drifting from another Donor?). D4 started with a low mite count (11), was still strong on 1 October with a wash count of 29, but then collapsed slowly.
Interpretation: The clumpings of the red columns for these colonies suggest that bee drift was associated with collapse, although some colonies collapsed more quickly than others.
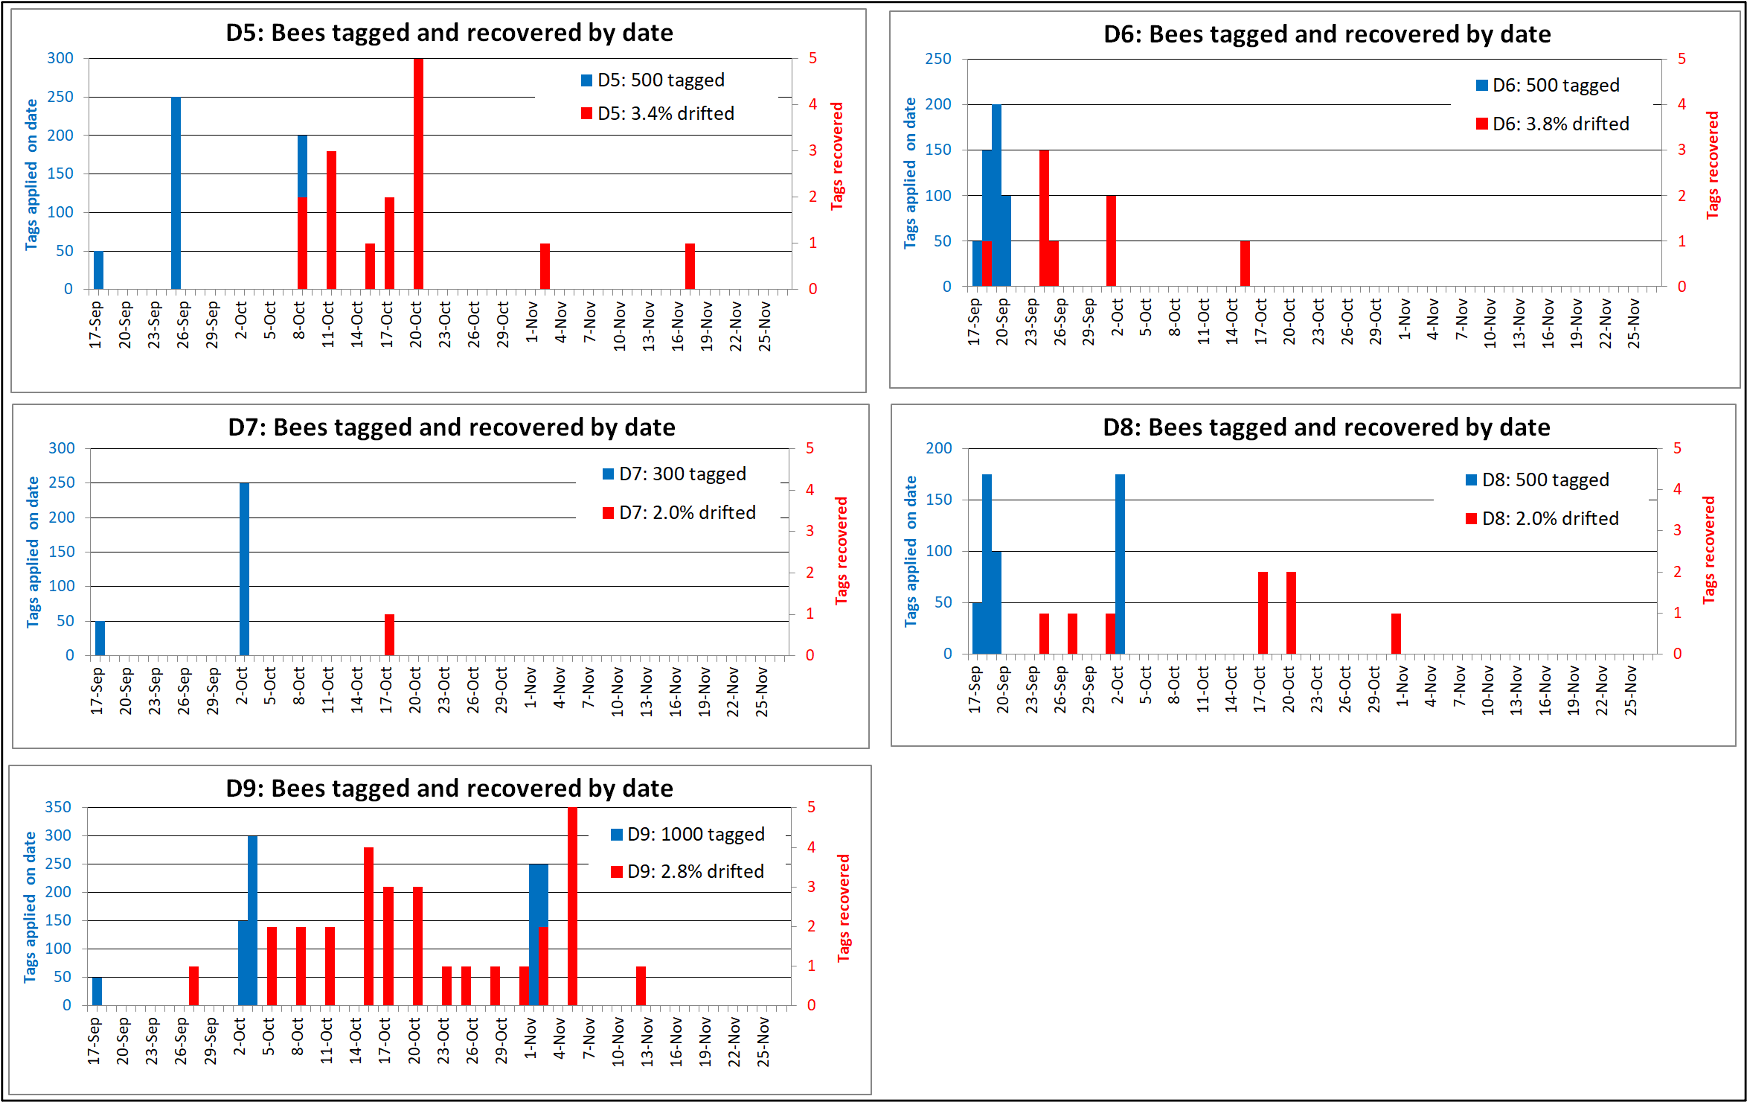
Fig. 10 Mite counts increased quickly in D5 (from 15 to 53 by 15 Oct) and it collapsed during the last half of October, whereas D6 was a strong hive with a very high starting mite count (55) that we rushed to tag as it started collapsing in September. D7 (starting count of 13) never collapsed, so we tagged only about half as many bees as for the rest of the Donors. D8 (starting count 38) collapsed fairly early, whereas D9 started strong and with a relatively low mite level (17) that increased greatly by mid-October (45) , causing signs of PMS (while it still contained 6 frames of bees). Because of its prolonged collapse (3 frames of bees remaining on 31 Oct), we tagged another 500 bees on 2 November.
Conclusion: Although our data didn’t support that mite-infested bees necessarily drift more than “normal,” it does appear that increased drift often coincides with the timing of collapse. It’s not clear whether that was just an artifact of our timing of marking, or due to bees tending to drift out of weakening colonies “with problems” into more attractive colonies.
I’ve only just begun — next month we’ll take a look at the effect of distance upon drifting bees, the “attractiveness” of some colonies to drifted bees, and then on to our data on the immigration of mites into the Receiver hives, relative to incoming drifted bees. I’ll then continue with quantifying the actual amount of mite immigration, and whether there was a correlation with robbing. As I said, this was an ambitious study, and we can learn a lot from it!
Acknowledgements
Thanks to my helpers Brooke Molina, Anna Mudd, Sandy Honigsberg, and Brion and Alice Dunbar, without whose help I could never have pulled off this study. And Dr. Norman Gary for his helpful consultation. And of course to those beekeepers whose donations enable me to pay for doing this sort of research.
Citations and Notes
[1] All mite counts in this article are for the number of mites recovered by a mechanically-agitated alcohol wash of a level half cup of bees
[2] King, GE (1932) Drifting bees may make production records of little value. Am. Bee J. 72: 141-142.
[3] Nelson, DL & SC Jay (1989). The effect of colony relocation on loss and disorientation of honeybees. Apidologie 20(3): 245-250.
[4] Jay, SC (1969). Drifting honeybees in commercial apiaries v. Effect of drifting on honey production. Journal of Apicultural Research 8(1): 13-17.
[5] Pfeiffer, K & K Crailsheim (1998). Drifting of honeybees. Insectes Sociaux 45: 151-167.
[6] Goodwin, R, et al (2006) Drift of Varroa destructor-infested worker honey bees to neighbouring colonies. Journal of Apicultural Research 45:((3) 155-156.
[7] Deformed Wing Virus.
[8] Citations in Part 1 of this series.
[9] Free, JB (1958) The drifting of honey-bees. The Journal of Agricultural Science 51(3): 294-306.
[10] Ignoring for now that from drifting drones. During the course of this study, there were very few drones in any of our colonies.
[11] Lloyd Harris, in prep.
[12] Free, J & Y Spencer‐Booth (1959). The longevity of worker honey bees (Apis mellifera). In Proceedings of the Royal Entomological Society of London. Series A, General Entomology 34 (10‐12):141-150.
[13] Sakagami, S& H Fukuda (1968) Life tables for worker honeybees. Population Ecology 10(2): 127-139.
[14] https://scientificbeekeeping.com/re-evaluating-varroa-monitoring-part-4/
[15] Free, JB (1958) op cit.
[16] Bordier, C, et al (2017) Should I stay or should I go: honeybee drifting behaviour as a function of parasitism. Apidologie 48(3): 286–297.


