
Field of View Count Correlation

February 23, 2011
Field of View Count Correlation
Report to the California State Beekeepers Association
by Randy Oliver
ScientificBeekeeping.com
First Published inABJ in Oct. 2008
Determination of “spore count”
Nosema infection level is reported in a standardized “spore count” of “average number of spores per bee,” generally given in millions (1 million = 1 x 10⁶). The “standard method” of Cantwell (1970) involves the use of a hemacytometer. However, a commonsense paper by Topolska and Hartwig (2005) suggests that since spore counts are really ballpark figures, a semiquantitative (approximation) method of ranking spore levels would be close enough for management decisions.
Topolska and Hartwig considered seeing one to a few spores in some fields of view (as you moved the slide around) to indicate a “slight infection.” They termed a single to a few spores in every field of vision as “moderate”, and numerous spores in every field as “heavily infested.” The main thrust of my research funded by CSBA was to determine the correlation between the methods.
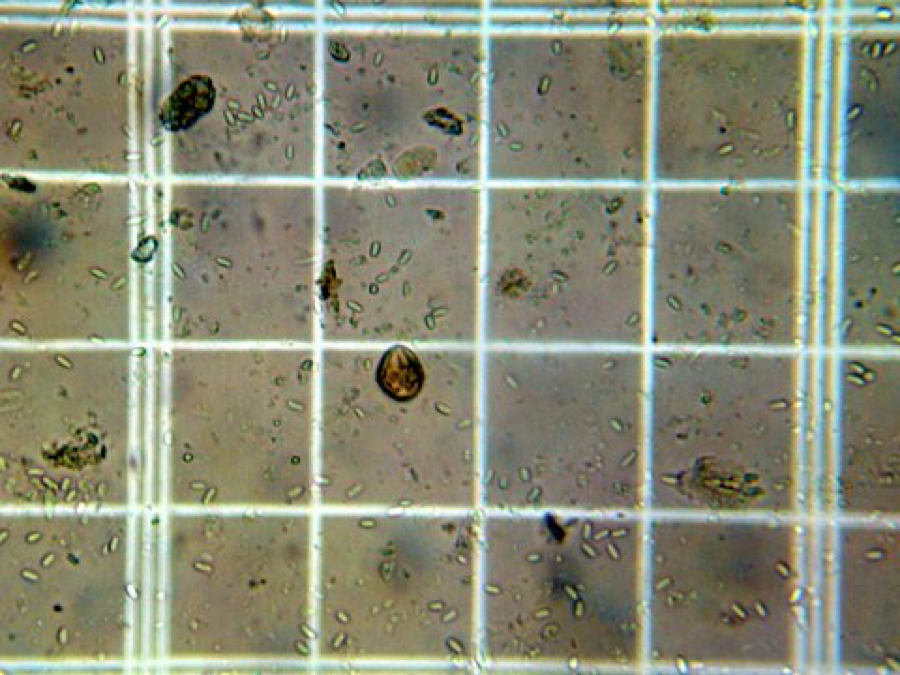
Nosema ceranae spores in the grid of a Bright-Line hemacytometer. At an average of over 5.5 spores per square, this bee contained more than 22 x 106<.SUP> spores.
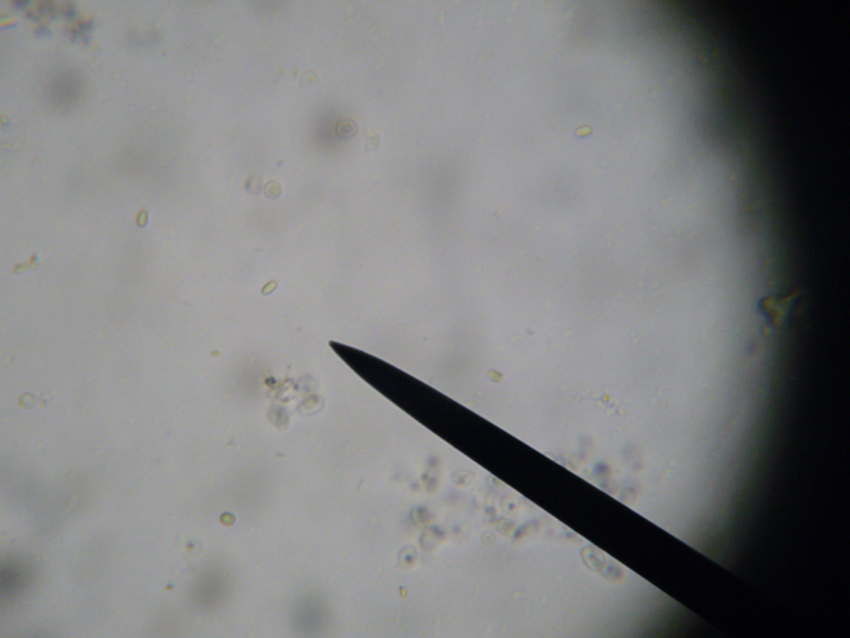
This is a 400x “field of view” image of a prepared sample of bees at a low infection level.
I took multiple spore counts from samples of bees—one drop of slurry into the hemacytometer, and one onto a standard slide. The results are graphed below.
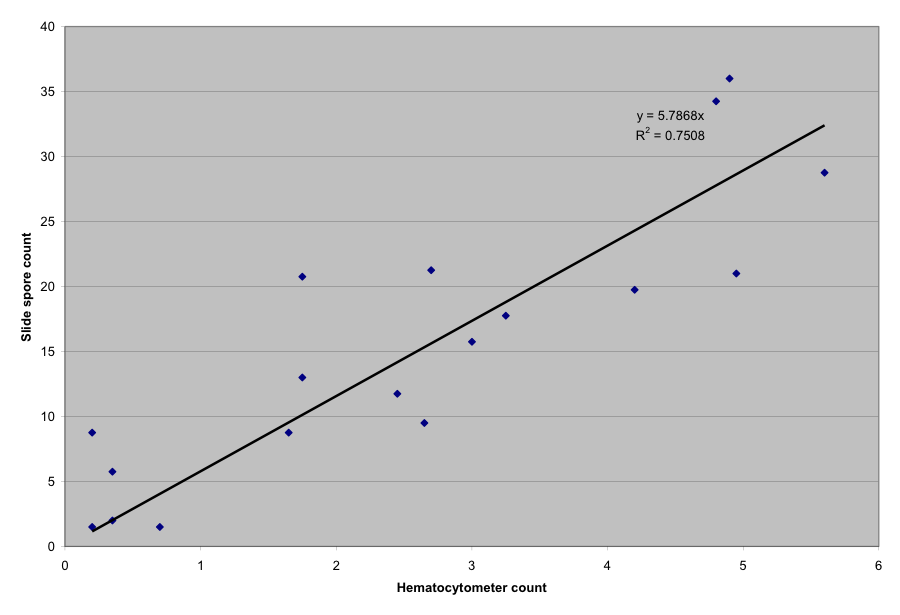
At spore counts in the range of 0 – 6 million spores per bee, the correlation was a bit less than 6 spores in the field of view for every million spores per bee.
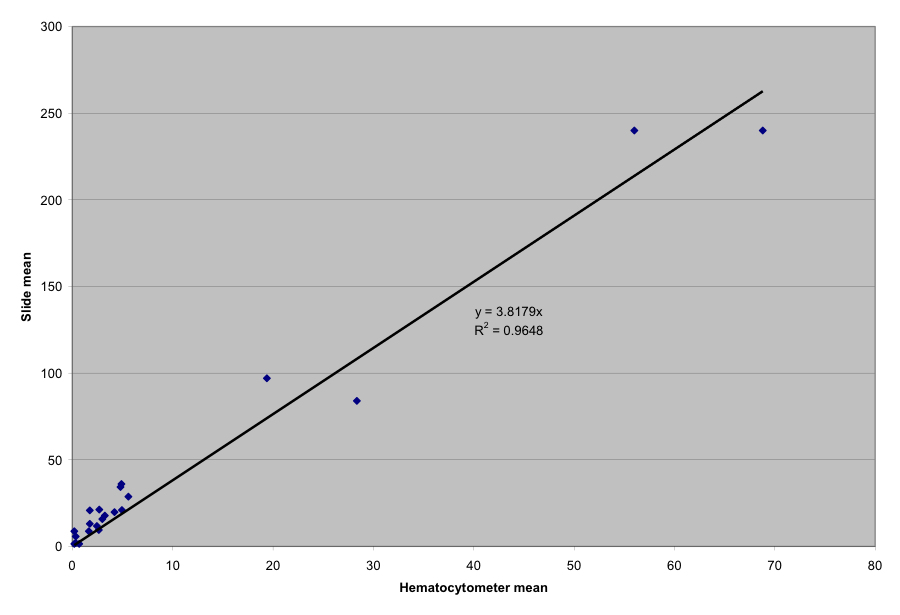
However, when I counted a few samples at much higher infection levels, the correlation was just under 4 spores in the field per million spores per bee. I’m not sure why the slope at the lower spore counts was higher, but since accuracy at higher counts is a rather moot point (since a colony is severely infected by then), I would tend to favor the slope of the first graph.
My conclusion is that a good rule of thumb estimation would be to use the simple calculation that for every million spores per bee, you will see about 5 spores in the field of view at 400x, when the bee sample is diluted at the rate of 1ml water per bee. Thus, if one were to see, say, 15 spores in a field, that would indicate an infection level of 3 x 10⁶ spores per bee.
Conclusion: Divide the number of spores in a field of view by 5 to obtain the infection level in millions of spores per bee.
References
APHIS (2007) International Standards for Phytosanitary Measures, Sampling of Consignments. (Broken Link!) http://www.aphis.usda.gov/import_export/plants/plant_exports/downloads/draft_ispm_sampling_consignments.pdf
Cantwell GE (1970) Standard methods for counting nosema spores. American Bee Journal 110(6), 222–223.
Fingler BG, WT Nash, and TI Szabo (1982) A comparison of two techniques for the measurement of nosema disease in honey bee colonies wintered in Alberta, Canada. ABJ 122(5):369-371.
Martín-Hernández Raquel, Higes Mariano, Garrido M. Encarnación, Meana Aranzazu (2006) Influence of sampling in the detection of Nosema ceranae spores. . Proceedings of the Second European Conference of Apidology EurBee Prague (Czech Republic) 10-16 September 2006
Topolska, G, and A Hartwig (2005) Diagnosis of Nosema apis infection by investigations of two kinds of samples: dead bees and live bees. J. Apic. Science 49(2):75-78.


