
Field Trial of Several Nosema Treatments

February 23, 2011
Field Trial of Several Nosema Treatments
Progress Report
by Randy Oliver
ScientificBeekeeping.com
First Published in ABJ in Oct. 2008
2023 Update
There are several products on the market claiming to reduce nosema loads and improve colony health and performance.
A recent compilation of lab and field studies has been published: Evaluating the Efficacy of Common Treatments Used for Vairimorpha (Nosema) spp. Control (2023) Cody Prouty, Cameron Jack, Ramesh Sagili, and James D. Ellis. https://doi.org/10.3390/app13031303
They tested Fumagilin-B, Honey-B-Healthy, Nosevit, and HiveAlive in one lab-based experiment and three field experiments. Their findings raise questions regarding the efficacy of the products currently currently on the market.
They didn’t find any clear benefit to using any of the tested treatments.
They also noted that spore counts and prevalence follows plant phenology (something noted by many of us), increasing when pollen (or pollen sub) is abundant , and declining (or disappearing) during dearth periods.
In my own operation in California, I do see that colonies with a high prevalence (percent of workers infected) of nosema, build up more slowly and produce a little less honey, but along with a number of studies by others, have not found a correlation between winter loss and nosema. So we do not spend money on nosema treatments, and instead simply breed for bees that come out of winter in good condition and build up well prior to and during almond bloom (when pollen is abundant).
(Back to the original article) Introduction
With the discovery of Nosema ceranae, and due to reports that the standard treatment with fumagillin may not provide adequate control, I ran a long-term trialhof various treatments, and methods of application, with nosema infected colonies. I continued to run the trial beyond the expected effects of treatment in order to follow colony performance in the second year of nosema infection, and to see if Dr. Mariano Higes’ “false recovery” and collapse would take place.
Materials and Methods
In late November 2007 I received funding to test several treatment compounds and methods of application. This was late in the season to being a field trial in colonies being prepared for winter, however the weather in Grass Valley, CA was unseasonably warm and dry, so I began selecting potential test colonies for nosema levels (confirmed by PCR to be predominantly N. ceranae by Dr. Robert Cramer, Univ. Montana).
By December 12, I had placed 66 nosema-infected colonies into a test yard. Most had spent a dry summer with minimal forage locally. All had been fed brewer’s yeast pollen patties and thymolated syrup at least twice in October, and all had been treated with oxalic acid dribble in late September or early October to control varroa mites.
On December 14, I equalized all colonies to about 5 frames of bees, and treated them with 3.5%w:w oxalic acid dribble.
We numbered the colonies, and set up a randomized block design to test seven treatments, plus a control, in 8 blocks of colonies. The treatments were Fumagilin-B in syrup, Fumagilin-B manufacturer suggested drench, Fumagilin-B strong drench, Fumagilin-B in pollen patty, thymolated syrup, and HoneyBHealthy in syrup. The calculations for amount of active ingredient per frame of bees are shown in Table 1.
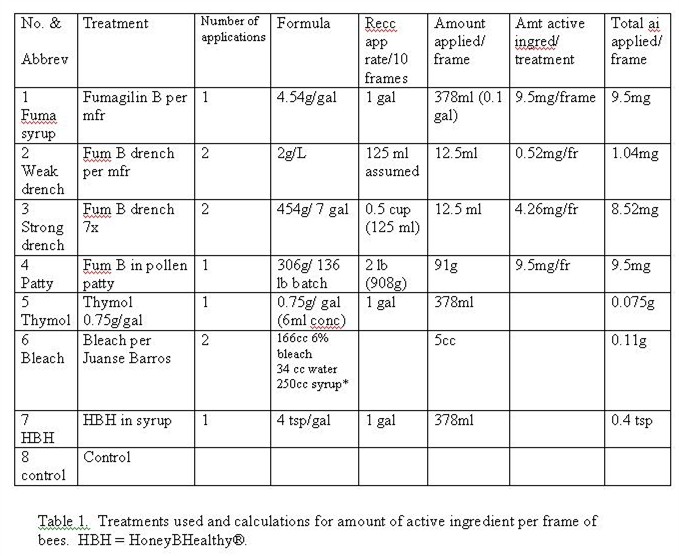
Table 1. Treatments used and calculations for amount of active ingredient per frame of bees. HBH = HoneyBHealthy®.
The amounts of treatments applied per colony are shown in Table 2.
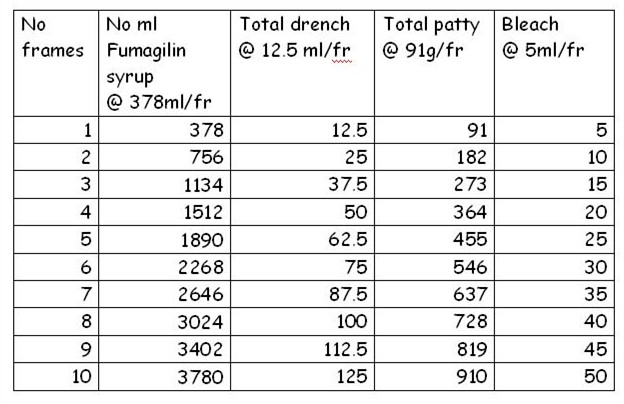
Table 2. Amount of treatment applied per colony, based upon observed frame strength at time of treatment.
Colonies were graded for frame strength on December 15 at 55ºF or above, and samples of approximately 50 bees were taken from the entrance of each. It was necessary to kick the hives and blow into the entrances to get enough bees to walk out. Mean frame strength was 4.5 frames (range 2-10)—many colonies were faring poorly, in retrospect it appears to be due to some sort of disease affecting the brood.
On December 27 (~40ºF) treatments were applied. The colonies were tightly clustered, although the bees had flown considerably two days previously. No pollen was coming in. The syrup feedings were given in ½ gal Mason jar top feeders. The drench treatments were dribbled over the bees. Pollen patty treatments were placed on the top bars in the centers of the clusters.
Drench treatments (numbers 2, 3, and 6) were repeated January 5, following a strong rain and wind storm (which blew the lids off two colonies, subsequently removed from the trial).
Colonies were left undisturbed until February 25, following extended cold, wet weather. Entrance samples of bees were again taken, and all treatments again applied. Drench treatments were repeated on March 3, following weather in the high 60’s with good flight.
On April 3, final bee samples were taken. A number of colonies were deadouts with patches of brood. Some colonies had so few surviving bees that samples needed to be taken from inside the hive, which was noted for analysis. On the other hand, fourteen colonies (22%) were strong enough to require immediate supering. The strongest treatment correlation for supering was with pollen substitute fed colonies (4 out of 8, but one of the 8 that didn’t grow didn’t eat their second patty), and with HoneyBHealthy (3 out of 8). Approximately 36 of the 62 colonies in the trial were strong enough in April to survive and build.
Results
Mean survival of colonies (arbitrarily set at 4 frames or stronger) at April 3 was 50%. Highest survival (88%) was in the pollen substitute/fumagillin group; lowest survivals were in the untreated controls (38%) and in the bleach treatment (25%). The data of this trial are shown in the Appendix.
The colonies showing the least amount of strength loss from December 15 to February 25 were the group fed pollen substitute plus fumagillin. By April 3, mean colony strength had generally rebounded to approximately their starting strength for most groups. The notable exceptions were the pollen substitute/fumagillin group, whose mean strength increased by 227%, and the bleach group, which had only recovered 64% of their original strength.
On the average, 3 colonies in each group of 8 were over 8 frames on April 8. Only two groups were marginally better (to 4 colonies out of 8)—the pollen substitute/fumagillin and HoneyBHealthy. However, two of the HoneyBHealthy colonies had started at 10 frames, so I don’t feel that HoneyBHealthy’s performance in this regard was notable.
Dr. Nancy Ostiguy generously volunteered to have a student perform nosema spore counts of the bee samples. Unfortunately, they were not complete by the time of this progress report.
The great variability of colony performance likely precludes any statistical significance, but I will run statistics when the spore counts are completed.
In April, I spot-checked a large proportion of the surviving colonies for nosema levels. The majority were still infected in the range of a few million spores per bee. I only found one colony that had few spores. Despite this infection, most of the colonies that survived the winter went on to produce honey, and in several cases, to produce swarms. The bees in the swarms that I captured all ran at infection levels of a few million spores per bee.
However, not all colonies built up. Several colonies continued to dwindle, or stayed stuck at about 4 frames for most of the season. I could not find any correlation between colony strength and buildup and nosema levels. The one observation that stood out was that those colonies that did not build up generally had spotty brood, and sick larvae and pupae. The symptoms were generally EFB-like, or sacbrood-like, but it isn’t clear that those diseases were actually the cause.
I sent samples of sick bees to Dr. Jay Evans at USDA, Dr. Nancy Ostiguy at Penn State, Dr. Michelle Flenniken at U.C. Davis, and Dr. Jerry Bromenshenk/Dave Wicks at BVS. The three report results back to date are shown below.
Results from Dr. Jay Evans
Sample 1 Sacbrood virus, possible N. apis
Sample 2 none
Sample 3 ABPV, BQCV, EFB
Sample 4 low sacbrood, low AFB
Sample 5 low sacbrood, EFB, Nos. ceranae
Sample 6 BQCV, Nos. ceran
Sample 7 BQCV, DWV, IAPV, Nos. ceranae

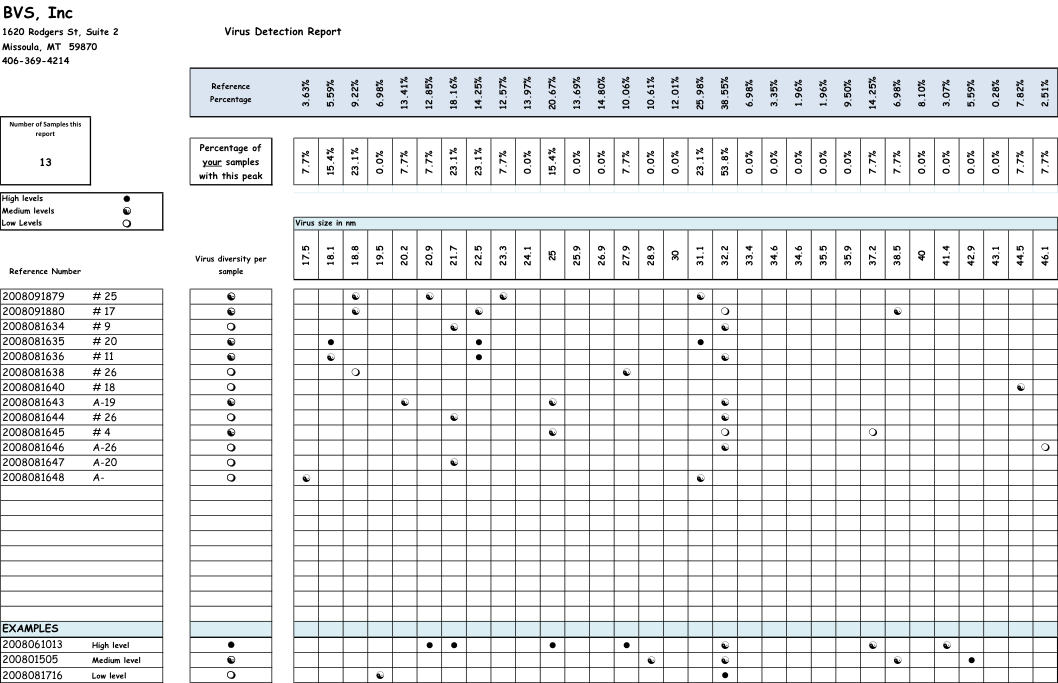
Dr. Evans and Dr. Flenniken did not find any particular viruses of interest, since the viral profiles were in the normal range. Dave Wick noted that the viral profile was unusual for my samples, but BVS has not yet put names to their virus spikes. Dr. Ostiguy is running primers for EFB, but the report is not yet back.
Discussion
The first item of note is an inherent problem with running this sort of trial in California—that is the lost income due to almond pollination. The colonies in this trial could have easily been combined in February into 20 colonies that would have brought in $170 each in my contracts; I suffered a $3400 loss of income by continuing this trial through almond bloom.
Until I get the nosema counts back from my collaborator, I really can’t come to any conclusions about the effects of treatments upon nosema levels, nor the effects of nosema infection upon colony survival or production. However, I can make a few observations at this time:
1. Preliminary sampling indicated that none of the treatments eliminated nosema infection. This includes four methods of applying fumagillin.
2. The most effective treatment appeared to be the feeding of pollen supplement/fumagillin. However, it appears that it was likely the supplement, rather than the fumagillin, that produced the benefit. This hypothesis is supported by recent work by Dr. Frank Eischen.
3. After winter, colony buildup and survival appeared to be unaffected by nosema infections in the low millions of spores per bee. By October, strong honey-producing colonies still were running at 5-7 million spores per bee. Buildup and honey production in the infected colonies matched those of uninfected colonies in nearby yards.
4. The main factor that I could observe that resulted in poor buildup was the presence of unidentified brood disease. To date, the specific causal pathogen(s) have not been identified. Limited experimentation with treatment with tylosin appeared to help some colonies, which indicates that bacteria may have been involved.
5. No signs of colony collapse following “false recovery” were observed. In my test yard of approximately 45 colonies the summer, I did not observe nosema infection in any colonies progressing beyond 7 million spores per bee. Beekeepers in other areas have reported N ceranae infections to increase to levels that cause colony collapse. I have no idea why this did not occur in my test yard.


