
Mite Control While Honey is on the Hive: Part 2

February 21, 2021
Mite Control While Honey is on the Hive
Part 2
First Published in ABJ December 2020
Randy Oliver
ScientificBeekeeping.com
Last month I covered the setup of my field trial of summertime mite treatments, including experimental extended-release oxalic acid in glycerin. I’ll now share the results.
The Results and Discussion
Due to space limitations, it’s going to take me at least two articles to share the results of this and related field trials, so I’ll combine the results and discussion sections, eventually with a final wrap up of what I’ve learned to date.
I’m going to show you at least two graphs of the results for each treatment group. Initial mite counts were taken on June 16-17; due to climbing temperatures we delayed applying the treatments, but once a week had passed, I decided that we needed to treat on June 23 despite the heat. Midpoint counts were taken on July 12-13 (19 days after application of the first treatment, 26 days after the initial counts). We took end point counts 23 days later on August 4-5 (49 days after taking the initial mite counts; 42 days after application of the treatments).
For the midpoint assessment, I didn’t want to take mite washes of all 260+ hives, so I selected what I considered to be “representative” hives from each treatment group at each of the seven test apiaries (“representative’ hives being those with bees in both brood chambers, as well as moderate to high starting mite counts).
Notes: For each treatment group I will first show a line graph of the mite counts for only those hives chosen for midpoint assessments, followed by a column graph of the final results for all hives in the treatment group. Explanations for each graph type are at Figs. 1 & 2. For this entire series of articles, all “counts” are for the number of mites washed from a sample of a half cup of bees (roughly 315 workers) shaken from a frame adjacent to brood (generally from the upper chamber).
The Untreated Control Group
The Control hives were intentionally colonies with starting mite counts in the 10-20 range.
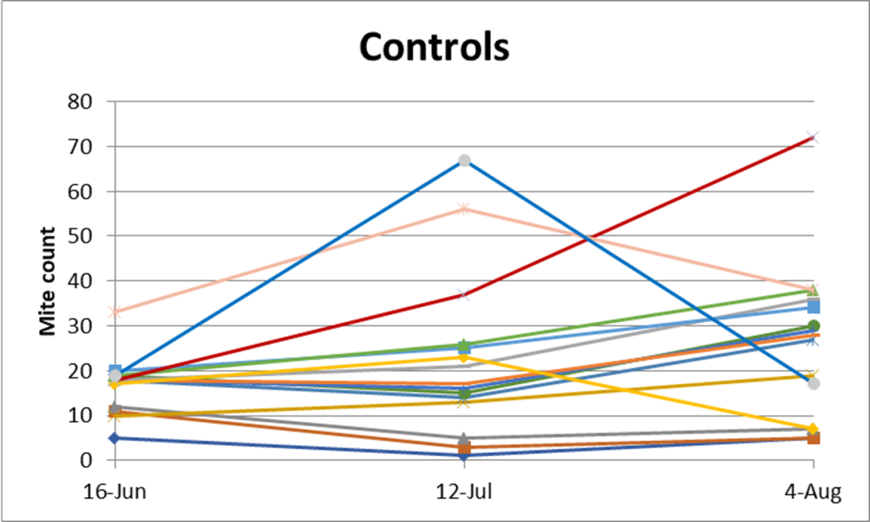
Fig. 1. Instead of more-appropriate step graphs, I’m showing line graphs (all to the same scale), since they make it easier to visualize the changes in mite counts for a number of individual hives. So keep in mind that the lines represent only the overall change in mite infestation rate from on data point to the next, not what happened in between. In most of the chosen Control hives, the mite infestation rates did not change much during the first half of the trial, but then climbed higher during the last half. Remember that the counts for these graphs are from only a few of the hives receiving each treatment, not the entire treatment group (which is shown below).
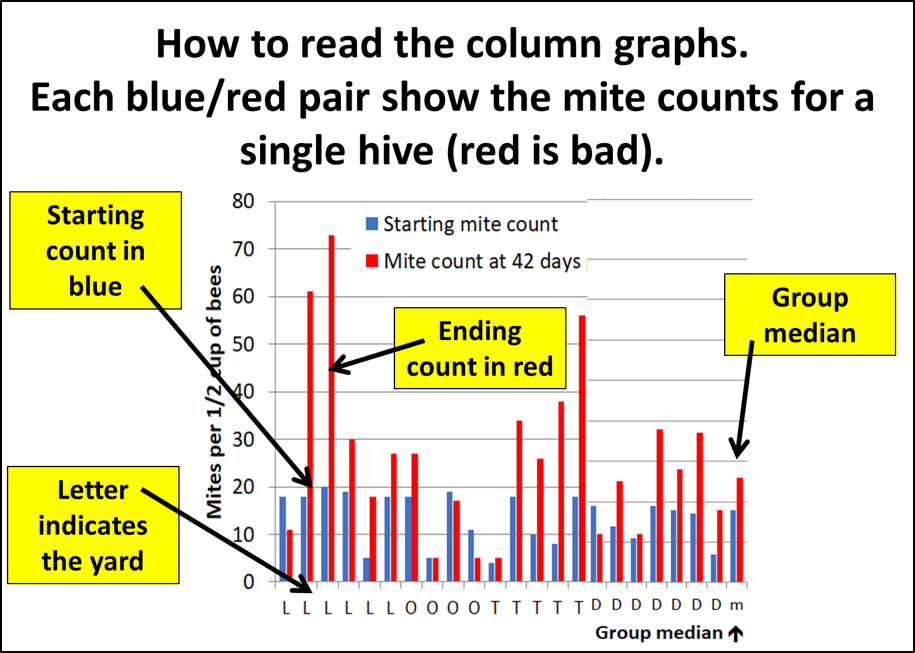
Fig. 2. Rather than throwing a bunch of boxplots, ranges, statistics, and error bars at you, I’ll give you the straight results for every colony, which allows you to visually pick out patterns for yourself – such as the degree of variability, outliers, and yard effect. All the graphs are to the same scale for easy comparison.

Fig. 3 As you can see, there’s a lot of red in the Control group – indicating that mite counts went up – to slightly over 1½ times their starting counts. The group median value means that half the counts went up more, half less (as opposed to means, which get skewed by outliers). You can see why I limited the Control group to fairly low starting counts, since several of them really shot up over the course of 49 days (although just to confuse things, a few went down).
Side note: mite counts can go to shocking levels if a treatment fails – our highest ending count in this field trial was a staggering 274 mites on a half cup sample of bees (not shown, and not in the Control group).
Practical application: Since the mite counts in the Control group went up by a median 158%, this expected increase allows us to later estimate the efficacy of each treatment by comparing its group’s change to that of the Control group.
Formic Pro – 1 strip, repeated after 10 days
There are two options for application of this formic acid vapor treatment: (1) placing two strips at once, or (2) applying only one strip, then another after 10 days. We tested both methods. Unfortunately, the weather heated up after taking our initial mite wash counts, but as with many beekeepers suffering from a warming climate, we still had to deal with mites. The daytime temperatures on the day of application were in the 90’sF — well above the recommended temperature. So I decided that this was a good opportunity to see what would happen if we applied Formic Pro under hot, low-humidity conditions.

Fig. 4 The repeated single-strip treatment with Formic Pro greatly reduced most of the mite counts. Encouragingly, there was little mite increase after treatment. Again, the lines do not reflect the immediate impacts of treatment, only the results at two time points well afterwards.

Fig. 5 Mite control for the repeated single strip option was quite good, except for in the “L” yard, in which the lack of reduction was in stark contrast to that in the rest of the yards (and in contrast to the excellent control in the same yard when two strips were applied on the same day at the same time – Fig. 7). Even including those hives in which the mite count went up, the overall median reduction in mite counts for all hives in the test group was to only 17% of the starting count – very impressive!
Practical application: The rationale for repeating the treatment at 10 days is that it kills mites that have emerged from the brood.
Scientific note: You can see why it’s important to replicate any trial in various yards and under different conditions. What I’ve learned from field trials is to expect the unexpected, that there will be anomalies and outliers, location and weather can be important, stuff (such as errors) happens, and that there is always large colony-to-colony variability that may make it difficult to tease out the signal from the noise.
The poor performance of Formic Pro in yard “L” was clearly an anomaly. I have no explanation, but suspect that it may be related to the fact that it was the first yard to which treatments were applied, and I had conscripted a small group of visiting beekeepers as helpers to apply them – could it have been some detail during their learning curve?
Practical application: It’s all in the details. Why would a treatment work poorly in the first yard, but so well in next six? I strongly suspect that we can’t blame it on the product, but perhaps upon some detail of how the strips were handled prior to placement. I clearly need to repeat this particular application method to figure it out.
Formic Pro – 2 strips applied at once, during hot weather
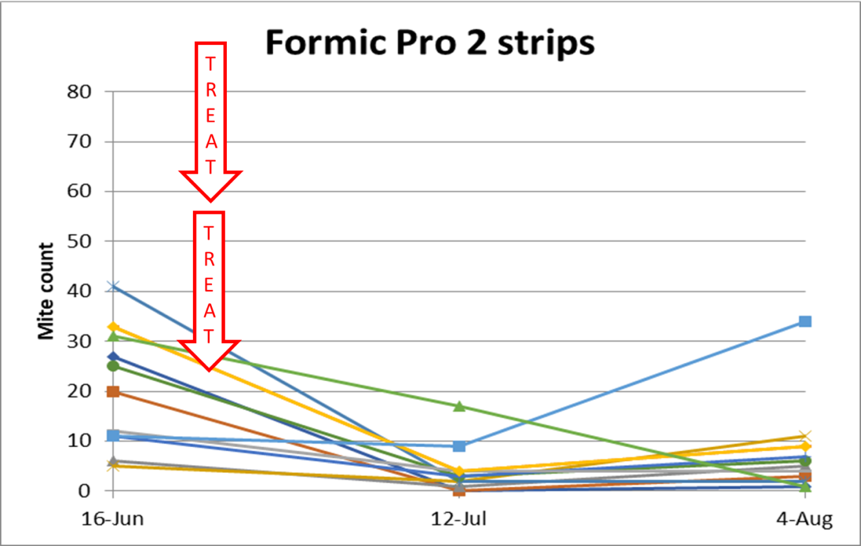
Figure 6. I expected that the intense two-strip application would result in greater mite kill under the cappings, and thus better efficacy. That did not appear to be the case.
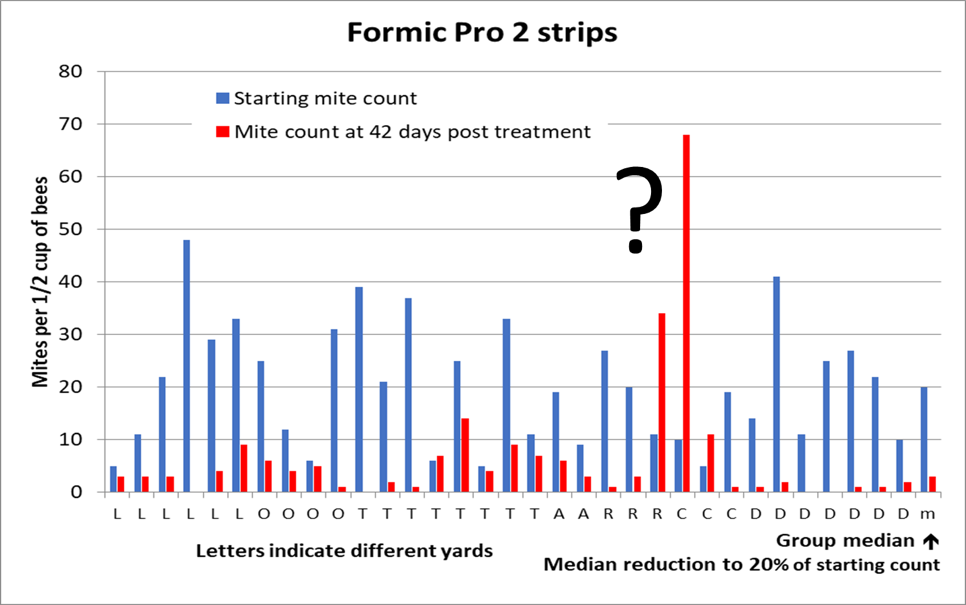
Fig. 7 Two strips of Formic Pro gave good mite control in all but 2 hives out of 33 – for a median reduction to only 20% of the starting count. Why the failure in those two hives I have no idea.
Note: In these column graphs, if there is no red visible immediately to the right of a blue starting count column, that means that the ending mite count was zero. The median reduction figures may be misleading, since for both Formic Pro treatment groups the median starting and ending mite counts happened to be the same – 20 mites to start, 3 mites at the end.
I had two questions about Formic Pro besides its efficacy: (1) do colonies recover more quickly from the 2-strip treatment, since it causes only a single brood break, and (2) is the repeated 1-strip application easier on the queens? Due to space limitations, I’ll need to leave the answers ‘til my next article.
Those Danged Outliers
In Figure 7 there are two outliers – colonies in which mite counts after treatment went way up, instead of down. This occurs, regardless of treatment type, in nearly every large apiary or experiment, for unknown reasons. We just need to deal with that fact.
Hopguard 3
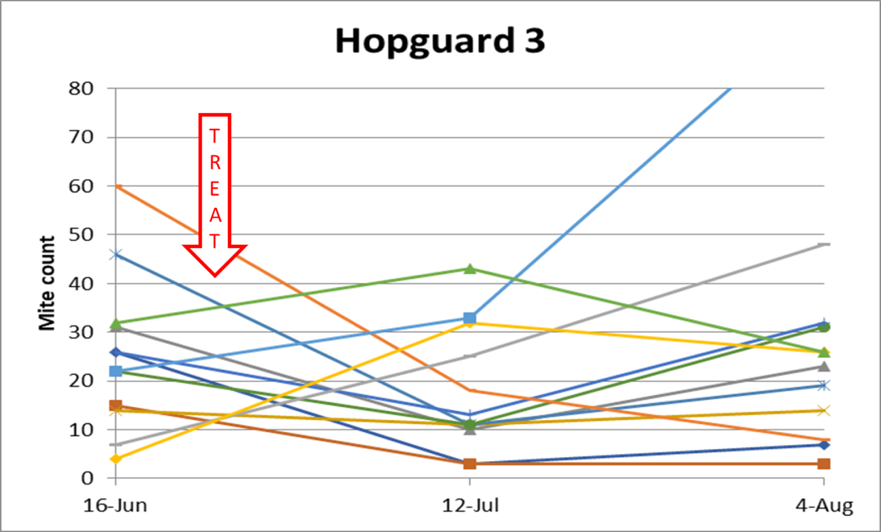
Fig. 8. Hopguard 3 gave a quick, but inconsistent, knockdown of the mites. Unfortunately, I found the label to be unclear as to whether it was recommended or permissible to repeat the application during the honey flow (as specified for fall treatment). I’ve since confirmed that it’s OK to do so. Since the midpoint results indicated substantial effect from treatment, I didn’t reapply Hopguard 3 strips to any hives. In retrospect, I wish that I had done so.
Despite the impressive mite knockdown shown in Fig. 8, it was clear by the end of the trial that a single application of Hopguard 3 was inadequate for mite control during summer. I’ve since spoken at length with Fabiana Ahumada at BetaTec in order to clear up my understanding of the label, and plan to repeat the test next season, but with repeated treatment. There is no need to show the results of this test, since because I did not apply retreatments I did not give Hopguard a fair shot.
Practical application: Due to the Hopguard’s rapid knockdown of mites, non contamination of honey, and lack of adverse effects on queens (to be shown later), I feel that it can be a viable tool for varroa control (and used it myself later in two other field trials this season). I look forward to testing it again next season.
Extended-Release Oxalic Acid in Glycerin
The main purpose for this large field trial was to compare the efficacy of extended-release OA to that of the two treatments currently registered for varroa control while honey is on the hive — Formic Pro and Hopguard. I tested three different application methods of OA/gly Let’s see how they performed.
OA/gly – 2 half Shop Towels 1:1 ratio (18 g OA in total)

Fig. 9 Similar to my findings in previous trials, there is little reduction in the mite infestation rate from OA/gly towel application during the first few weeks of treatment (despite an increased mite drop, not shown). Extended-release OA takes several weeks to attain full efficacy.
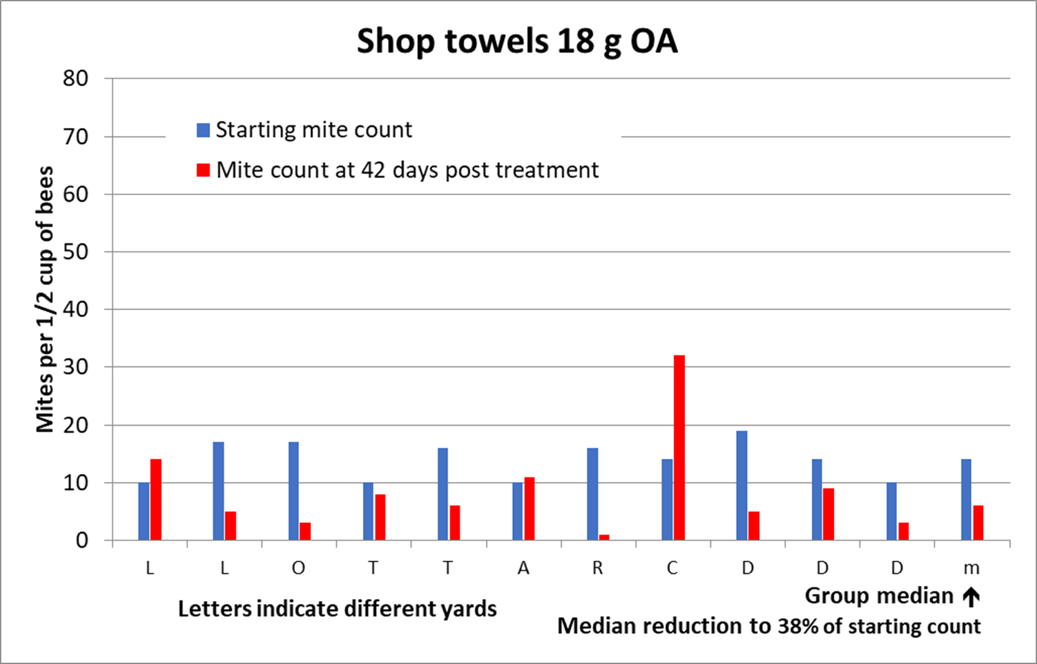
Fig. 10. For the shop towel application method I intentionally picked colonies with starting counts similar to that of the Controls for comparison in the efficacy calculation. At 42 days post application, mite counts had dropped to lackluster 38% of starting, but from previous experience I would expect them to continue to decline.
OA/gly – one 3½” x 8” cellulose sponge (25g OA in total)
What I was hoping for is that using cellulose sponges as the delivery matrix of OA/gly might help to increase efficacy in both the short and long term.
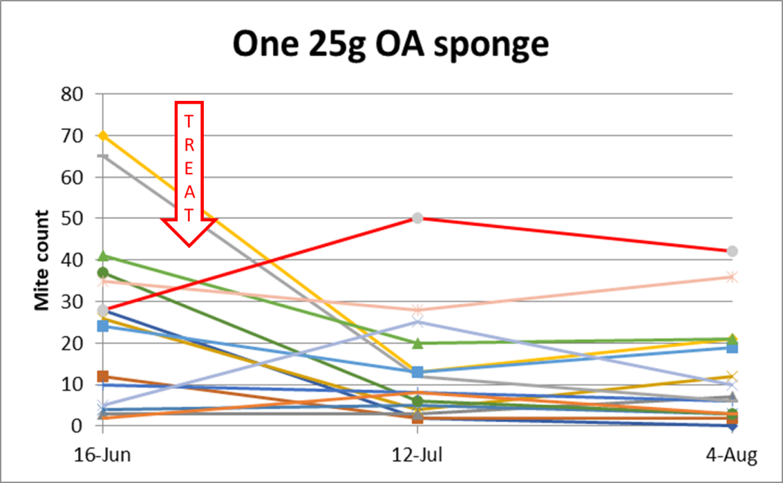
Fig. 11 The single-OA/gly sponge treatment exhibited greater initial reductions in the hives with high starting mite counts than in those with low counts (which may help to explain the poor performance of the shop towels). The reductions in mite counts above were not impressive.
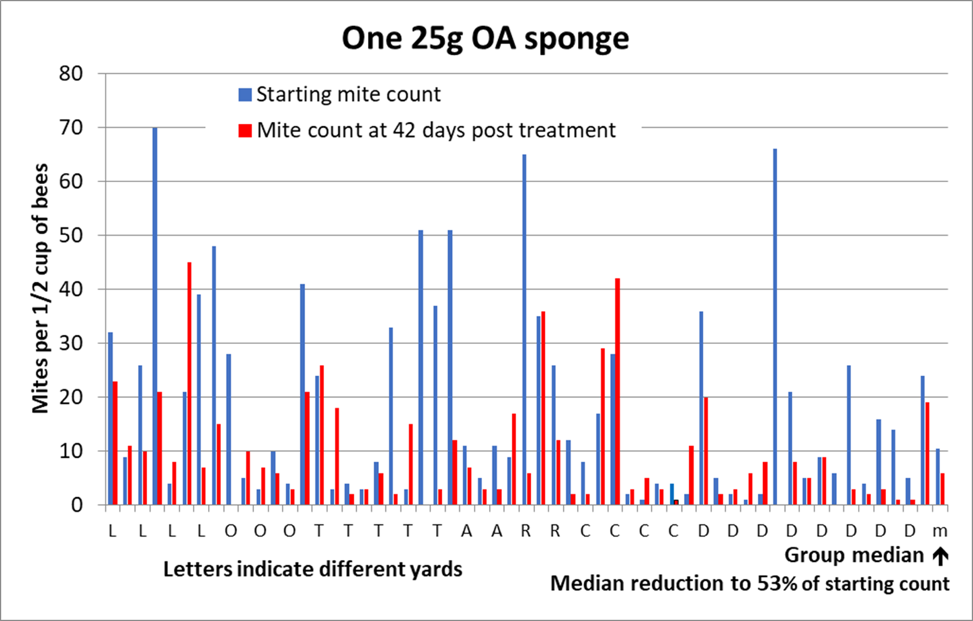
Fig. 12 The most striking observation is that the one-sponge application really brought down most of the extremely high mite counts. But for the low-mite hives, the results were not as impressive. Overall, the single sponge treatment dropped the mite counts to roughly half their starting number.
OA/gly – Two 3½” x 8” cellulose sponges (50g OA in total)
So what happens if we double the number of sponges applied?
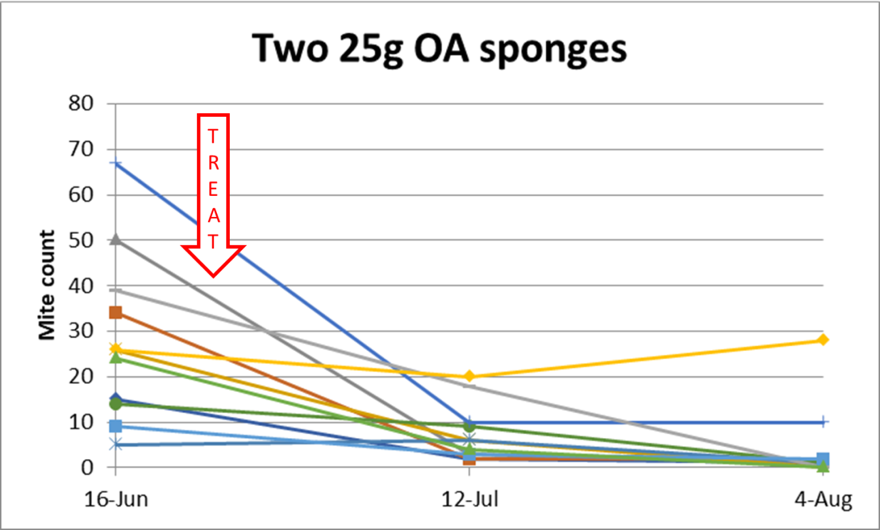
Fig. 13 Now we’re talking. Look at those ending counts! I’ll discuss why the difference later (it wasn’t due to the amount of OA).

Fig. 14 Bingo –that’s a lot of blue! Other than the few outliers, the two-sponge treatment was the best treatment of all, with the median ending counts being only a tenth of the start. Despite the average (mean) starting count for this test group being 25 mites, half the ending counts were of 2 or less – not bad.
Extended Treatment
The results from two OA sponges look really good – but had they yet achieved full efficacy? I left the sponges in a number of the hives that still exhibited appreciable mite counts (some from which I’d taken midpoint counts) until the treatment had been in the hives for 72 days, and then took mite counts again (Figure 15).
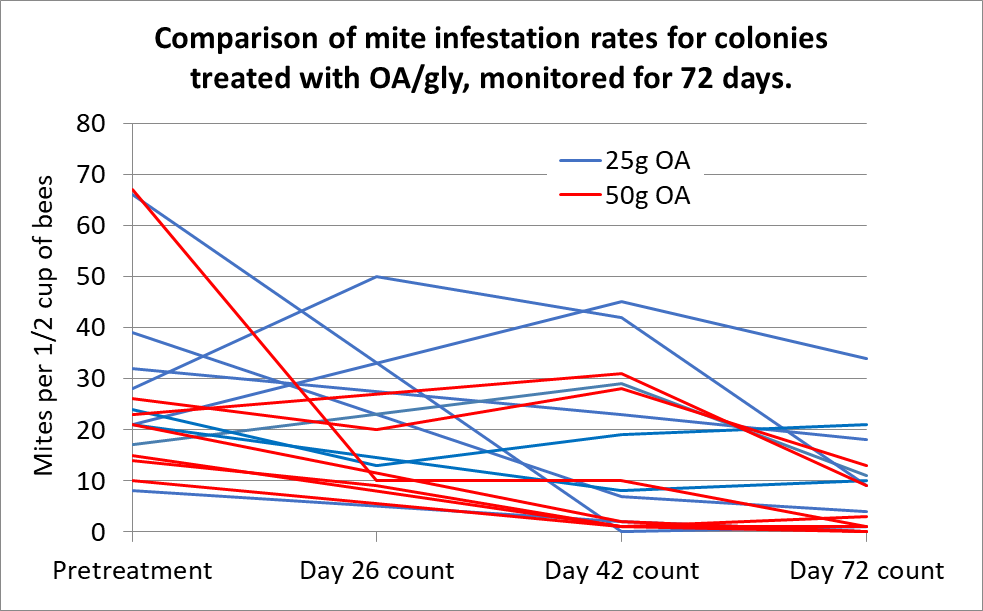
Fig. 15 Oxalic acid in glycerin is a long-term treatment, which just keeps on working when applied in two sponges – note the downward trend of the red lines over the last 30 days.
Practical application: Although the 2-sponge treatment gave decent initial mite knock down, it’s really a long-term treatment, taking some time to reach full efficacy.
Next month I’ll show more exciting data. These results are yet another step in my quest to find the best delivery method for extended-release oxalic acid – I can already tell that it’s not going to be shop towels or the sponges that I used in this trial, nor a 50-gram dose.
Efficacy Calculations
As always, a researcher can pick and choose methods for calculating efficacy of treatments. I prefer to use the Henderson-Tilton formula, since it compares the change in pest prevalence in a Treatment group to the increase in the Control group, setting the Control efficacy at zero. That said, there are different metrics that I can input into the formula. So I calculated efficacy in two ways (Table 2):
Sum of mite counts: I added up the totals for each Treatment group’s starting and ending mite counts to compare overall reduction in mites for each entire group.
Median mite counts: I calculated the median starting and ending mite counts for each Treatment group in order to get a feel for the yard “average” (the median being the midpoint).
Note: Technically, since the Control colonies started with lower mite counts than many of the Test colonies, we must take the efficacy calculations with a grain of salt (other than for the shop towels). However, it’s not the absolute values that are important, but rather the comparison of the efficacy values of the various treatments to each other.
That said, let’s look at the calculated efficacy values (Table 1).

Cautionary notes: Due to poor weather earlier in the season, the colonies in this trial were not strong – starting at about 8-10 frames of bees. So the absolute values for efficacy of treatment below may not apply to strong colonies stacked with honey supers. That said, what I was interested in was the comparative efficacy of the various treatments and application methods.
Practical application: The OA/gly two-sponge application method clearly kicks butt! But it gets even better, as you’ll see next month.
The Effect of Starting Count
Just to be sure, I also calculated efficacy values for each group to see whether there was a difference between the half of the hives in each test group with higher starting counts vs. those with the lower starting counts. There was no appreciable difference (not shown).
But then I noticed that there appeared to be a relationship between colonies in which the mite counts went up after treatment, and the starting mite level. So I plotted out scattergrams of the amount of mite increase or reduction vs. the starting mite count (Figure 16).

Fig. 16. I compared the increase in infestation rate over the 49 days by its multiple value (a multiple of 2 meaning that the mite count doubled), against the starting mite count for each hive. The green dotted line (at a multiple of 1) indicates no change, so data points below it mean that the count dropped, often to zero. Note that for all groups other than the Controls and two OA pads, that mite counts skyrocketed pretty much only in the less-than-10 count hives, despite treatment.
The above pattern seems counterintuitive – that the treatments were ineffective in the colonies with the lowest starting mite counts. I have no explanation.
Practical application: The above scattergrams validate the efficacy estimates. But they still leave me scratching my head!
The Label is the Law
Hold your horses! The extended-release application method is not yet approved by the EPA. Until then, it is not legal to apply OA by this method for mite control, and I do not in any way promote beekeepers doing so. In my next article, I’ll report upon USDA’s progress towards registration of the application method.
To Be Continued
Next month I’ll cover the effects of treatment upon colony performance and queenrightness (notably the effect of formic treatment in hot weather), as well as more results from this and other trials of OA/gly sponges that we ran this summer, plus some previous yet-unpublished research of mine on extended-release OA.
A teaser: although the two sponges held 50 g of OA between them, only a fraction of that actually got released into the hives – at the end of the treatment period, most of the OA still remained in the sponges, never have gotten distributed to a bee or mite. So don’t get hung up on the 50-g dose, since it doesn’t take much OA, properly delivered, to control varroa.
Practical application: it’s not about how much OA is applied in the delivery matrix; it’s only the amount of OA that gets to the mites that makes any difference. Stay tuned…
This is Beekeeper-funded Research
This field trial was tedious (we took and counted 589 mite washes in all, many with counts well above 50 mites), costly in materials and labor, and involved the loss of many colonies due to failure of treatment. My work is supported entirely by donations from beekeepers, which allows me independence from any company or restrictions by administrators – I work for the benefit of beekeepers alone. You can support our research by donating at ScientificBeekeeping.com. Thanks!


