
The Varroa Problem: Part 14- Virus Dynamics and Treatments

February 18, 2018
Contents
The problem with waiting too late to treat. 1
Virus dynamics and miticides. 3
the proportion of mites that are in the brood. 5
The Varroa Problem: Part 14
Virus Dynamics and Treatments
Randy Oliver
ScientificBeekeeping.com
First published in ABJ January 2018
Having a model for varroa population dynamics also helps us to better understand how our mite management strategies should actually be centered more around the prevention of virus epidemics.
The problem with waiting too late to treat
As discovered by Dr. Stephen Martin [[1]], it’s not so much varroa that’s the problem—rather, it’s the mite-transmitted viruses, notably Deformed Wing Virus (DWV) and the “Acute-Kashmir-Israeli virus complex” (AKI). DWV is always present, but typically exists as a delicately-balanced covert infection in the worker bees. It’s only when the bees are stressed by the wounding and inoculation by the mite that the infection tips from the covert state to the overt state, eventually causing an in-hive viral epidemic that typically results in the collapse of the entire colony. There appear to be two tipping points involved:
- The first tipping point occurs when the virus infection level in an individual pupa or adult exceeds 70 to 80 million (107) viral copies—at which point the virus goes rampant and causes illness or death [[2]], and then
- When either the in-hive mite infestation rate of the adult bees reaches roughly 15 mites per 100 bees, or when more than a quarter of the brood becomes infested by mites–
- at which point the virus(es) overwhelm the colony-level immune defenses and we begin to see the signs of Parasitic Mite Syndrome (PMS).
In order to illustrate how these are linked, I reworked some data from a useful study by Francis, et al (Fig. 1).
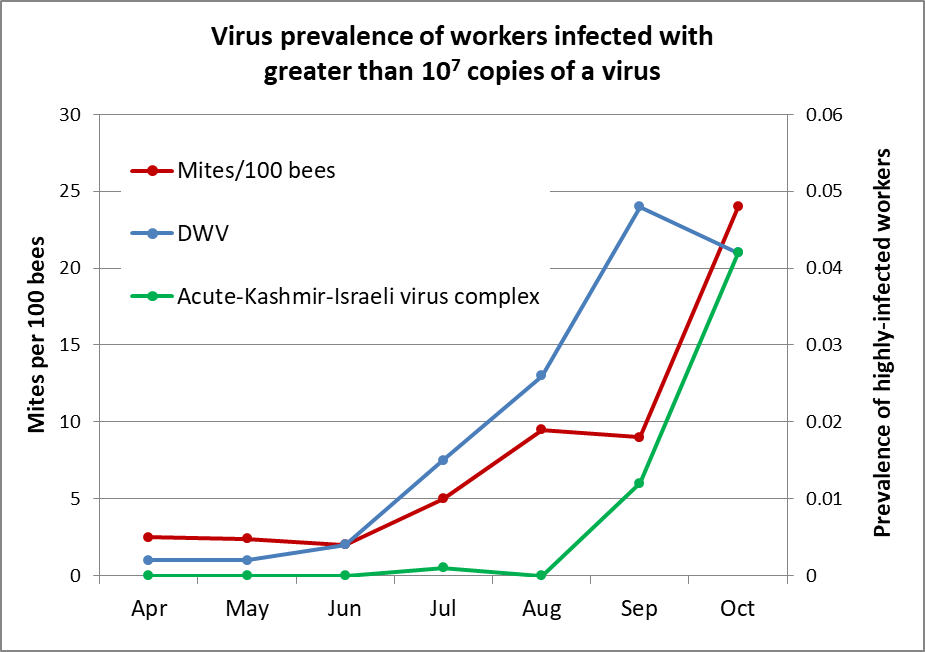
Figure 1. A graph of the development of virus epidemics in untreated hives relative to their mite infestation rates. The curves above track the prevalence of highly-infected bees only. Note how closely the percentage of virus-sickened bees corresponds with the mite infestation rate. Data reworked from Francis [[3]].
This has a lot to do with late-season mite management. A recent study by Dr. Barbara Locke [[4]] found, as have others, that DWV was endemic in the bee populations of their monitored hives throughout the season, but that the bees generally kept the virus in check (below 108 copies per bee, and not causing symptoms). It was only when the infestation rate of the mites on the adult bees rose to the equivalent of about 15 mites per hundred bees (~ 45 mites in an alcohol wash), that DWV surged out of control, and increased a thousand-fold in the bees’ bodies (to 1011 copies). What I found especially of interest is that even pupae not infested by a mite were typically infected with DWV, again at “subclinical levels” [[5]]. But when the infestation rate of the adult bees went up, DWV exploded in the uninfested pupae as well.
Practical application: this finding answers a long-held question of mine—why I see prepupae and white-eyed pupae dying in the brood combs when mite counts climb, despite the fact that they were too young to have developed disease in response to being bitten by a mite. Locke’s findings agree with my observations in my own hives—that once alcohol wash counts pass about 45 mites, I start seeing the first signs of PMS. These dying pupae may be symptomatic of either DWV or a paralytic virus.
Locke points out how critical it is to reduce the virus vector (the mite) in the hive at least 6 weeks prior to the colony rearing the brood destined to become “winter bees.” She also out that in her treated colonies, reinvasive drift of mites from other hives increased the mite counts during September.
Practical application: you gotta get mite counts down by the end of August (or more precisely, two months before the expected formation of the winter cluster)! And then continue to monitor your hives to make sure that they’re not getting reinfested from outside. This reinvasive drift of DWV-infected mites from other apiaries is a curse to beekeepers in a number of urban and suburban localities. Even after getting mite counts down by the end of August, beekeepers in those areas may require additional measures to prevent an upsurge in in-hive DWV epidemics in autumn.
Virus Dynamics and Miticides
One of the benefits of using the model is that it calculates the mite infestation levels of both the adult bees as well as that of the brood. This is where you really need to understand the epidemiology of DWV in the hive, perhaps best explained by Dr. Stephen Martin [[6]]:
In spring, when the honey bee colony undergoes rapid expansion, those mites which have survived over winter start to reproduce. During this period, the prevalence of DWV in both the mites and bees is at its lowest level. As long as the bee population expands at a rate greater than that of the mite population, the relative proportion of individual bees infected by DWV grows only slowly. This is because the probability of a mite feeding on an infected adult bee is low due to the large numbers of newly emerging bees… In temperate regions, honey bee colonies undergo a large reduction in their adult worker population in autumn as they prepare to over-winter. During this period the proportion of the infected adult bees and brood, and virus carrying mites all increase very rapidly.
… This greatly assists the transmission of DWV between mites, since the probability of encountering an infected bee, or entering a cell that already contains a mite carrying DWV greatly increases. It is now that the colony is under serious threat, since a high proportion of the emerging adult workers have a reduced longevity, and so will not survive the winter.
More recent research has shown that as mite levels increase, that there may be hybridization of different variants of DWV, leading to more virulent forms that are then transmitted and activated by the mites. This is currently a hot topic, and the science and taxonomy are not yet settled [[7]].
Practical application: as the mite level increases in a colony, DWV may become even more virulent. A late-season application of an extended-release miticide, or even repeated OA vapor treatments, may take too long to reduce the mite level enough to quash the DWV outbreak. And if you wait too long, the bees may not be able to deal with the stress of the treatment itself [[8]]. Keep in mind that it takes at least several weeks for a colony to recover from a varroa/virus infection and again begin rearing healthy brood. Take home: be proactive rather than reactive.
The question of timing
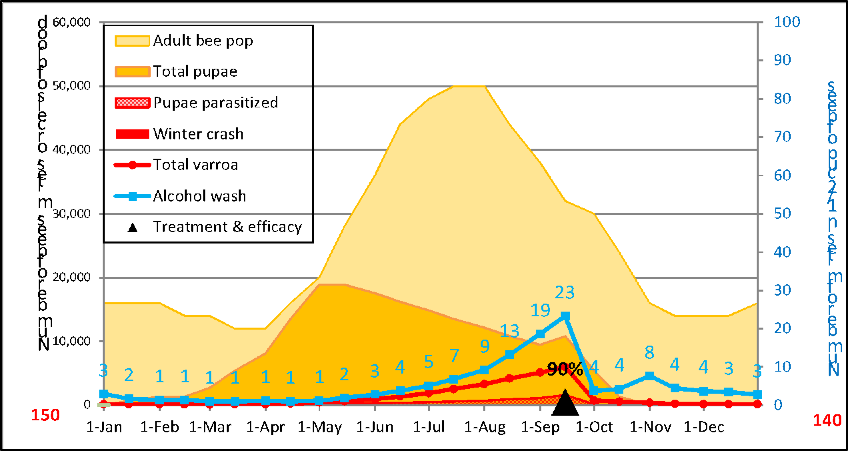
How many times have we heard, “killing a single mite in spring can prevent it from becoming hundreds of mites by late summer”? That’s true. But something that I find to be counterintuitive is that when we’re dealing with exponential growth–as with the buildup of the varroa population in a hive from early spring through late summer–that the timing of a treatment makes little difference in the final mite count (Fig. 2).
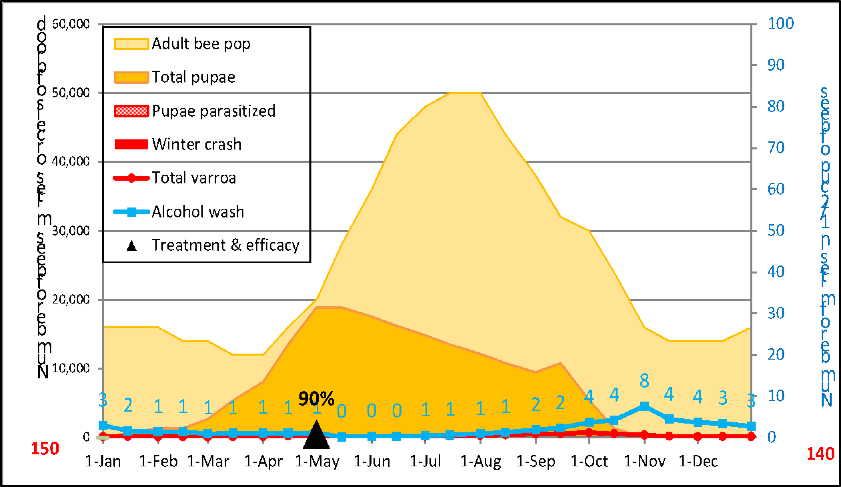

Figure 2. Two simulations, starting with 150 mites, r value of 0.021, with zero mite immigration, differing only in the application time point for a treatment that kills 90% of all the mites in the hive—applied at either 1 May or 15 Sept. Note that in both simulations the final mite count is a sustainable 140 mites. The big difference is that with the late treatment, the colony needed to deal with a large mite population all during the summer–peaking at nearly 6000 mites–as compared to the colony that received the early treatment, which barely reached 700 mites at peak.
Practical application: you may be able to get the mite count down with a late-season treatment, but by then the colony has been stressed by its high mite load, and there’s a good chance that DWV has already gone epidemic in the hive. It’s hard to see in the above graphs (the red area), but the model indicates that with the early treatment, that on 15 Sept only 1% of the worker brood was infested by at least one mite, compared with 15% of the brood being infested by the time of the late treatment. It’s that high rate of infestation of that late-season brood that leads to unhealthy colonies going into winter.
Note that in the simulations above I intentionally set mite immigration to zero, which is not the case for most hives. With even moderate mite immigration, the colony receiving the early treatment would be unlikely to make through the winter, whereas the colony receiving the late treatment would actually benefit by getting many of the immigrated mites killed.
the proportion of mites that are in the brood
Validation of the model
One of the beauties of the model is that it estimates for each time interval the proportion of mites that are hidden under the brood cappings. This is a straightforward calculation once you’ve determined the number of days that a typical mite would be phoretic (hitchhiking on adult bees). In order to do that, I am extremely appreciative of the monumental work by Dr. Willem Jan Boot [[9]], who found that the number of days of phoresy correlated strongly with the ratio of adult bees in the hive to the number of cells of 8-day larvae susceptible to invasion. This is because a mite does not actively seek a cell to invade, but rather rides on a nurse bee until that bee happens to stick its head into a cell containing a larva that is emitting the olfactory signal that it is ready to pupate—at which point the mite hops off its ride, and enters the cell.
My entire model is based upon that calculation, so you may ask, is it accurate? Of course I asked myself the same question, and validated the output by comparing it to hard field data from researchers who had tediously dissected thousands of brood cells, as well as measuring the total amount of sealed brood in each hive, amount of adult bees, and the infestation rate of those adults. Once you have that data, as explained by Harbo and Harris [[10]], one can then calculate the average number of days that a mite is phoretic (Fig. 3).
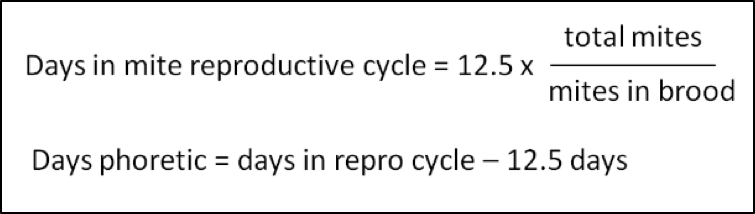
Figure 3. Counting the time from a foundress mite’s initial invasion of a brood cell, it takes roughly 12.5 days until the adult bee emerges, thus abruptly bringing any further mite reproduction to a halt. If you’re willing to go to the effort of counting the number of mites in the brood as well as the number of mites on the adult bees in a hive, you can then calculate the average number of days that a mite spends phoretic.
Back calculating from Harbo and Harris’ Table 2, for the colonies for which they did the above, the percentage of mites in the brood (during midseason broodrearing) ranged from as little as 33% to as much as 83% (the phoretic periods being 25 to 2.5 days, respectively). As they point out, the colonies with longer phoretic times tended to me more resistant to mite buildup, since mites can only reproduce when they’re in the brood. I also compared the model’s outputs to data sets from other researchers [[11]] and confirmed that the simulations were indeed realistic.
Using the model
The beauty of having a mite model is that it gives you a window into the hive, and under the cappings. So let’s take a look at what the model indicates what happens inside a hive over the course of a season (Fig. 4).
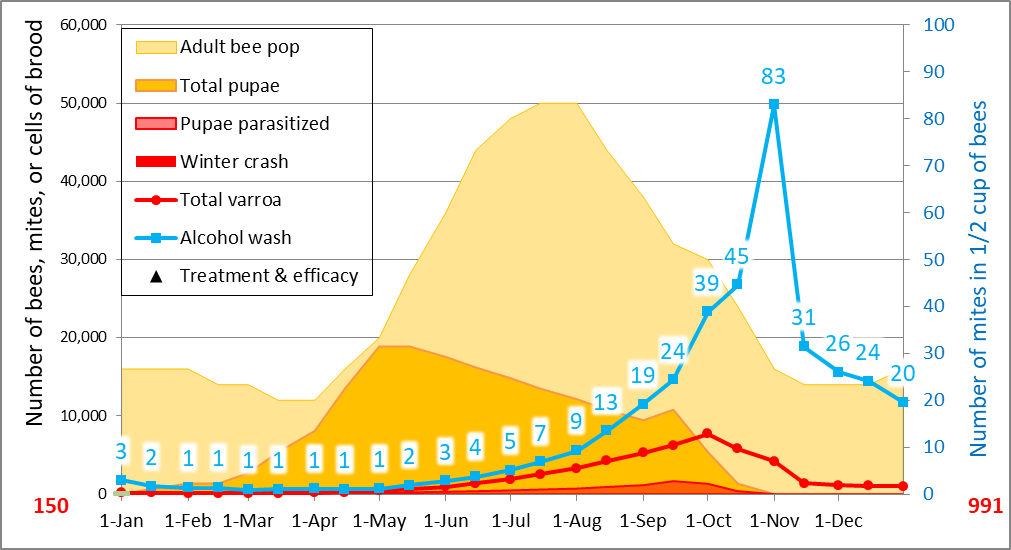
Figure 4. A simulation for a non-resistant colony, starting with 150 mites, low mite immigration, average overall r-value for the period from 15 April through 15 Sept of 0.021. I removed the crash indicator from this simulation, but the projected blue alcohol wash counts suggest that this colony had scant chance at making it through the winter, and even if it did, it would start the next season with an unsustainable 991 mites.
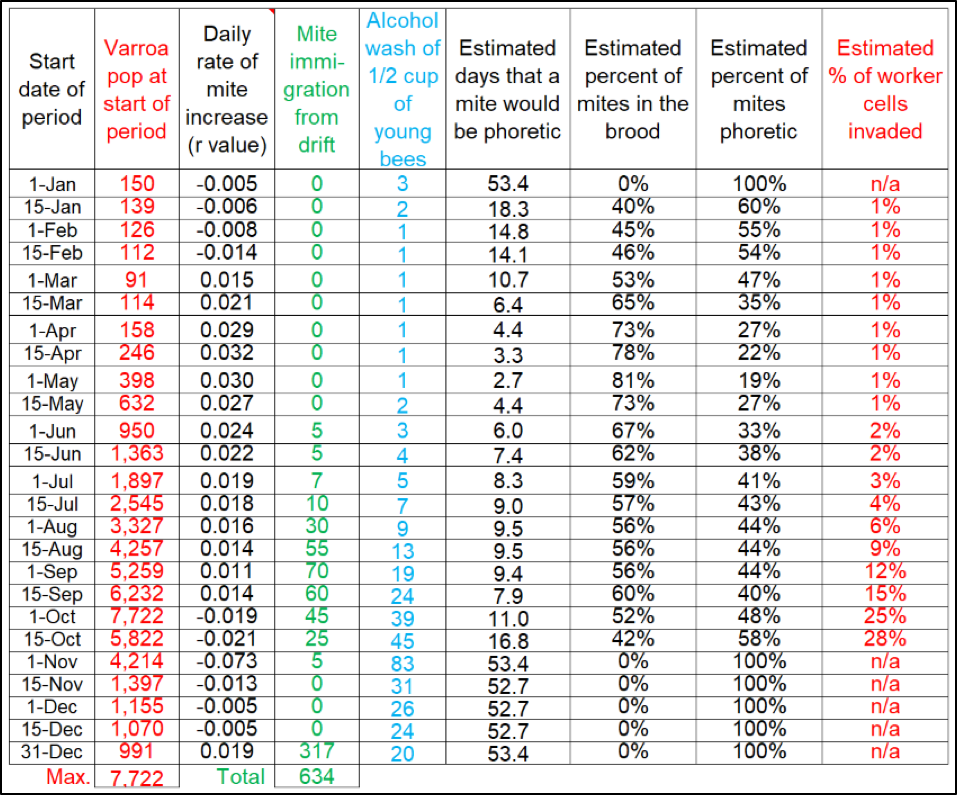
Below are the numbers upon which the above graphic was based, so let’s look at the number of days that the average mite would be phoretic, the percentage of mites in the brood, and the percentage of that brood that would be infested (Table 1).

Table 1. What’s happening behind the scenes. I created this table in order to illustrate the calculated relationships (during each time period over the course of a season) between the mite population, the alcohol wash count, the average duration of the mite phoretic phase, the percentages of the mites in the brood or phoretic, and the percentage of the brood that was invaded by at least one mite (colonies typically collapse once cell invasion exceeds 25-30%, due to DWV going epidemic).
Practical application: take some time to study the above table—you can learn a lot about varroa and virus management from it. Note how the alcohol wash underestimates the rate of mite buildup early in the season, since such a large proportion of the mites are in the brood (where they would also be safe from any treatment other than strong formic acid, drone trapping, or heat). Also note the very high rate of mite increase (r value) during spring, as compared to the rest of the season.
With regard to treatment, pay attention to the percent of the mite population that is safely hidden under the cappings at each time point—it is these mites that you must consider when counting on a treatment to reduce the mite population.
And finally, look at the last column to see the percentage of pupae being parasitized—the high rates in October indicate that this colony wouldn’t stand a chance at surviving the winter.
Efficacy of treatments
From the simulation above, you can see why most mite treatments must be applied as extended-release formulations, or reapplied over the course of a few weeks, since the mites are only exposed to the treatment for a few days each reproductive cycle. This is why the synthetic miticides (including amitraz) and Hopguard® work best as slow-release strips, and why thymol must be applied continuously over the course of about 20 days. Next month I’ll illustrate the effect of oxalic acid vaporizations.
Practical application: in general, the greater the percentage of mites that are in the brood, the less likely a treatment will be efficacious.
The problem with the bombs
I’ve done over 1,500 mite washes this season—and it’s given me an entirely different perspective on mite management! I now realize just how blind I’ve been as to how varroa is distributed through my operation. What I typically see is that about 10% of my hives could be called “mite bombs,” since for some reason or another they have three to five (or more) times as high a mite population as the yard average (median).
So let’s say that you’ve monitored a couple of hives in a yard, and saw that they had mite counts of about 9 in mid-August, which would indicate a need for treatment. A treatment with an efficacy of 90% would get those hives safely through the winter (Fig. 5, upper graph).
|

|
Figure 5. A tale of two hives. The upper graph reflects an “average” hive for the yard, for which a 90% efficacy treatment would give satisfactory results. However, one should not assume that all hives in the yard have similar mite levels, since some hives may need more help than others. The crash indicator for the lower hive was triggered by an excessively high infestation rate of the bees in the winter cluster.
The lower graph reflects what would happen with a high-mite hive that received the same treatment. You may have thought that you took care of varroa across the yard, but in actuality perhaps 10% of the hives—despite having 90% of their total mite population eliminated—might still contain enough mites after treatment to reinfest the rest of the yard. And that’s assuming that you actually killed 90% of the mites in the brood, which is unlikely in a high-mite hive.
Practical application: once I started identifying the bombs in my yards—and giving them special treatment [[12]]—mite control suddenly became much easier. Too much work? It takes me and a helper well less than an hour to mite wash a yard of 30 hives. By doing so, we can identify and save the few problem hives, as well as preventing them from reinfesting the rest of the yard. The time spent in mite washing more than pays for itself in healthy hives for almond pollination the next February.
Coming next
Next month, I’ll model the effects of mite treatments.
Acknowledgements
Thanks as always to Pete Borst for research assistance, and to all the dedicated and hard-working bee researchers from whose publications I draw useful information.
Notes and Citations
[1] Martin, SJ (2001) The role of Varroa and viral pathogens in the collapse of honeybee colonies: a modelling approach. Journal of Applied Ecology 38: 1082 –1093.
[2] This tipping point for the immune system is well described by Nazzi, and appears to be triggered by the feeding activity of one or more mites upon a pupa.
Nazzi, F, et al. (2012) Synergistic parasite-pathogen interactions mediated by host immunity can drive the collapse of honeybee colonies. PLoS Pathog 8(6): e1002735. doi:10.1371/journal.ppat.1002735
[3] Francis RM, SL Nielsen, P Kryger (2013) Varroa-virus interaction in collapsing honey bee colonies. PLoS ONE8(3): e57540. https://doi.org/10.1371/journal.pone.0057540. Refer to the original paper for the variability of infection levels.
[4] Locke, B, E Semberg , E Forsgren, JR de Miranda (2017) Persistence of subclinical deformed wing virus infections in honeybees following Varroa mite removal and a bee population turnover. PLoS ONE 12(7): e0180910. https://doi.org/10.1371/journal.pone.0180910
[5] Indicating that DWV is transmitted to the larvae either transovarially (from the queen via the egg), or from the nurses. It is an interesting question to me why the bees apparently allow this (since they’ve had plenty of time to evolve some degree of resistance)—could there be an increased fitness component to the bees by accepting subclinical DWV infection?
[6] Martin SJ, BV Ball, NL Carreck (2010) Prevalence and persistence of deformed wing virus (DWV) in untreated or acaricide-treated Varroa destructor infested honey bee (Apis mellifera) colonies. J. Apic. Res. 49: 72–79.
The taxonomy of DWV and VDV-1 are currently being actively investigated and debated. For current reviews, see [7]
7 Ryabov, EV, et al. (2014). A virulent strain of deformed wing virus (DWV) of honeybees (Apis mellifera) prevails after Varroa destructor-mediated, or in vitro, transmission. PLoS Pathogens 10, e1004230.
Cornman, RS (2017) Relative abundance of deformed wing virus, Varroa destructor virus 1, and their recombinants in honey bees (Apis mellifera) assessed by kmer analysis of public RNA-Seq data. Journal of Invertebrate Pathology 149: 44-50.
Dalmon, A, et al (2017) Evidence for positive selection and recombination hotspots in Deformed wing virus (DWV). Scientific Reports 7, Article number: 41045 doi:10.1038/srep41045
[8] Boncristiania, H, et al (2012) Direct effect of acaricides on pathogen loads and gene expression levels in honey bees Apis mellifera. Journal of Insect Physiology 58(5): 613-620.
O’Neal, S, et al (2017) Amitraz and its metabolite modulate honey bee cardiac function and tolerance to viral infection. Journal of Invertebrate Pathology 149: 119-126.
[9] Boot WJ, Johan N M Calis & Joop Beetsma (1993) Invasion of Varroa jacobsonsi into honey bee brood cells: a matter of chance or choice? Journal of Apicultural Research, 32:3-4, 1.67-174.
Any serious student of varroa will spend a great deal of time digesting Willem Jan Boot’s dissertation:
Boot, WJ (1995) Invasion of Varroa mites into honey bee brood cells. Doctoral thesis, Landbouwuniversiteit te Wageningen.
[10] Harbo, JR & JW Harris (1999) Selecting honey bees for resistance to Varroa jacobsoni. Apidologie 30: 183-196.
One detail is that if one is only inspecting capped brood, then the 12.5 days would be reduced to only 11.5 to 12 days.
[11] Thanks especially to Katie Lee.
[12] A strong formic blast to kill all the mites in the brood, followed by requeening. Done early enough, you can save that hive.


