
Understanding Colony Buildup and Decline: Part 4 – The Linear Growth Phase

September 29, 2015
Understanding Colony Buildup and Decline – Part 4
The Linear Growth Phase
Randy Oliver
ScientificBeekeeping.com
First Published in ABJ in May 2015
What got me going on this series is the question of at what rate can I expect my colonies to build up. I’ve now discussed the concepts of “recruitment” and “attrition,” the constraints on the critical “spring turnover,” and pointed out the reason why it is important to build colonies to maximum size prior to the start of the honey flow. So exactly how fast do colonies actually grow?
The Back Story
As a California beekeeper, I was never that interested in serious honey production (a number of commercial beekeepers here don’t even own honey extractors, since we derive our income from bee sales and pollination contracts). Over the years I had developed a simple system in which I nuked all my hives after almonds, selling off half my combs of bees, then building up the remaining splits to 10-frame strength by the first week of July, at which time I’d move them out of state to irrigated alfalfa, on which every strong single would then fill a deep of foundation completely full of honey in about 10 days (which replaced my drawn comb and provided them with winter stores—end of bee work for the season). I only harvested excess honey if they went on to fill a third deep.
The system worked perfectly—I never needed to feed syrup or protein, and did not need to do major honey extraction or bottling (I sold any surplus wholesale in drums, since alfalfa honey has a poor retail shelf life due to its rapid granulation).
All changed when I started to get serious competition from other beekeepers on alfalfa locations, growers began cutting for dairy hay before bloom, fuel prices rose, my sons joined the operation, and I considered the carbon impact of the additional trucking. In response, we figured out how to feed supplemental protein during late summer, which allowed us to keep most of our hives near home in the dry foothills during the summer (a preferred lifestyle choice for my sons and me).
But this change occurred just as the demand for local honey exploded, an opportunity that my sons pursued. This meant that our colonies now needed to be built up to honey production strength nearly 6 weeks earlier than when I previously moved them to alfalfa. It soon became apparent that we weren’t making our splits large enough to take full advantage of the (much earlier) local honey. So we started making them larger and larger.
The question is, Just how large would be optimum? This series of articles is the result of me trying to better figure out the answer.
The Linear Growth Phase
After the spring turnover, temperature, weather, and available forage permitting, the buildup of the colony population really takes off. Let’s take another look the data from Nolan’s classic 1932 study [1] (Fig. 1):
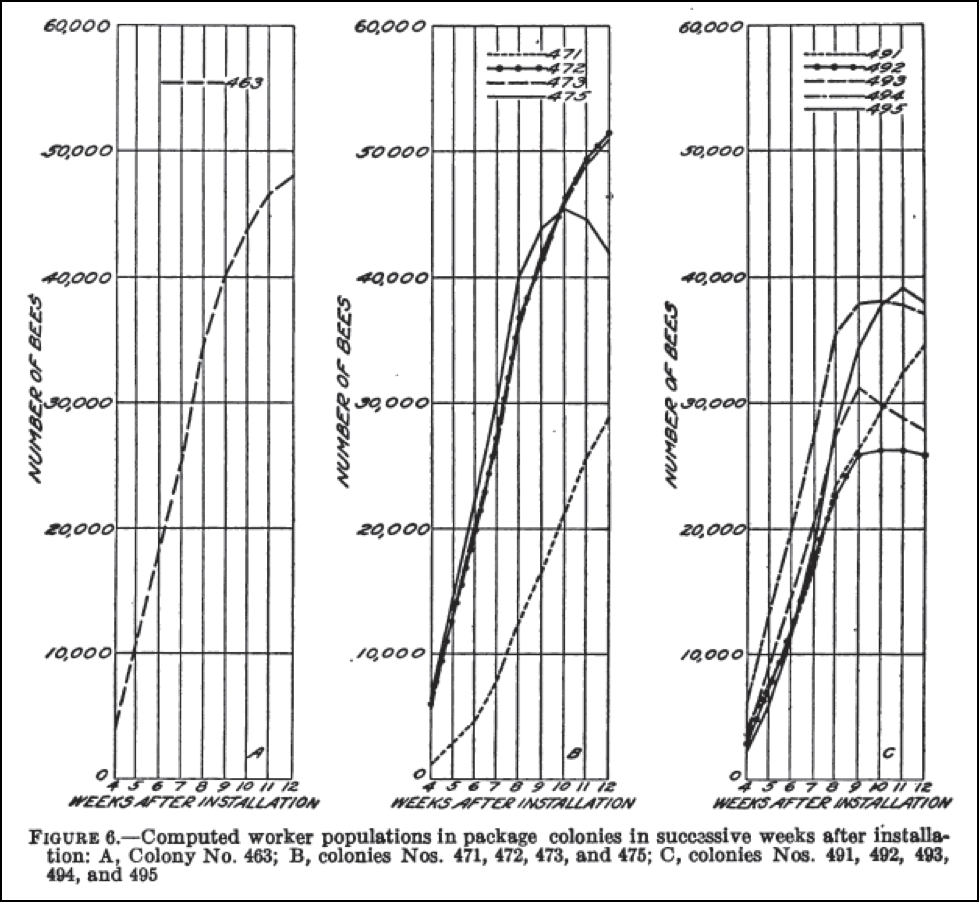
Figure 1. Plots of growth of colonies started from packages in Maryland [[i]]. Once colonies have completed the “spring turnover” and established the broodnest, they grow in a strikingly linear manner for about 10 weeks, at which point the population tops out.
[i] Nolan calculated adult populations by measuring sealed brood every 12 days, and assuming average adult longevity of 35 days. But as pointed out by Sakagami (1968), this rough assumption may skew the population estimates.
Sakagami, SF & H Fukuda (1968) Life tables for worker honeybees. Res. Popul, Ecol. X: 127-139.
The above colony population growth curves of fast-growing colonies, although impressive, have been documented by several researchers since Nolan. I’m struck by two things that truly stand out: that the growth rate once the broodnest is well established is straight line linear, and that the population tops out after 10 continuous weeks of growth. This brings up a few questions:
- Why is the growth rate perfectly linear?
- What determines the rate (slope) of growth?
- Why does it take 10 weeks to reach maximum?
- And why does the population stop growing after 10 weeks?
Why Linear Growth?
Unlike populations that expand exponentially due to an ever-increasing number of reproductives, the honey bee colony has only one female producing eggs [3], which sets a limit on the maximum possible rate of recruitment (the limit being the number of eggs that the queen lays each day). So long as the difference in recruitment vs. attrition is relatively constant, population growth will be linear until some other limiting factor kicks in.
Rate Of Growth
The rate of growth (or decline) is the daily difference between recruitment and attrition. Since the highest recorded rates of egglaying by queens are around 2000 eggs/day, this sets the upper limit for the rate of colony buildup. But from that number, we need to subtract daily attrition of adult workers. We’ll return to that later, but first let’s first look at limitations on the rate of recruitment.
Recruitment
The limiting factors of population growth during the linear phase were well described by Farrar during the heyday of U.S. beekeeping in 1946 [4]:
The most populous colonies produce not only the most honey per colony but the most honey per bee. Brood rearing is the basis of colony development and the maintenance of maximum populations during the flow. It is dependent upon: (1) the queen’s capacity to lay eggs, (2) the supporting population’s ability to maintain favorable temperature and feed the brood, (3) reserves of pollen and honey, and (4) space in the proper position for expansion of the brood nest. [Emphasis mine].
I’ve already discussed points 2 and 3. So, let’s focus on the maximization of the queen’s egglaying, which, not surprisingly, appears to be the main limiting factor upon colony growth.
Researchers typically estimate the queen’s daily egglaying rate by counting the number of cells of sealed brood [5]. So I reviewed the numbers from several different data sets. Nolan found that the maximum number of cells of sealed brood at any one time was about 15,000, Harris about 17,000, Winston about 21,000 [6]. The above figures suggest that a good queen under ideal conditions lays from 800-1100 eggs a day (assuming 90% larval survival), which agree with counts taken by Farrar, which topped at about 900 eggs/day [7]. There are of course, exceptional queens; some sealed brood counts divide out to perhaps 2300 eggs per day (that’s 1½ eggs per minute, 24 hours a day, for at least 12 days straight).
This now brings us to Farrar’s last point—making sure that the queen always has plenty of room in which to lay.
Practical application: Harris and other researchers noticed that when they performed brood counts, they could increase the rate of egglaying by rearranging the frames to provide drawn comb in the right position in the broodnest. Think about it—if a queen needs to lay an egg every minute, she can’t spend a lot of time looking for a place to do it. Reversing the brood chambers, or adding drawn comb, provides the queen with more suitable empty brood cells in which to lay.
A perennial beekeeping question is exactly how much room does a queen actually require? From the above figures we can calculate how many Langstroth frames are needed to satisfy the queen’s need for space. There are a total of 6960 cells (standard foundation) on the two sides of a deep frame. If that frame is conservatively only 70% filled with brood (allowing room for beebread and honey), that leaves about 4875 brood cells, or 43,875 in nine frames (e.g., 10 frames in the box, but no brood on the outermost two sides). A queen laying at 1500 eggs a day can fill 30,000 cells in 20 days [8]; at 2300 eggs/day, 46,000. So the math says that a single Langstroth deep provides enough room for any queen, provided that the brood box is not too crowded with honey or pollen. And this is the experience with Australian beekeepers, who nowadays typically run single brood chambers below an excluder (and make huge honey crops). I also observe the same—when I split busting double-deep colonies after buildup in almonds, I rarely find more than 10 frames to be at least partially covered with brood (Fig. 2).

Figure 2. These well-filled combs of brood suggest that the queen was unrestricted in her egglaying. The amount of sealed brood in these three frames alone indicate that the queen was laying at least 1566 eggs per day [[i]].
[i] 6960 cells per frame x 3 frames x 90% filled with sealed brood ÷ 12 days = 1566 eggs/day (and that’s at 100% survival to the sealed brood stage)
However, returning to Nolan and Harris’s actual measurements, strong colonies appear to typically top out at about 16,000 cells of sealed brood at any one time, which works out (accounting for eggs and open brood) to about 4¼ solid frames of brood. I know—I see better colonies than this each year, but I’m not talking about the exceptions.
The question then is whether a good queen actually lays to her full potential for any extended period of time (after all, she’s not a machine). From reviewing the data of various studies, it appears to me that good queens typically reach their peak of egglaying when the colony is about half grown, and then settle down at a lower rate, as illustrated by data from Farrar (Table 1).
| Colony population | 10,000 | 20,000 | 30,000 | 40,000 | 50,000 | 60,000 | 70,000 |
| Number of measurements | 11 | 40 | 46 | 56 | 58 | 12 | 3 |
| Mean daily worker emergence | 1018 | 1145 | 1322 | 1248 | 1207 | 1283 | 1067 |
| Equivalent number of deep frames 70% covered with brood | 4.4 | 4.9 | 5.7 | 5.4 | 5.2 | 5.5 | 4.6 |
Table 1. Despite the fact that a great queen can lay over 2000 eggs/day, in general that rate is seldom maintained. It appears that maximum egglaying typically occurs when a colony reaches a population of about 30,000 (roughly 17 frames covered with bees). Data reworked from Farrar (1931) [10].
Harris’ data confirms that of Farrar (Fig. 3):
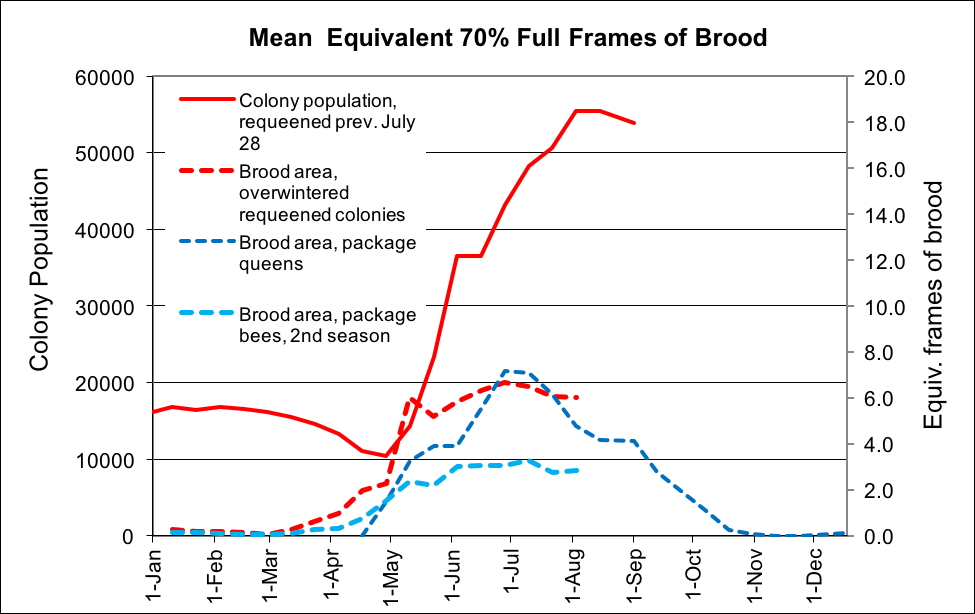
Fig. 3. Harris [[i]] found that a queen’s egglaying typically peaks at about 60 days after initiation of buildup, and the building of swarm cells follows afterwards. Queens typically reached their peak egglaying rate when the colonies were about half grown. Note the lower egglaying rate of the second-year queens (light blue dashed line).
[i] Harris, JL (1980) op. cit.
Practical application: The key point is that either early in the season, or after midsummer, a queen typically does not lay to her full potential. Even strong colonies seldom contain more than the equivalent of 5 solid frames’ worth of brood.
As colonies are growing during spring nectar and pollen flows, the number of cells available for the queen to lay in may be restricted by incoming nectar and pollen (Fig. 4).
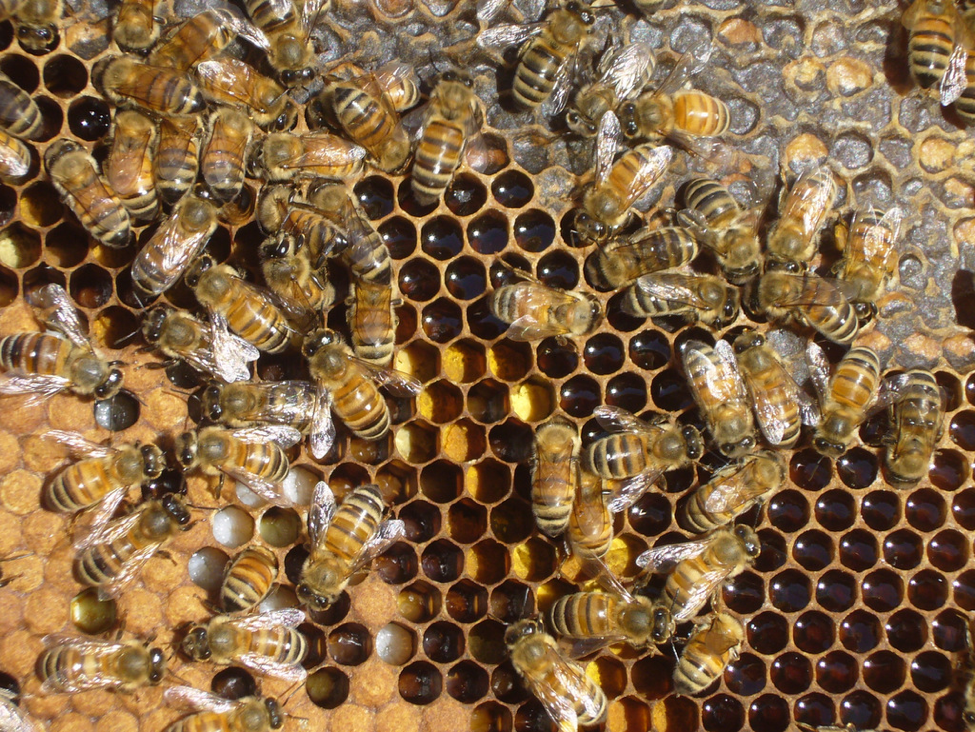
Figure 4. Note the fresh nectar being “back filled” below the old honey (as indicated by the sunken cappings). Such pressure of the size of the broodnest may restrict the queen from laying to her full capacity.
Assuming that a colony manages a successful spring turnover, and provided that the weather and flora are amendable for foraging upon a decent nectar and pollen flow, the colony can now take off on its linear growth phase. In order to illustrate what happens, I worked up data from Lloyd Harris (Fig. 5).
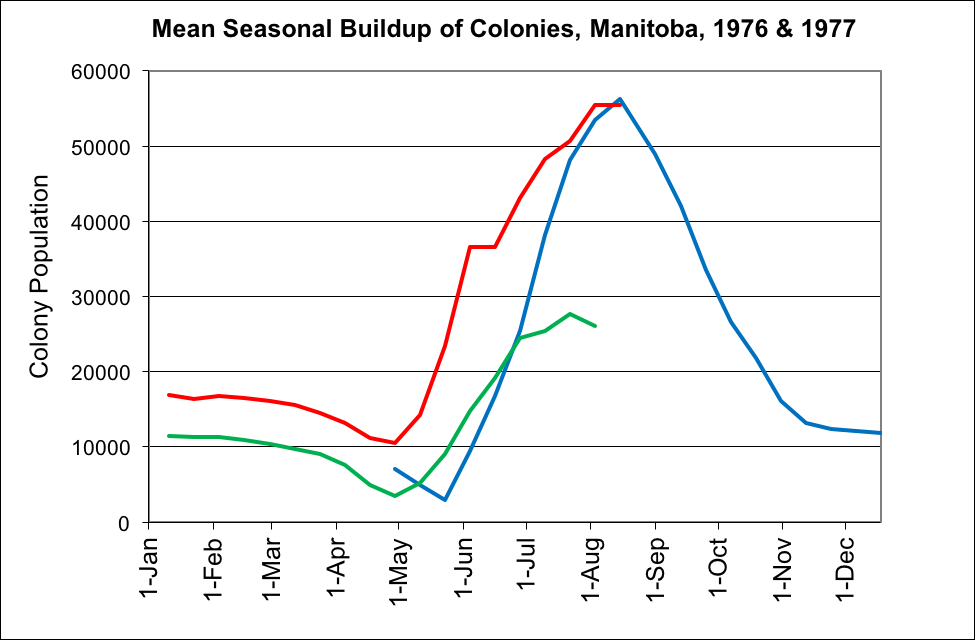
Figure 5. Buildup of colonies from packages (blue), overwintered colonies with 2nd-year queens (green), or colonies requeened in July (red) (5 hives in each group). Note how having a young queen really helps with buildup, and that the colonies with the 2nd-yr queens never reached nearly as large a population. Also note the blip in the red plot that occurred when a strong nectar flow temporarily crowded the queen.
Practical application: young queens tend to lay eggs at a greater rate than do older queens—a strong argument for keeping your hives headed by young, vigorous queens.
Practical Application
A recurrent practical question is, How long does it take for a healthy colony to grow to optimal population for honey production? The standard rules of thumb are about 10-12 weeks for a 2-lb package, about 8 weeks for a strong nuc, or about 6 weeks for a decent overwintered colony—all the above assuming favorable weather and abundant resources.
In my case, we have an excess of bees every spring, and sell them off to avoid losing them to swarming. Our question then is, how large to make splits for ourselves (week by week) so that they all reach optimal size (for honey production) at the beginning of our main honey flow? Since it’s apparent that colony buildup after the spring turnover is linear, we should be able to fairly accurately predict the rate of growth. So, as I’m prone to say, let’s do the math!
Practical application: given a vigorous queen and plenty of resources, coupled with nighttime temperatures that don’t restrict broodrearing, a colony full of brood can be expected grow during its linear phase at about 500-600 bees per day (slower with a lesser queen or under poor conditions; even more rapidly under ideal circumstances). That works out to the cluster growing at about 2 frames of bees per week. I’ve made up a handy table below to allow you to work backwards from the start of your main flow (Table 2):
| BACK CALCULATIONS OF NECESSARY COLONY SIZE | |||
| Number of weeks prior to the main flow |
To reach 24 frames of bees |
To reach 20 frames of bees |
To reach 10 frames of bees |
| 0 | 24 | 20 | 10 |
| 1 | 22 | 18 | 8 |
| 2 | 20 | 16 | 6 |
| 3 | 18 | 14 | 4 |
| 4 | 16 | 12 | |
| 5 | 14 | 10 | |
| 6 | 12 | 8 | |
| 7 | 10 | 6 | |
| 8 | 8 | 4 | |
| 9 | 6 | ||
| 10 | 4 | ||
| If maximum honey production is your goal, you can use the above figures to manage the strengths of your splits prior to the honey flow. You can fill in the dates in the first column for your local conditions, or by plant time of bloom (phenology). Reality check: in my area, the buildup of nucs is sometimes a bit slower, due to cold and rainy spring weather, and a post fruit bloom dearth. | |||
Table 2. For the mathematically disinclined, allow me to give examples. If I’m making splits on April 1, and expect my main flow to kick in on the first of June, that gives the split roughly 8 weeks to build up. So I’d go down Column 1 to the 8-week row. If I want that colony to contain 20 frames of bees at the start of the flow, I’d then go across to Column 3 to see that splits made at that date should be of minimum of 4-frame strength (full of brood, laying queen). Nucs that we make in the middle of April have only 6 weeks to build, and need to be of 8-frame strength. And late nucs made the first of May would need to be of 12-frame strength.
The above table may be helpful for planning your management. Of course, in real life, things don’t always follow the rules. This year in California, despite our best efforts, nature isn’t cooperating.
Bees Out Of Synch With Plant Phenology
We are entering our 4th year of brutal drought in California. Add to that, this season, the effect of climate change really hit us. Plants started flowering about 2 ½ weeks early. It was the earliest almond bloom in memory, and the earliest release date from pollination contracts ever (due to a “flash bloom”). As I’m typing these words, the phenology of spring plant bloom continues at an accelerated rate. Unfortunately, our bees didn’t get the memo, and due to the combination of the flash bloom and fungicide sprays, came out of almonds weaker than normal, having not had their usual buildup period. As a result, as we wait for our colonies to catch up and build to splitting strength, we’re watching the plants upon which we normally depend on for the buildup of our splits complete their bloom. If our honey flow also comes early, we may not have colonies large enough to take advantage of it.
Unfortunately, a short and warm winter also means that varroa also got a head start. More mites, less honey, hungrier bears, what more could a beekeeper ask for?
Next
I’ll next look at factors that can cause “hiccups” in the rate of linear buildup by temporarily depressing the rate of recruitment. Teaser: but what I found to be most fascinating is the huge importance of the survivorship of the workers (the rate of attrition), which allows us not only to arithmetically plot the colony growth rate, but also explains why a colony reaches its maximum population at 10 weeks , and the sets the ultimate maximum size of the population! But that will have to wait until the next installment…
Acknowledgements
I could never have written this article without the help of Lloyd Harris and Peter Loring Borst, to whom I’m greatly indebted. We beekeepers should all be grateful for the monumental work of those field researchers who collected and analyzed data from colonies in order to help us better understand the processes going on within the hive.
[1] Nolan, WJ (1932) The development of package-bee colonies. USDA Technical Bulletin No. 309. Available online from Google Books.
[2] Nolan calculated adult populations by measuring sealed brood every 12 days, and assuming average adult longevity of 35 days. But as pointed out by Sakagami (1968), this rough assumption may skew the population estimates.
Sakagami, SF & H Fukuda (1968) Life tables for worker honeybees. Res. Popul, Ecol. X: 127-139.
[3] To appease the truly nit-picky, I must state that there are often a few laying workers, and sometimes more than one queen.
[4] http://www.beesource.com/resources/usda/productive-management-of-honey-bee-colonies/
[5] Since brood is sealed for 12 days, and since worker development typically takes about 20 days, researchers typically measure the amount of sealed brood, and then back calculate how many eggs were laid. This figure will of course underestimate the queen’s actual egglaying rate, since not every egg laid actually makes it to the adult stage (where it could count as worker recruitment (only about 85% according to Fukuda 1968).
Fukuda, H & SF Sakagami (1968) Worker brood survival in honeybees. Res. Popul. Ecol. X: 31-39.
[6] Winston, ML and OR Taylor (1980) Factors preceding queen rearing in the Africanized honeybee (Apis mellifera) in South America. Insectes Sociaux 27:289-413.
[7] Cited in Nolan, op cit.
[8] Yes, it typically takes only 20 days from egg to adult emergence, not the 21 day figure generally cited in the bee books.
[9] 6960 cells per frame x 3 frames x 90% filled with sealed brood ÷ 12 days = 1566 eggs/day (and that’s at 100% survival to the sealed brood stage)
[10] Farrar, CL (1931) A measure of some factors affecting the development of the honey bee colony. PhD thesis; University of Massachusetts.
[11] Harris, JL (1980) op. cit.


