
Powdered Sugar Dusting – Sweet and Safe, but Does it Really Work? Part 2

February 20, 2011
Powdered Sugar Dusting—Sweet and Safe, but Does it Really Work?
Part 2
Randy Oliver
ScientificBeekeeping.com
First Published in ABJ in Jan. 2009
One beauty of science is that it is anti-authoritarian. Physicist Lawrence Krauss put it well: “There are no scientific authorities. There are scientific experts, but there should be no authority figures whose statements are not subject to question by anyone….One of the greatest experiences scientists, indeed anyone, can have is to have some truly and deeply cherished idea proved wrong by the evidence of reality, for only in this way can we learn to look beyond our a priori prejudices and be willing to judge the world for the way it is, not the way one would like it to be.”
The above statements certainly hold true for apicultural science and practice. In these articles my aim is to report objectively upon trials where recommended practices are put to the test in the field (by others or myself). I certainly do not consider anything that I write to be definitive, and I update my website regularly as new information comes to my attention. I invite any reader, be they scientist or beekeeper, to challenge any statement that I make, to correct my errors, or to elaborate upon some point that I’ve missed.
My point is, that I’m just trying to figure out what works, and what doesn’t, and why. I solicit your help—let me know what’s working for you, or why some method has failed. I’m eager to share success stories in my articles, and to post warnings of potential problems. That said, I’m perpetually swamped, so please don’t overwhelm me with a flood of questions. What I really appreciate are brief, concise field reports from knowledgeable sideliners and commercial guys. Reach me at randy@randyoliver.com.This e-mail address is being protected from spam bots, you need JavaScript enabled to view it
Another sugar dusting test
Last month I reported on a field test that I ran in order to test the efficacy of powdered sugar dusting at controlling varroa mite populations. This month let’s look at what is actually happening hour by hour after a top sugar dusting. On a warm August day last year, several volunteers from our local association, including Mike Montgomery, Thom Staser, and Brion Dunbar helped me to collect data from over 30 colonies—one yard of doubles, and one of singles. In each yard I had previously indicated those that appeared to have significant mite levels. We began by removing sticky boards that had been placed under the colonies one to three days previously, counting all the mites, and adjusting the numbers to 24-hour counts. We then took approximately 300 bees from the broodnest of each sample with a vacuum, and preserved them in alcohol for later washing of mites in order to determine percent infestation.
Then the real fun started! We put dry boards under the screened bottom of each colony, then top-dusted each in turn (1 cup powdered sugar per box, over the top box only), and collected and counted the mite drop at 10 and 30 minutes, and at 1, 2, 3, 21, 24, and 33 hours (it took one guy’s full attention simply to keep our times straight). Our goal was to plot the mite drop curve, and to confirm Dr. Fakhimzadeh’s finding that the effect of dusting wore off after about 24 hours.
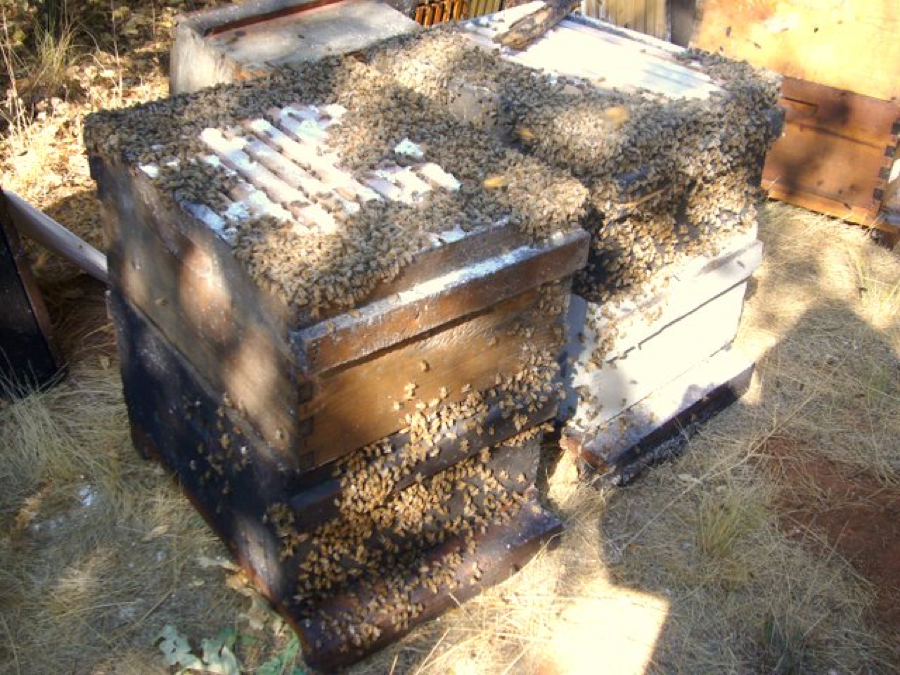
Figure 1. Two colonies several minutes after sugar dusting. I left the lids off these to show how the bees move away from the center of the broodnest, and out of the entrance and other openings. Note that the bees look dull due to the sugar coating their bodies.
We counted a lot of mites that day! One interesting thing that we noticed was that the texture of the sugar that fell onto the dry boards (white corrugated plastic) changed over the course of hours. For the first hour, the sugar looked just like the powder that comes out of the sack, and the mites were all mature, dark, active, and undamaged (Fig. 2). After a few hours, the fallen sugar begins to look more like granular clumps. By 21 hours, the sugar falls in little rods (Fig. 3), and the mites are frequently immature or well chewed. This is likely due to a shift from the drop of phoretic mites back to mites emerging from the brood, or perhaps it has something to do with the change in sugar consistency allowing the bees to catch some mites.
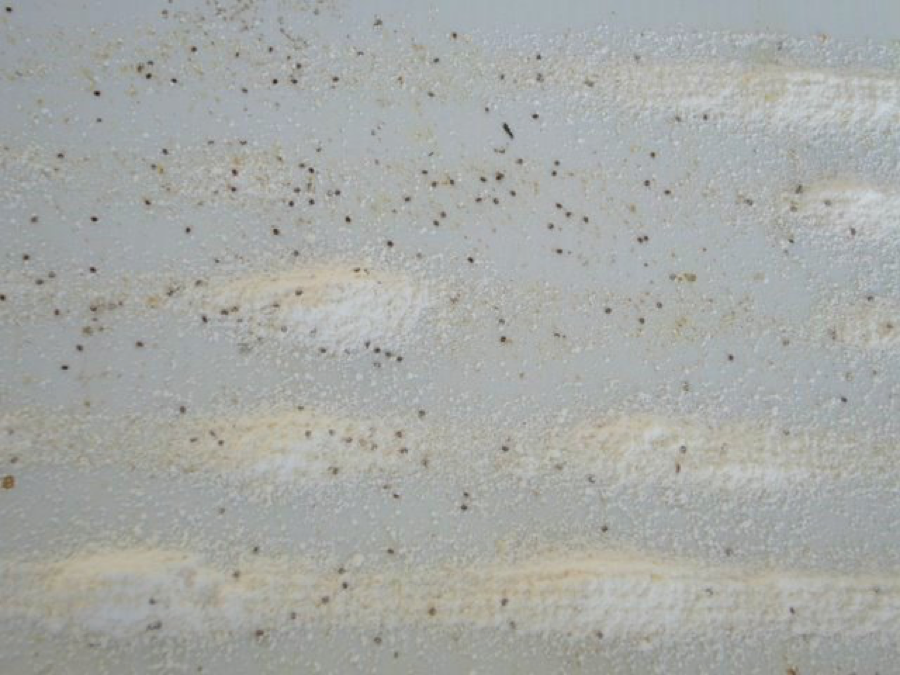
Figure 2. View of a 10-minute mite drop on a dry board placed under a screened bottom. A hive that has been well dusted will show lines of sugar on the dry board. Tip: mites are far more visible on a dusted board if you hold it in the shade. Most mites will be on top of the sugar—few are buried.
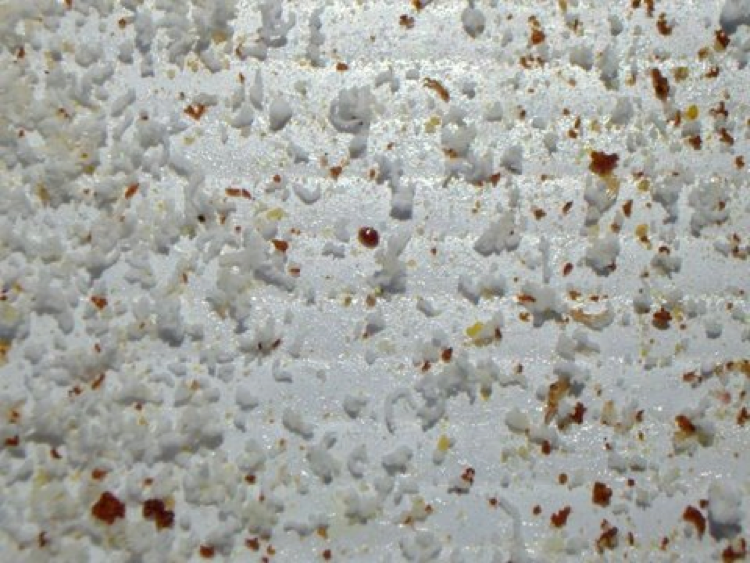
Figure 3. View of the sugar at 21 hours. Note that it no longer falls as powder, but rather as “rods.”
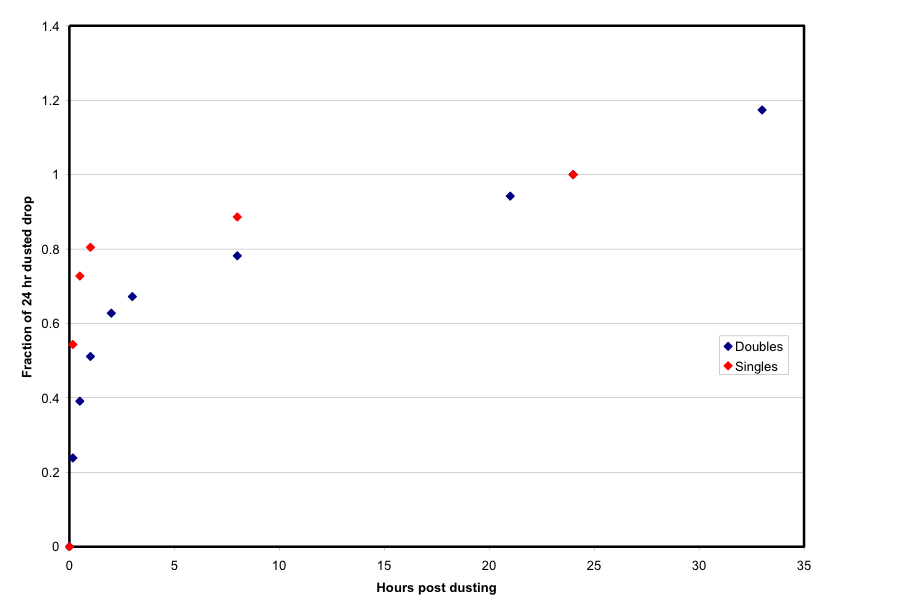
Sugar dusting continues to increase mite drop above the natural mite fall baseline level for about 24 hours (Fig. 4), by which time it has returned to normal. In this trial, the total dusted mite drop over 24 hours was about 5 times natural mite fall for doubles, and 6.3 times for singles.
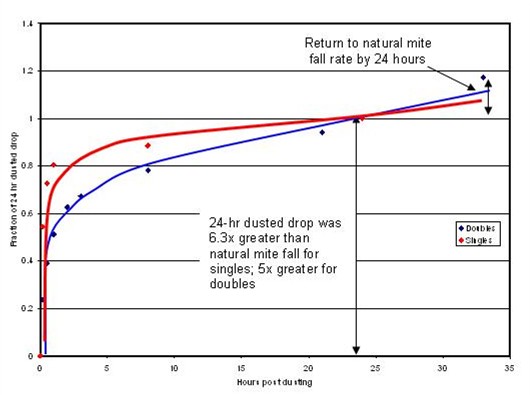
Figure 4. For this graph, I set the total 24-hour mite drop after dusting at 1 on the y axis. Each point is the fraction of that total that had occurred up to that time (10min, 30min, 1hr, 2hr, 3hr, 8hr, 21hr, 24hr, 33hr). Note the meteoric mite drop in the first hour (especially in singles), then the return to natural mite fall sometime before 24 hours (the slopes above 1 on the y axis).
Most of the action after top dusting takes place quickly—within an hour for single story colonies, and by three hours for doubles. Of great interest was the difference in variability of percent drop between doubles and singles—singles were consistent; doubles hugely variable (Table1). This observation may have to do with how the frames are aligned in doubles. Sugar can get trapped on the lower top bars when the bee spaces are not stacked vertically (Figure 6). This would at least delay the dusting of bees in the lower box.
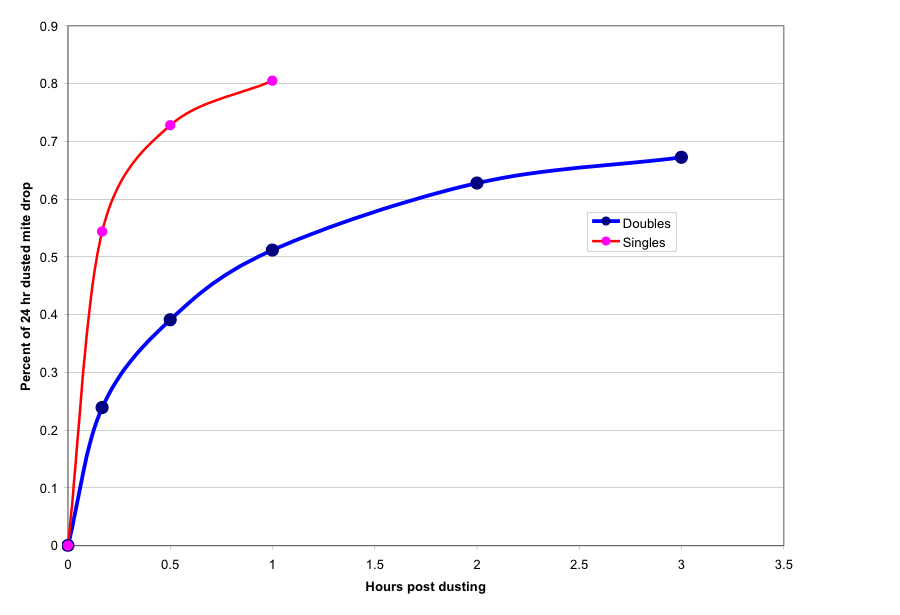
Figure 5. An enlarged view of the first three hours of the above graph. The first hour is shown for singles (n = 9), 3hrs for doubles (n = 17). Note that mites dropped much more quickly in singles, with 80% of the total drop occurring by the end of the first hour. In doubles, less than 70% of the total had dropped by 3 hours. And yes, these are actual mean data points—I’m as surprised as anyone that they made such smooth curves!
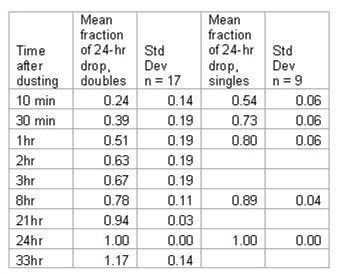
Table1. Means and standard deviations of percent of 24-hr dusted drop in singles and doubles. Note the much greater variability (standard deviation) in the doubles as opposed to the singles. This indicates that top dusting may be more reliable in singles. (For non statisticians, the 0.14 s.d. for the 10-min doubles, means that in most cases the actual percentage drop would be within the range of 14 points above or below 24%)
From the data, we can see that the rate of mite drop following top sugar dusting is fairly consistent. In singles, you can expect better than 50% of the mites that are going to drop due to dusting to fall in the first 10 minutes, and 80% in the first hour (Fig. 5). For doubles, the fall is more variable, but roughly a quarter of the mites fall in the first 10 minutes, and half by an hour. The greater variability may have been due to the fact that the vertical misalignment of frames in about a third of the colonies caused the powdered sugar to catch on the top bars of the lower brood chamber (Fig. 6).
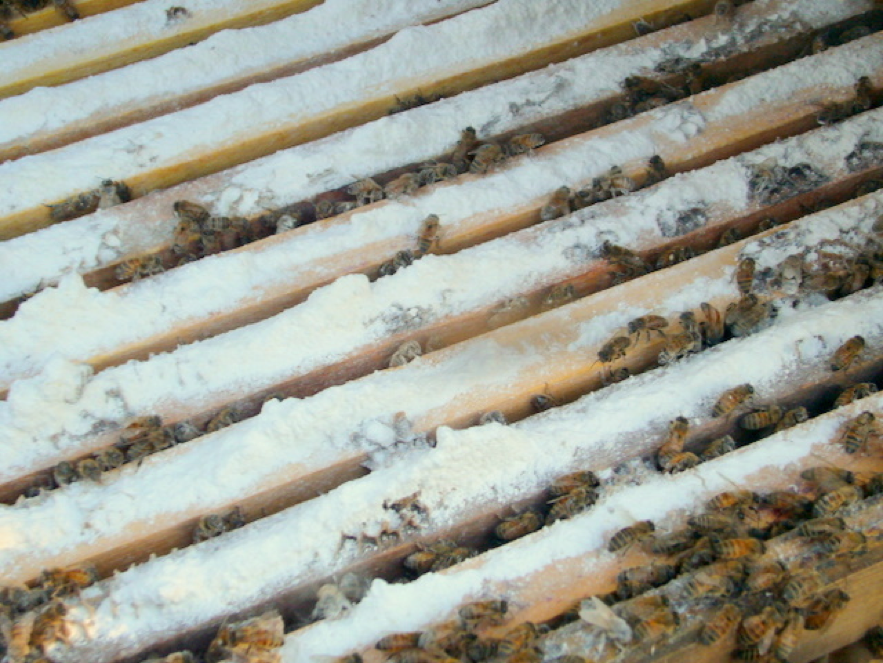
Figure 6. Sugar trapped on top bars of the lower brood chamber. This occurred in colonies in which the frames were not aligned top to bottom. This may be the reason for the great variability in effectiveness of mite drop, either by time, or in total, of doubles that are only top dusted.
A test of the “gold standards”
There are two “gold standards” for determining mite infestation level—an alcohol wash of about 300 bees from the broodnest, and a 48-hour stickyboard count of natural mite fall, adjusted to 24 hours. Surprisingly, when we compared the two for our test colonies, there was virtually no correlation between the two (Fig. 7)!
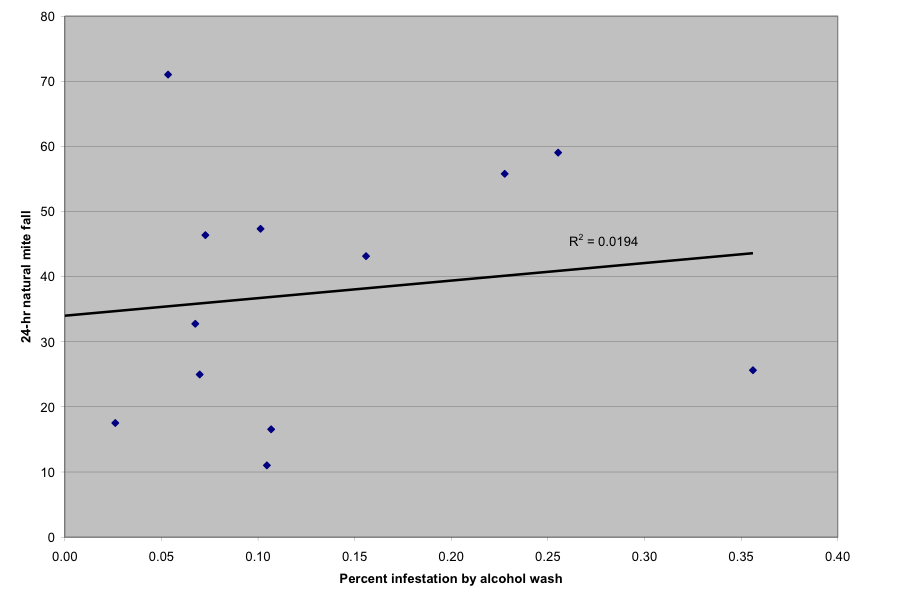
Figure 7. Correlation between two sampling methods to determine varroa infestation level—alcohol wash of 300 bees, and 24-hour natural mite fall onto a stickyboard. Note that there was virtually no correlation between the two methods in this test. This was a distressing surprise, since these two methods are considered to be “gold standards”!
However, we did find that there was a rather good correlation between the alcohol wash and the 24-hour dust drop (Fig. 8).
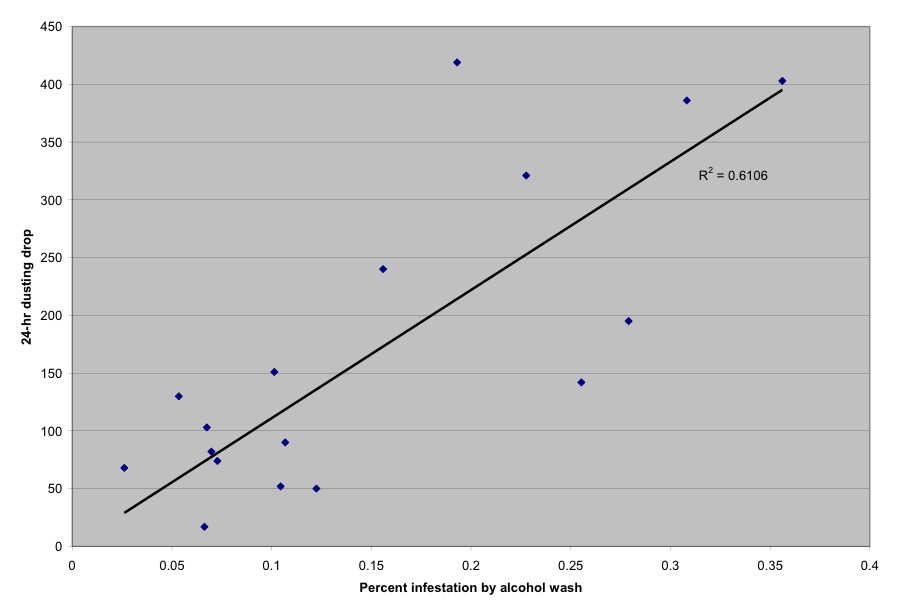
Figure 8. Plot of total 24-hr mite drop after top dusting vs. infestation level as determined by an alcohol wash of 300 bees from the broodnest. This graph includes data from both singles and doubles. These results indicate that sugar dusting can provide an accurate assessment of mite infestation level—perhaps more accurate than the alcohol wash.

Figure 9. Same graph as above, but only for the first 10 minutes. Even a 10-minute after dusting count may be enough to give you an approximate idea of mite levels.
Even the 10-minute dusted drop demonstrated a moderately robust correlation with the alcohol wash infestation level (Fig. 9). The question that I then ask is, Which is actually more accurate—the dust drop (which samples the entire colony) or the alcohol wash (which samples only 300 bees)? I’ve personally become quite fond of the 10-minute dust drop. We’ll look into this next month when I report on my next test of the method.
Acknowledgments
I wish to thank some beekeeping friends for their support, of which I am greatly appreciative: Keith Jarrett (who, among other things supplied the shook bee cages illustrated in my nosema treatment trial), Pat Heitkam of Heitkam’s Honey Bees, Valerie Severson of Strachan Apiaries, Golden Millet, and those others to whom I apologize for overlooking.
References
Krauss, LM (2008) Mail to the Chief. Discover Nov 2008 p. 56.
Almond pollination update
With the rise of the strength of the dollar, the 16-month run of record almond exports finally stalled. The price of nutmeats is down a bit, so growers will be pinching their pennies. California has gotten a little rain, but there is still no snowpack at all in the Sierra as of Thanksgiving. This lack of water is scary to the growers. One broker reports a softening market for bees. Hives are streaming into California. Yesterday, I counted more than ten semi loads of bees heading west as I drove over the summit to pick up a small load of my own.
Tip: When I was recently visiting Michigan, the local migratory beekeepers suggested that I pass on a warning to watch out for Utah inspection of bee loads–have proper inspection documentation before you drive upon Utah highways. Ditto for entry into California—no ants or weeds in the pallets.


