


Sick Bees 17A: Nosema – The Smoldering Epidemic (Part 1)
Sick Bees 17a: Nosema—the Smoldering Epidemic (Part 1)
Randy Oliver
ScientificBeekeeping.com
First published in ABJ in March 2011
Historical Prevalence of Nosema
Was Nosema ceranae a Game Changer?
The latest National Honey Bee Diseases Survey found that as many as seven out of ten U.S. colonies were infected by Nosema ceranae in late winter and spring (Rennich 2011). It appears that the “new nosema,” rather than being the “kiss of death” or “much ado about nothing,” has created a “smoldering epidemic.”
As a California beekeeper, I’d never been much concerned about nosema, unless I was shipping queens and wanted to make sure that they went out “clean.” But in 2006 I experienced unusual colony collapses in my operation. So when I found that my bees were infected with Nosema ceranae, and that the Higes team was convinced that it was causing the collapse of colonies in Spain, nosema really got my attention! In order to avoid being redundant and repeating myself, I suggest that you get up to speed by rereading my article “The ‘Nosema Twins’—Part 1” (at ScientificBeekeeing.com).
What has struck me since is how closely the symptoms of nosema infection match reports of the new rash of colony health problems being reported by beekeepers. Yet, although N. ceranae was often present in collapsing colonies, no one save Dr. Higes seemed to be able to make the case that it was the cause. I myself also tended to dismiss N. ceranae, since I found it to be common in my operation in apparently thriving hives, and I couldn’t discern any connection between colony health and spore counts.
But then along came Dr. Jerry Bromenshenk’s study (2010) that suggested a link between colony mortality and coinfection by nosema with a virus. Previously, other researchers had also linked nosema and viruses, in both bees and other insects. Then at about the same time, Beeologics approached me to run some large-scale field trials, in which I inoculated N. ceranae-infected colonies with a particularly virulent virus cocktail—which pretty quickly crashed the whole yard!
But I still couldn’t firmly nail down nosema as a significant problem in the rest of my operation. But this year I started to become a bit uneasy when I noticed spring spore counts notching up for the fourth year in a row.
What kept nagging me was that the well-described consequences of nosema infection—poor buildup, reduced honey production, and occasional colony dwindling or collapse—exactly matched what I observed in a number of my poorly-performing colonies. Furthermore, this winter I had more dinks than I am accustomed to.
So I researched the older literature on nosema. What hit me was that author after author stressed that nosema disease was “invisible”—that is, the beekeeper would generally not recognize any symptoms. I wondered, could I be failing to notice the obvious?
Practical application: nosema infection is generally “invisible” to the beekeeper. The only signs are poor buildup, reduced honey production, and occasional colony dwindling or collapse.
The clincher came when I shifted my method of nosema monitoring from spore counts to determining prevalence—the percentage of infected bees in a sample (Fig. 1). It appears that N. ceranae was indeed a factor in the majority of the weakest hives in my operation in December. However, let me be clear that it wasn’t the only cause, as nosema was not evident in all the weak hives.
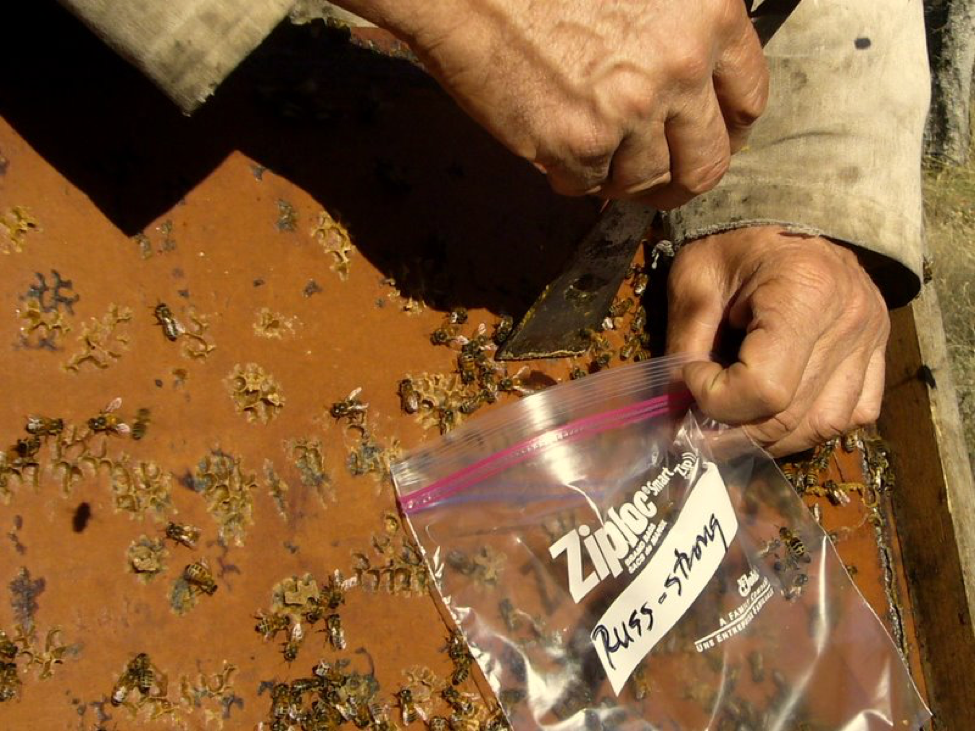
Figure 1.This is how I currently take samples for a Quick Squash analysis. I simply flip a dozen bees from under the cover into a labeled ziplock bag, and then add a squirt of rubbing alcohol to preserve them until I process them in the dining room back home.
The “Invisible” Infection
So let’s look a little deeper at the “invisibility” of nosema infection. Nosema is a parasite, and if present at high levels, can indeed cause disease. But keep in mind that its raison d’être (sorry about the French), is not to make bees sick—on the contrary, that’s the last thing it wants to do!
Wikipedia does a good job at explaining the host/parasite relationship:
A typical parasitic relationship is one in which the parasite and host interact without lethal harm to the host… In most such relationships, the parasite arrogates enough nutrients or other resources to thrive without preventing the host from reproducing [arrogate: to appropriate for oneself without right—your vocabulary word for the day].
Take home message: nosema is normally only a thief, not a killer.
In the case of nosema, it is counter-adaptive for the parasite to cause colony death, since robber bees do not appear to a prime mechanism for the transmission of the spores. Rather, it is to the adaptive benefit of nosema (and also the “acute” bee viruses, which I will discuss in my next article) to exist as relatively “benign” infections, most readily transmitted by a living host. What nosema “wants” to do is to turn the infected bee into a long-lived spore producing machine. That way, there is more chance for an infected bee to transmit spores to its nestmates or to other colonies via drift, or through contamination of flowers or water sources.
Both nosema and viruses are obligate parasites with greatly reduced genomes. They are completely dependent upon a living host for survival and reproduction—unlike, say AFB or chalkbrood, which complete their reproductive cycle in a dead or dying host (and can, unlike nosema or viruses, be cultured in a Petri dish). It is to the disadvantage of either nosema or the acute viruses to actually kill either an individual bee or the colony, since death of the host stops further production and transmission of spores or virions–unlike AFB or chalkbrood, which benefit from the death of their host, since that is the next step in transmitting spores to the next victim via cleaning or robbing.
Nosema is adapted to merely skim a few resources off the host, without actually putting the host out of business—kind of like credit card companies. There is an ongoing evolutionary battle between the card issuers (the parasite) and you (the host). The card company wants to siphon off as big as much of your income as it can get away with, without eliciting an “immune” response in which you destroy the card in self defense. So long as the issuer keeps fees low, it’s just not worth the bother to resist it.
But it is to the card company’s benefit to covertly ratchet up its “take” so long as the cardholders don’t notice it. When cardholders start to feel the hurt of the fees, they start fighting back. The evolutionary game is for the company to find the “sweet spot” at which it can extract the most profit, without eliciting a serious self-preservatory “immune” response from you. The card company wants to “infect” as many customers as possible; not to create casualties.
Similarly, the best strategy for nosema or acute viruses is to co evolve with the bees’ immune system, so that the bee generally keeps the parasite in check, yet still allows it to reproduce just enough so that it manages to successfully infect the next generation of bees (and perhaps some other colonies). Truly virulent strains of the parasite, or particularly susceptible strains of bees, are discarded in the evolutionary process—all extant species are those who have “worked things out” (note that one downside of regular prophylactic treatment with fumagillin is that it counteracts this natural process).
What we, as beekeepers, are concerned with is when things go awry, and environmental conditions change to favor of the parasite. It is easy for us to anthropomorphize parasites, but in reality nosema and viruses are extremely simple and mindless entities without any capacity for thinking, planning, or intent. Killing their host is not in their best interest. Unfortunately, though, they can’t help that they possess an innate capacity to reproduce explosively, given the chance. And that they’ll do!
Bee parasites are normally held in check by the immune barriers thrown up by both individual bees and at the colony level. But there is a point of diminishing returns for the bees, so they reach a shaky “truce” with the parasites—they only devote enough energy as is required to hold them in check and to keep them at levels that don’t appreciably handicap overall colony fitness.
What’s interesting is that such parasites are not normally evenly distributed among the hosts—rather, the parasite usually has an “aggregated” distribution across host individuals, which means that most hosts harbor few or no parasites, while a few hosts carry the vast majority of the parasite. Such is the case with bees, both at the individual level and the colony level. For example, in a healthy colony, perhaps only one out of ten, or one out of a hundred bees will be infected with nosema, but that bee may be chock full of spores! Similarly, the odd colony will fail to hold nosema in check, and every single bee may become infected (Fig.2). These infected bees and colonies act as “reservoirs” for the parasite within the larger bee population—they keep the infection “smoldering” (which is why it is to our advantage to breed for bees that are naturally resistant to the major parasites).
But things can go badly under conditions of stress such as poor nutrition, chill, toxins, or coinfection (my “Four Horsemen of Bee Apocalypse”); the tenuous “balance” can suddenly tip in favor of the mindless parasite. The moment that the host fails to maintain its normal defenses, then there is nothing to hold nosema or virus reproduction in check, and the infection can suddenly explode (see Sick Bees 2—A Model of Colony Collapse).
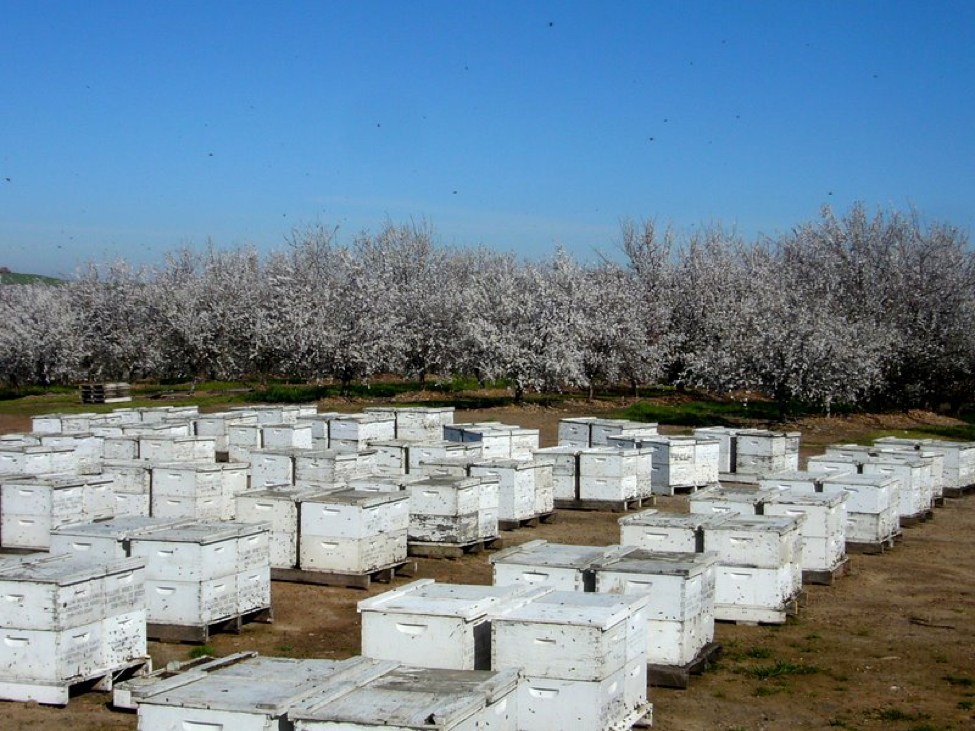
Figure 2. Parasites are generally not evenly distributed throughout an apiary. Some susceptible colonies will have much higher levels than others. Those colonies act as “reservoirs” for infection, which can then spread to other hives in times of stress–such as will occur the moment these almond trees drop their blossoms!It’s also likely that Nosema ceranae is similar to the flu in that it is constantly mutating and recombining (mixing up its genes). Sagastume (2011) found that even within an individual bee, new strains of Nosema ceranae are constantly being created—any of which could be more or less virulent or pathogenic. And just like with the flu, we can expect to see either mini- or large-scale epidemics due to new strains of nosema or viruses from time to time.
In nature, the way that virulent forms of a parasite get weeded out is by the excessive death rate of the host. But in managed apiaries there are so many host colonies that a virulent strain can spread like wildfire. Nosema and virus epidemics that spread beyond a single colony are largely a beekeeper-created phenomenon.
The point that I’m trying to get across is that it is not the “intent” of nosema nor the acute viruses to cause disease—bees only get sick either when environmental factors or a novel parasite strain upset the balance. Under those conditions, the percentage of infected individuals in a hive can creep past the tip point, whereupon the colony may start quickly spiraling downward (I’ve twice observed this phenomenon first hand after inoculating healthy apiaries with an “infective dose” of a pathogen).
However, just because a parasite infection does not normally cause colony mortality, that does not mean that it doesn’t cause morbidity—the lowering of colony fitness (Brown & Fries 2008). Returning to the credit card analogy, the small fee charged to the merchant each time you swipe your card is invisible to the cardholder, but amounts to an overall drain to the U.S. economy to the tune of $60 billion each year! I wonder to what degree the year-round presence of Nosema ceranae drains the U.S. beekeeping economy?
Practical application: although Nosema ceranae may not be directly responsible for colony mortality, it may very well constitute a significant drain upon colony buildup and productivity.
Something Changed This Decade
Dr. Dennis vanEngelsdorp (2010) has documented that for the past few years about of third of colonies in the U.S. perish each winter, as compared to the historical level of 5 – 10%. It is also worth mentioning that Gilles Ratia, the president of Apimondia, reports that worldwide, colony mortality appeared to start increasing about the year 2000.
Bart Smith, technician at the USDA Bee Disease Diagnostic Lab, has kept track of the percentage of samples received each year that test positive for nosema. In the August 2011 issue of this Journal, Bart noted that “The number of nosema-positives samples has been steadily rising during the last decade.” Curious, I worked up his data into a graph (Fig. 3), adding Bart’s estimate for 2011. The result was striking, to say the least!
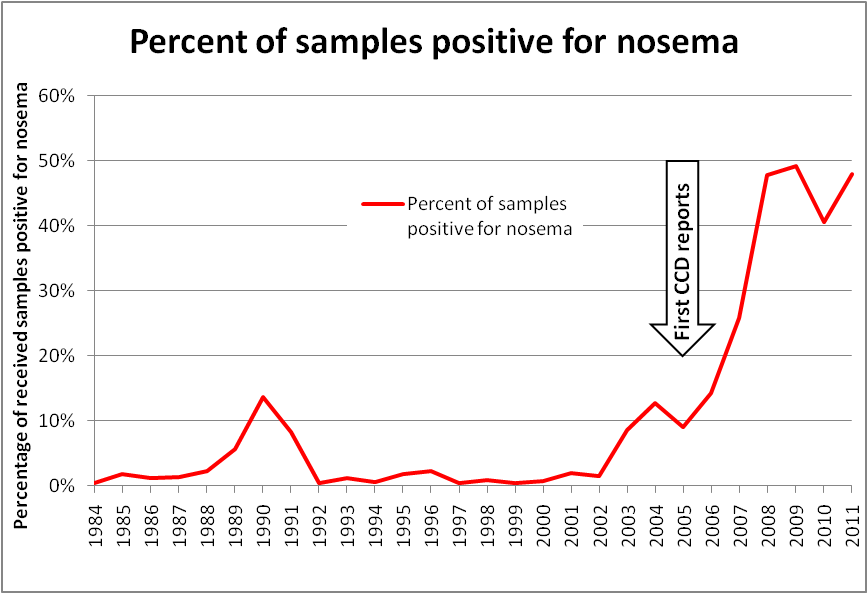
Figure 3. Plot of nosema prevalence in samples received by the USDA Bee Disease Diagnostic Lab. Keep in mind that this data is not from random sampling, but rather from samples sent by beekeepers to the lab, which biases the sampling toward apiaries that are having problems. However, the current high prevalence of infection is supported by recent nationwide sampling. My appreciation to Bart Smith for his help with the data.
It’s hard to ignore the impression that a distinct trend in nosema prevalence occurred in U.S. bees in the past decade, as evidenced by Bart’s data above. It’s also hard not to notice the remarkable concurrence of over-winter colony losses rising at about the same time that nosema prevalence took off! I added an arrow to the graph indicating the first reports of unusual winter losses (Bob Harrison, Dr. Jerry Bromenshenk, pers comm), which slightly preceded Dave Hackenberg’s famous CCD event.
Of additional note is that the first major shortage of bees for almond pollination also occurred in 2005; Rucker’s (2011) graph of almond pollination prices in real dollars follows nearly exactly the same curve as the graph above. This despite the fact that bearing almond acreage rose at a steady rate from 1994 through 2006, and only picked up slightly after that. The rental price for almond pollination correlates strongly with the overall strength of commercial colonies in February.
The obvious question is whether the occurrence of increased colony mortality (and weakness) can be contributed to the invasion of Nosema ceranae, or was it mere coincidence?
Practical question: has the skyrocketing “invisible” infection by Nosema ceranae since the year 2000 contributed to our increased colony mortality rate?
What also catches my attention is that the exponential increase in nosema-positive samples almost exactly mirrors the data from Higes’ diagnostic lab in Spain (Martín-Hernández 2007! The spike in Spain can clearly be attributed to the invasion by N. ceranae (Botías 2011), and likely holds true in adjacent countries.
Question: have we simply overlooked the impact of Nosema ceranae because we were distracted by problems with varroa?
Despite the suggestive graph above, I find this a difficult question to answer. It appears that Nosema ceranae arrived in the U.S. at about the same time as tracheal mite (1984), and varroa (which hit us in 1987). Within a few years, colony losses stepped up from the historical 5-10% level to 17-20% per year in the 1990’s (Johnson 2010), and then jumped again in the early 2000’s to 30% or above. So it is very difficult to separate the influence of nosema from that of the mites!
Beekeepers in several countries which were recently invaded by Nosema ceranae are also experiencing unusual colony health issues, but we can likely attribute most of them directly to varroa and viruses. Another contrary observation is that N. ceranae also invaded Australia, but it doesn’t appear to be causing noticeable problems there, yet–in the absence of varroa. Perhaps N. ceranae is not much of a problem unless varroa and associated viruses are involved.
Historical Prevalence of Nosema
I must say that I am puzzled by the surprisingly low incidence of nosema during the ‘80’s and ‘90’s in the Diagnostic Lab data above. Beekeepers have been aware of nosema issues since I began beekeeping in the 1960’s, so nosema is certainly nothing new. In order to try to find an answer, I dug into the literature to see what the earlier historical levels of nosema infection were.
Dr. White (1919) asked beekeepers for samples from weak colonies, and received 150; half contained nosema spores. Fast forward a hundred years—surprise, I find about the same prevalence in the weak colonies in my own operation!
So let’s move ahead to the 1940’s and ‘50’s, a period when Dr. Farrar from Minnesota loudly decried nosema as the cause of problems of winter losses, queen supersedure, and in the buildup of package bees. In 1955 and 1958, Jaycox (1960) found 14% and 85%, respectively, of sampled California colonies to be infected with nosema.
Moeller (1978) tracked the level of natural infection in some 200 untreated colonies in Madison, Wisconsin for the years 1954-1962. Typically, fewer than 8% of colonies were infected in December, but that level rose to around 20% (and up to 80%) in March and April. In the infected colonies, typically 30-40% of individual bees were infected.
In South Australia, Doull (1961) determined that N. apis was present in all hives at all times. He concluded that “no hive is likely to be completely free from either spores or infected bees for any appreciable length of time.”
In the spring of the next year, Doull (1962) sampled 626 colonies from 61 apiaries in California. Roughly 10% of the colonies, and a third of the apiaries were infected. He noted that, “There was no external evidence of the disease.”
Furgala (1973) surveyed Minnesota apiaries in spring for the years 1969-1972. Apiary composite samples were taken of flying bees from every second or third colony. The cooperators were encouraged “to use fumagillin therapy when warranted.” Spores were observed in 80% of samples from untreated hives, with spore counts exceeding 1M in most of the samples (they were typically in the 50M range, which is scary high!). Surprisingly, he even found spores in 30-40% of the treated hives!
Mussen (1974, and a coauthor of the previous study) followed up by looking for nosema in 708 samples from 376 apiaries taken in March through June across the entire U.S. Nosema was present in 54% of the samples, with a trend for higher prevalence at higher latitudes, and the lowest prevalence in the Mountain and West South Central states. The highest spore counts and prevalence was in April and May.
So I don’t get it! Compare the historical figures to the Bee Disease Lab graph above (especially allowing for the fact that the samples were voluntarily sent in by beekeepers concerned about colony health issues). What the heck happened between the ‘60’s and ‘70’s, when nosema infection was common, to drive the level of nosema prevalence down to the extremely low figures recorded by the USDA lab during the ‘80’s and ‘90’s?
I posed that question to Dr. Mussen. He recounted that upon his 1976 arrival in California, he strongly pushed the use of fumagillin. As a result, sales of Fumidil-B doubled each year for several years thereafter, as buyers demanded fumagillin-treated packages. That action alone, due to the numbers of then-treated package bees shipped all over the country, could possibly have had a substantial effect upon nosema levels. So a plausible hypothesis is that beekeepers simply cleaned up nosema with fumagillin during the 80’s and 90’s; or perhaps our bees simply evolved to be more resistant to N. apis, as they did with tracheal mite and chalkbrood.
Last minute update: just as I was wrapping up this article, it occurred to me that the Diagnostic Lab might have changed its nosema sampling methodology during the time period in question. So I asked Bart. His answer:
My records indicate we started doing hemacytometer counts on a regular basis in August of 2007. Prior to that time, results were listed as being positive or negative for nosema disease. This is what I know about sample size for nosema checks: During 1984 to 2002, the sample size consisted of 4 bees. During 2003, the sample size was changed to 10 bees. The sample size was again increased to 30 bees during 2008 and has continued at that number.
So, I wondered, could the apparent meteoric rise in nosema prevalence be merely an artifact of the sampling method?
Let’s reevaluate the data. Up ‘til 2002, only about 2% of the samples tested positive, with a sample size was only 4 bees. I cranked those numbers into the probability calculator, and found that the level of prevalence that the lab recorded indicated that, on average, less than 1 bee out of a hundred in the samples was infected. So, it appears that the early low figures stand!
Since the Lab sampled 10 bees from 2002 through 2007, I’m comfortable with that data too. That leaves the extremely high prevalence from 2008 on, which would be more likely with the larger sample size, since larger samples are more likely to catch an infected bee, which would then skew a spore count. Luckily, we have Rennich’s (2011) data to support the high prevalence for recent years–in fact, her numbers are higher than Bart’s!
Whew! No need to delete the chart (by the way, in order to try to prevent my readers from suffering from painful information overload, it’s not unusual for me to delete up to half of a written article before sending it to press. I try to just cherry pick the goodies that I hope will be of general interest to you).
So why did nosema levels start climbing rapidly around the year 2000? Perhaps we became complacent about nosema treatment, perhaps we introduced more virulent strains of the parasite in Chinese pollen (Fig. 4), perhaps the increased movement of hives to almond pollination spread the infection, or maybe Nosema ceranae simply hit its stride. It is worth noting, though, that the new nosema does not appear to respond quite as well to fumagillin treatment as does the old nosema, so that may have something to do with it. We may never know the answer.
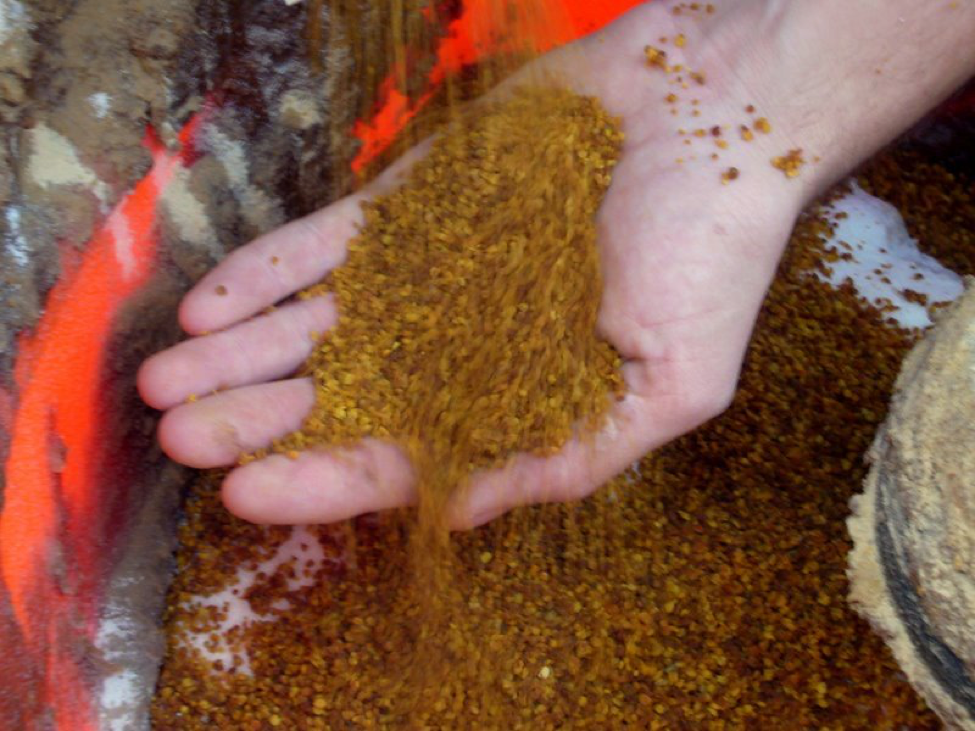
Figure 4. In the early 2000’s, the feeding of home-mixed pollen supplement really took off. Many beekeepers added unsterilized pollen imported from China, not knowing that it could contain viable spores and virions. Others used unsterilized Chinese royal jelly for queenrearing. Recent findings by Singh (2010) strongly suggest that we very likely inadvertently inoculated our bees with every sort of pollinator pathogen found in China! (Cue to bang head against wall).
Was Nosema ceranae a Game Changer?
While I am in agreement with most bee researchers that the number one problem for bees worldwide is varroa, one must remember two things:
- There were plenty of sick, dwindling, lagging, and collapsing colonies due to nosema and viruses before we ever heard of varroa (as there are in Australia even in the absence of varroa), and
- Our colonies were generally doing fairly well despite varroa, so long as the beekeeper used effective mite treatments.
Something else apparently changed the game in the early 2000’s—could that something be Nosema ceranae? It is plausible that Mariano Higes has been right all along, and that N. ceranae shifted the tip point of colony health? I want to be clear here that I am ignoring the viruses in this article, but certain viruses (notably the “acute” virus group) also appear to be significant contributors to the increased colony mortality, so a more complete picture would be the varroa/virus/nosema troika. I’ll address this in a subsequent article—but first I’ll continue to focus upon nosema a bit more.
Wrap up: it’s likely that the increased rate in colony mortality is due to various combinations of varroa/virus/nosema buildup, coupled with the effects of miticide residues, and exacerbated by poor nutrition. In the case of colonies exposed to commercial agriculture, the deleterious effects of pesticides are often a serious contributor. But it’s possible that Nosema ceranae helped to tip the balance.
References
Botías, C, et al (2011) The growing prevalence of Nosema ceranae in honey bees in Spain, an emerging problem for the last decade. Research in Veterinary Science (in press).
Bromenshenk JJ, CB Henderson, CH Wick, et al. (2010) Iridovirus and microsporidian linked to honey bee colony decline. PLoS ONE 5(10): e13181. doi:10.1371/journal.pone.0013181.
Brown, MJF and I Fries (2008) Evolutionary epidemiology of virus infections in honey bees. In Virology and the Honey Bee.
Doull, K. (1961) Nosema disease. The Australasian Beekeeper 62: 228-235.
Doull, KM and JE Eckert (1962) Survey of the incidence of nosema disease in California. Journal of Economic Entomology 55(3): 313-317.
Farrar, CL (1968) Productive management of honey-bee colonies. Series in ABJ http://www.beesource.com/resources/usda/productive-management-of-honey-bee-colonies/
Furgala, B, et al (1973) Enzootic levels of nosema disease in untreated and fumagillin treated apiaries in Minnesota. ABJ 113(6): 210-212.
Furgala, B, RA Hyser, and EC Mussen (1973) Enzootic levels of nosema disease in untreated and fumagillin treated apiaries in Minnesota. ABJ 113(6): 210-212.
Jaycox, ER (1960) Surveys for Nosema Disease of Honey Bees in California. Journal of Economic Entomology, Volume 53, Number 1, February 1960 , pp. 95-98.
Johnson, R (2010) Honey Bee Colony Collapse Disorder. http://www.fas.org/sgp/crs/misc/RL33938.pdf
Martín-Hernández, R, et al (2007) The outcome of the colonization of Apis mellifera by Nosema ceranae. Applied and Environmental Microbiology http://aem.asm.org/cgi/content/abstract/AEM.00270-07v1
Martín-Hernández, R, et al (2011) Microsporidia infecting Apis mellifera: coexistence or competition. Is Nosema ceranae replacing Nosema apis? Environmental Microbiology and Environmental Microbiology Reports (in press).
Moeller, FE (1978) Nosema disease—its control in honey bee colonies. USDA Tech Bulletin No. 1569. Free download Google hgNI6C203mwC
Mussen, E. C., B. Furgala, and R. A. Hyser. Enzootic levels of Nosema disease in the continental United States (1974). American Bee Journal 115(2):48-50.
Sagastume, S, C del Águila, R Martín-Hernández, M Higes, and N Henriques-Gil (2011) Polymorphism and recombination for rDNA in the putatively asexual 3 microsporidian Nosema ceranae, a pathogen of honey bees. Environmental Microbiology and Environmental Microbiology Reports 13( 1): 84–95.
Singh, R., DL Cox-Foster, et al (2010). RNA viruses in hymenopteran pollinators: evidence of inter-Taxa virus transmission via pollen and potential impact on non-Apis hymenopteran species. PLoS One, 5(12), e14357.
Rennich, K, et al (2011) 2010-2011 National Honey Bee Pests and Diseases Survey Report
http://www.aphis.usda.gov/plant_health/plant_pest_info/honey_bees/downloads/2010-2011-Limited_Survey_Report.pdf
Rucker, RR, WN Thurman, and M Burgett (2011) Colony collapse: the economic consequences of bee disease. Montana State University, Department of Agricultural Economics and Economics.
Smith, IB, Jr and JS Pettis (2011) The bee disease diagnostic service—100 years and growing.
vanEngelsdorp, D, J Hayes,Jr, RM Underwood, JS Pettis (2010) A survey of honey bee colony losses in the US, fall 2008 to spring 2009. Journal of Apicultural Research 49(1): 7-14.
White, GF (1919) Nosema-Disease. USDA Bulletin No. 780.