First published in: American Bee Journal, December 2013
BEEKEEPER-FUNDED RESEARCH
Does Oxalic Acid Treatment of Nucs Affect Honey Production?
Randy Oliver
ScientificBeekeeping.com
Originally published in ABJ Dec 2013
Last year I ran two trials to see whether I could take advantage of the brief window of opportunity which occurs 19 days after starting nucs with queen cells, during which the mites are forced out of the brood. I detailed the theory, timing, and procedure in a previous article [1]. The result was that treating nucs with an oxalic dribble was highly effective against varroa, and appeared to lead to increased colony strength. However, in one replicate, it appeared that the oxalic treatment may have reduced subsequent honey production. So I ran another trial this spring to confirm whether that was indeed the case.
Introduction
Varroa management is much easier if you begin the season with mites reduced to the lowest possible level. The problem is that colonies in the springtime are full of brood, which provides the mite with a place to hide from treatments. By inducing a period of broodlessness, the beekeeper can force all the mites out onto the adult bees, where they are exposed to the action of the mite treatment of your choice.
A very brief period of such broodlessness occurs when one makes up nucs using queen cells (as opposed to with a caged queen). With careful timing, one can obtain a high efficacy mite kill by applying a safe, inexpensive, and quick treatment of oxalic acid dribbled in sugar syrup. Although oxalic acid is considered to be a “natural” and “organic” treatment, a concentration high enough to kill mites is somewhat stressful to bees. The point of treatment, though, is that the short-term stress from the treatment should be more than compensated for by the long-term benefits to colony health and productivity by the knockback of the mite infestation rate.
This experiment was designed to test whether such an oxalic dribble of nucs would negatively affect the honey production of treated colonies in the ensuing months.
Materials and Methods/Trial Log
April 14, 2013 Made up a batch of 4-frame nucs, Italian stock, set in their own yard in the Sierra Foothills.
April 15 Installed 10-day queen cells from single mother.
May 2 Checked nucs for queenrightness; good take. Equalized the queenright nucs to 5 frames of bees using frames from the queenless nucs. Total count 37 colonies. There was some comb whitening from the spring honey flow and the colonies appeared healthy. I flipped a coin to randomly assign the hives to be treated (n = 19) and applied approx. 5 mL of 3.2% w:v oxalic syrup [2] applied by a garden sprayer set to a slow stream (field calibrated with a graduated cylinder).
May 10 Worked all colonies into singles, rechecking for queenrightness and brood health; added drawn brood combs and recorded starting weight of each hive. Most colonies were roughly equal in strength—a strong 5 frames of bees with 4 frames of brood. Colonies had been set back slightly by poor weather last week, but were showing a fair nectar shake this day. Good weather in forecast; the main honey flow about to begin.
May 11 In order to minimize the effect of any introduced nosema or EFB on the drawn comb, and to stimulate the colonies, I fed all ½ gal 1:1 sucrose syrup containing 95mg fumagillin and 100mg OTC per hive.
May 20 Blackberries (our main source of nectar) were coming into bloom, but disappointingly, there was only minimal nectar shake. Most colonies 6-10 frames strength. Weighed hives again (Fig. 1) and added a weighed deep second deep of foundation to all.
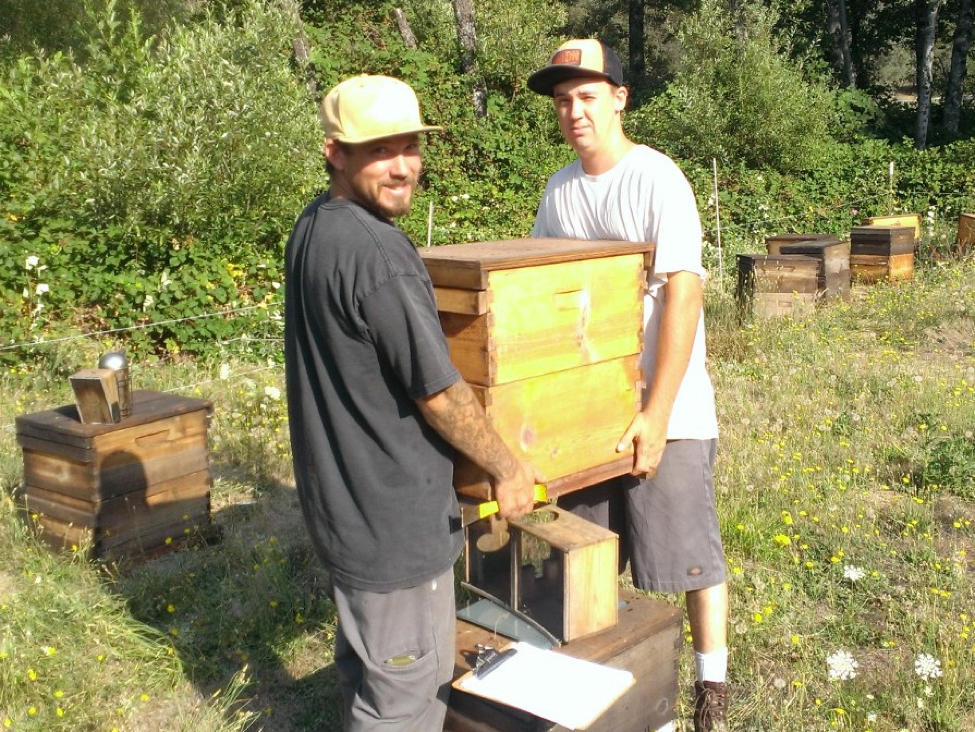
Figure 1. My sons Eric and Ian weighing a hive on a digital scale (placed under the empty package cage).
May 30 Unfortunately, it is clear that our expected main flow is not happening, apparently due to the winter drought. Fed ½ gal 1:1 syrup to stimulate the bees to forage.
June 10 Fed ½ gal 1:1 syrup
June 14 Blackberry bloom mostly over, minor nectar shake. Weighed all hives for the final time. Checked the two anomalous light-weight hives and censored both; one had gone queenless, and one had requeened itself.
Results
There was, as we typically observe, a wide colony-to-colony variation in weight gain (Fig. 2).
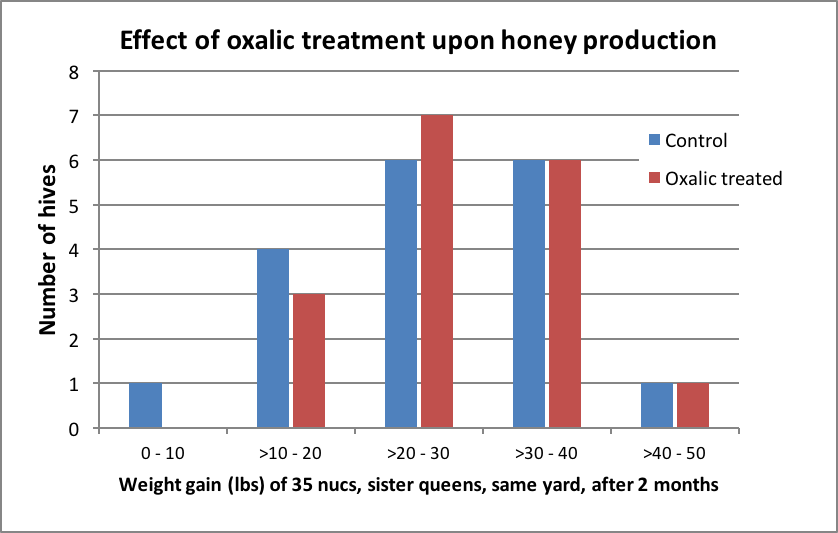
Figure 2. The amount of weight gain per hive (treated and controls combined) followed a normal distribution. Mean weight gain was 26 lbs (median 27 lbs). The highest producing colony was in the oxalic group. The three half gallons of fed syrup contained a total of 7.5 lbs of sugar per hive, which would be expected to have contributed to that amount of the weight gain. This was a very poor honey crop, but likely adequate to determine whether oxalic treatment substantially affected honey production.
At the first weighing (Day 25), the treated colonies, on average, put on slightly less weight, but the difference was not statistically significant (Fig. 3). At the second weighing (Day 59) the treated hives weighed slightly more on average, but again the difference was not statistically significant.
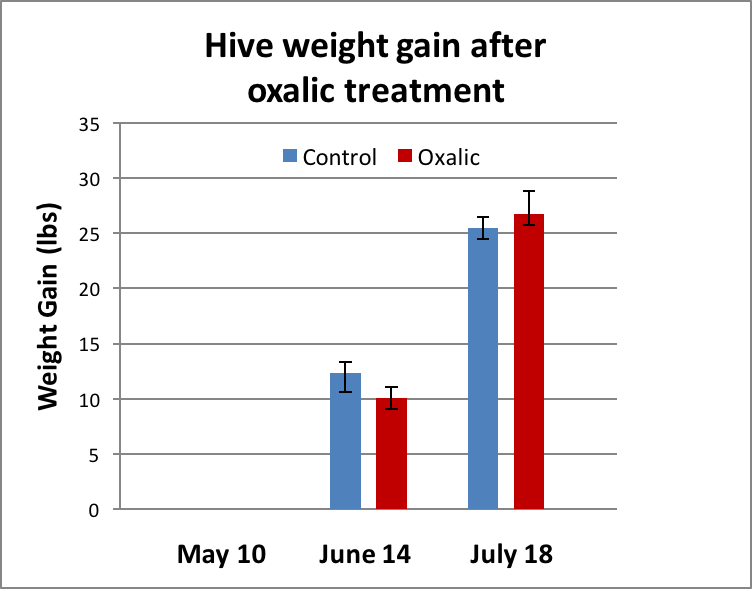
Figure 3. There was no significant difference in weight gain between groups at either time point.
Discussion
The typical great degree of colony variation, even in hives started with sister queens and kept in the same yard, often makes it difficult to tease out any minor effect of treatment. However, in particular trial there did not appear to be any substantial negative effect due to oxalic acid treatment.
The efficacy of treatment, as shown in the original trials, could be improved by blasting the parent hives with formic acid prior to making up the nucs. Any loss of the old queens would not be important, since the colonies were going to be nuked up anyway. I suspect that such a one-two combination of “natural” treatments would result in very low mite levels in the nucs.
Other treatments, such as Hopguard strips or powdered sugar dusting, might also be possibilities for working into this sort of mite management. All told, I find that this simple mite management method is safe and inexpensive, does not leave persistent residues in the combs, and does not appear to negatively affect honey production. In my own operation, we have now treated over 2000 nucs in this manner, and are pleased with the results.
Acknowledgements
Thanks to local beekeepers Fosten Wilson and Rick Blaski for their help in the field. Funding for this experiment came from beekeeper donations to ScientificBeekeeping.com, with special thanks to the Beekeepers Association of Southern California and to the beekeepers contracting with Scientific Ag Company. I am happy to share the raw data from any beekeeper-funded trials.
References
1 Simple Early Treatment of Nucs Against Varroa, ABJ April 2012
2 https://scientificbeekeeping.com/oxalic-acid-treatment-table/
Nosema Ceranae and Honey Production in Healthy Colonies
Randy Oliver and Brion Dunbar
ScientificBeekeeping.com
First Published in ABJ in November 2012
There is considerable scientific and practical debate about the degree of impact that Nosema ceranae infection has upon the honey bee colony. It is reasonable to assume that there would be noticeable impairment, since infection by its cousin, Nosema apis, is well documented to adversely affect bee metabolism, protein levels, longevity, and most noticeably, honey production [1]. Studies on the new parasite have found similar metabolic harm [2], [3]. And Dr. Frank Eischen’s data from Louisiana [4] suggests that infection by N. ceranae also suppresses honey yields. In this study, we wished to see whether infection by Nosema ceranae was related to poor honey production in colonies of roughly the same strength, as opposed to colonies simply weakened in strength by nosema infection.
One of the problems with trying to document any correlation between N. ceranae and colony production is that that the typical method of monitoring the parasite consists of determining the average spore count from a small sample of bees. This method is demonstrably unreliable, depending upon factors such as from where in the hive the sample is taken, the time of day, the presence in the sample of a single highly-infected bee, or the number of bees sampled [5]. Furthermore, mean spore counts may not correlate well with the actual degree of infection [6].
To overcome the problems inherent with mean spore counts, I’ve been revisiting Dr. G.F. White’s original method of assessing the degree of nosema infection in the colony by squashing bee guts one at a time [7]. In my first study, I took samples from the two strongest and two weakest colonies in several apiaries in December, and compared the percentage of bees showing infection (Fig. 1).
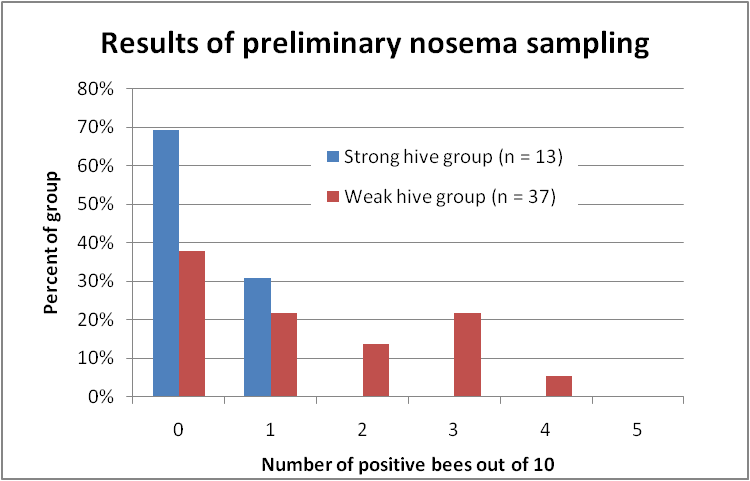
Figure 1. Distribution of nosema prevalence in the weakest and strongest hives in my apiaries in early December, based upon 10-bee samples taken from under the lid or outside combs. In none of the strong hives were more than 1 bee out of 10 infected; whereas the majority of the weak hives scored at least 1 or more infected bees out of 10, and 40% scored 2 or more positives. Chart reprinted from Sick Bees 15.
There was a clear relationship in December between colony strength and the proportion of infected bees in a hive. By February, nosema prevalence in some dwindling colonies had risen to 8-10 bees out of 10! By changing my assessment method to gut squashes rather than mean spore counts, for the first time I could see a relationship between infection by Nosema ceranae and poor colony performance!
Skip forward to spring. My hives returned from almonds looking great, whereupon I split and requeened them all. The splits grew rapidly during the best spring in years, and gained weight on the early flows in April. But then during our main flow in June, things came to a screeching halt— despite looking strong and healthy, most hives did not even make adequate winter stores. The normal variation in colony-to-colony honey production was arrestingly apparent—a number of hungry colonies pulled early honey down out of the second brood chamber, yet others cried for additional supers, and filled them!
I couldn’t help but suspect that the poor producers might be suffering from a nosema infection (there are no overt symptoms of infection by N. ceranae). Intrigued by my findings above, I decided to see if the same held true for honey production–that is, whether I could detect a difference in infection levels between the best and worst producing healthy colonies in each yard.
Methods
With the assistance of beekeeper Brion Dunbar, I took samples from 10 apiaries on June 15 and 16, as the main honey flow was ending. Each apiary had been started from nucs in early April, mostly with sister queens (different for each yard). In each apiary we identified the two colonies that had produced the most honey, and the two that had produced the least, inspecting each colony to exclude those showing any signs of disease, queen problems, or lack of cluster size (not surprisingly, we excluded a number of nonproductive colonies for the above reasons). In other words, we wanted to compare only strong, apparently healthy colonies to determine whether their differences in honey production were due solely to the degree of nosema infection.
We took bee samples from under the lid or from an outside comb. Brion took on the Herculean task of individually squashing and viewing the gut contents of 10 bees from each hive (for a total of 410 bees), scoring each bee as being either positive or negative for nosema infection.
Results
The results surprised us—there was no striking difference in the prevalence of infected bees between the productive and nonproductive hives! On the average, 7% of the sampled bees were infected in the productive colonies, compared to 10.5% in the nonproductive (not statistically significant). The distribution of the degree of infection was similar for both groups of hives (Fig. 2), with one notable exception—an apparently badly-infected colony in the nonproductive group.
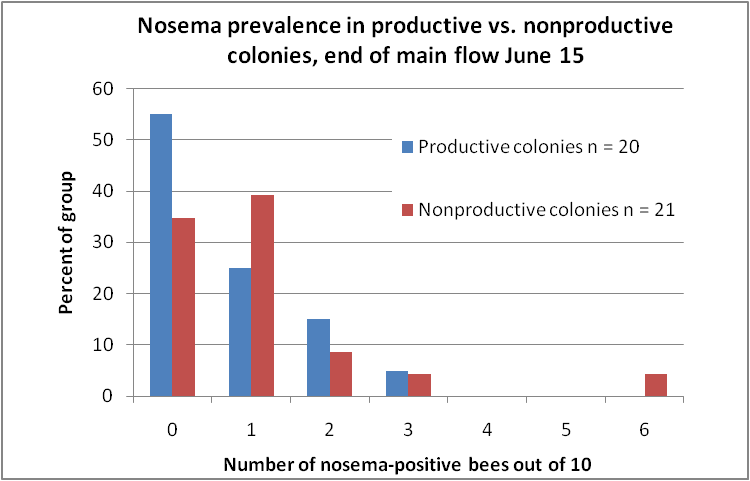
Figure 2. Distribution of nosema prevalence at the end of the honey flow in June. Although a larger percentage (55%) of the productive hives scored negative for nosema infection (as opposed to 38% of the nonproductive), that relationship did not necessarily hold for lightly infected colonies. Overall, both groups had similar distributions of infection prevalence.
Discussion
It is easy to understand how colonies weakened in population due to nosema infection would produce less honey. We suspected that even in strong colonies, nosema, due to its metabolic drag on the bees, would suppress honey production. So in this study we compared the prevalence of infection between apparently healthy colonies at the extreme ends of weight gain in each yard (most productive vs. least productive).
Since we had earlier found a marked difference in nosema infection between strong and weak hives the previous fall, we fully expected to find more nosema in the nonproductive hives. To our surprise, there was no striking trend in that direction. Such a relationship might have been more evident had we sampled more hives, or taken more bees in each sample.
It’s likely that by excluding any sick or weak colonies that we also omitted any badly-infected hives from analysis–in our sporadic sampling of weak hives in the operation (data not shown) we often found nosema to be prevalent. Note that of the 41 colonies selected, in only 3 were more than 20% of the bees in the samples infected. Returning to Dr. White’s detailed studies on Nosema apis, he [8] concluded:
As a rule colonies which in the spring of the year show less than 10 per cent Nosema-infected bees gain in strength and the losses are not detected. This is often true also in cases where the infection is somewhat greater than 10 per cent. When the number of infected bees approaches 50 per cent the colonies become noticeably weakened and in many cases death takes place.
So perhaps colonies can still be productive despite having up to 20% of their bees infected by Nosema cerana, so long as they remain strong. But that may be the exception– keep in mind that 16 of the 20 productive colonies had less than that rate of infection, and only 1 had more than 20% infected. On the other hand, in the nonproductive hives, 13 of 21 had at least 10% of the bees infected. So these data suggest that the “tip point” at which nosema noticeably affects honey production occurs when more than about 10-20% of the bees are infected.
Nosema ceranae was certainly present in my operation in June—we found infected bees in over half the colonies, productive or nonproductive. Keep in mind that our samples of only 10 bees would certainly underestimate whether infection was present—it’s likely that every single colony in my operation contained at least a few infected bees. But by early August, nosema was hard to find when I sampled for it, despite the fact that I had not applied any treatments. This relative disappearance of nosema in late summer appears to be common [9].
In conclusion, it did not appear that infection by nosema was the main cause for the differences in honey production between my strong colonies—other factors must have been involved. It also appears that if a colony is able to maintain its strength despite being infected with nosema at a low level, then it can still make honey. And finally, our results perhaps support Dr. White’s conclusion that colonies are less likely to be productive when more than 10% of the bees are infected by nosema.
Acknowledgements
Thanks to Brion Dunbar for completing the tedious task of squashing and scoring bees. And thanks to the donors to ScientificBeekeeping.com for supporting this sort of practical research.
References
[1] Fries, I (1993) Nosema apis – a parasite in the honey bee colony. Bee World 74 (1): 5-19
[2] Mayack, C and D Naug (2010) Parasitic infection leads to decline in hemolymph sugar levels in honeybee foragers. Journal of Insect Physiology 56(11):1572-1575
[3] https://scientificbeekeeping.com/sick-bees-part-17-nosema-the-smoldering-epidemic/
[4] Eischen, FA, et al (2011) Impact of nutrition, Varroa destructor and Nosema ceranae on colonies in southern Louisiana. Proceedings of the American Bee Research Conference 2011
[5] https://scientificbeekeeping.com/sick-bees-part-16-the-quick-squash-method/
[6] Traver, BE and RD Fell (2011) Prevalence and infection intensity of nosema in honey bee (Apis mellifera L.) colonies in Virginia. Journal of Invertebrate Pathology 107(1):43-49.
[7] https://scientificbeekeeping.com/sick-bees-part-15-an-improved-method-for-nosema-sampling/
[8] White, GF (1919) Nosema-Disease. USDA Bulletin No. 780. A free download from Google Books.
[9] Rennich, K, et al (2012) 2011-2012 National Honey Bee Pests and Diseases Survey Report. http://www.aphis.usda.gov/plant_health/plant_pest_info/honey_bees/downloads/2011_National_Survey_Report.pdf