


The Varroa Problem: Part 12- Building a Model
The Varroa Problem: Part 12
Building a Model
First published in ABJ November 2017
Randy Oliver
ScientificBeekeeping.com
In my last article, I showed the basic math of varroa buildup during the period of broodrearing, and the subsequent decline of the mite population when no broodrearing was taking place. My simple graphs were illustrative of the concept, but in order to understand the details, I needed to go much deeper.
In silico modeling
Scientists use Latin terms to describe the types of experiments being run. In bee research an experiment done in a test tube or Petri dish is termed “in vitro” (in glass); those performed with live caged bees would be termed “in vivo” (in the living); and those run in field colonies, ”in situ” (on site). A researcher can better control the variables (and save a lot of time and trouble) by running Petri dish and caged bee experiments. But as we often learn, those results may only apply in those artificial situations. Thus, for practical applicability, we must run large-scale field trials (which are often quite expensive in materials and labor).
When running field trials of varroa management methods, colonies receiving unsuccessful test treatments (as well as the untreated control group), often die from varroa overload (an expensive loss these days), and subsequent trials may not be able to be performed until the next season. So it would be of huge benefit to be able do what our weather forecasters do—to create computer models to predict theoretical outcomes based upon known inputs. Such computer simulations are termed “in silico” (in silicon) experiments—there is even a scientific journal called Ecological Modelling. Such computer simulations have proven (as in the case of weather forecasting) to be incredibly useful.
Early varroa models
The first comprehensive model of varroa population dynamics (in English) was created in 1994 [[1]] by the late and well-loved Dr. Ingemar Fries, who explained that:
Mathematical modelling offers a powerful tool to investigate complicated systems, among them, biological events. Provided that the construction of the model is relevant and that the actual data that goes into the model are accurate, much understanding of how the system is made up and reacts can be gained by comparing the impact of changes in parameter values [[2]].
In creating such a model, the developer defines the mathematical relationships between known various inputs (aka parameters; e.g., the initial mite population, the reproductive and mortality rates of the mites, and the amount of brood in the hive), and then puts together a computer model to create simulations that can then be tested against hard data from the field.
A few years later, Dr. Stephen Martin created an improved model [[3]]. Subsequently, others have created additional and more complex models [[4]].
However, I’ve long been frustrated by the fact that there hasn’t been what I considered to be a user-friendly and accurate computer model of varroa buildup available for use by beekeepers (and for researchers who aren’t mathematicians). A good model could be used to predict the mite population in a hive at any time of the season, and more importantly, to run simulations of various varroa control strategies.
Practical application: what would take years of trial and error in the field to figure out what works and what doesn’t (at the expense of many of lost hives), one could learn in minutes by running in silico simulations while sitting at his computer.
So some years ago (as you could see in my early articles) I created some simple models, which I found to be very helpful in my varroa-control strategy. But I realized that I needed a far more accurate model to work with.
Creating a user-friendly model
Disclaimer: I am neither a mathematician nor do I have any training in modeling. In truth, the formulas used in published models make my head swim. I’ve had to force my aged brain to wrap around the concepts of instantaneous rates of increase, logarithmic growth, and Poisson distributions. I intentionally used the most basic functions of the widely available application Excel to create this model, and avoided the use of complex mathematics so that every step would be understandable to those not versed in modeling.
What I wanted to create was a model into which any beekeeper could input values that reflected those of colonies in his/her apiaries and management style, and then test the effects of various mite management techniques and treatments, as well as allow for deeper investigation of mite resistance traits. And I wanted the output to be presented in clearly-understandable graphs. Something like this (Figs. 1 &2):

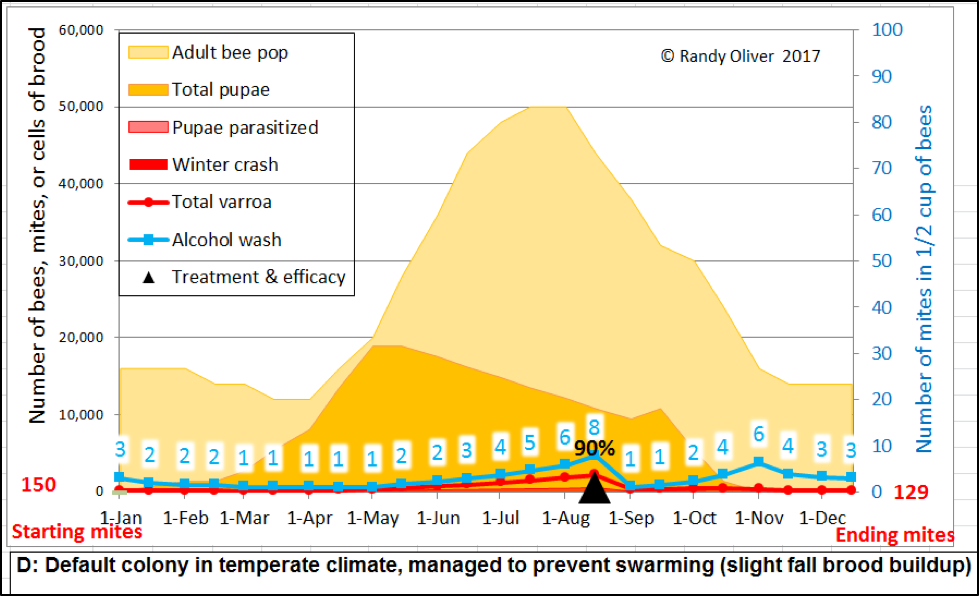
Figure 1. An example of two simulations, showing expected alcohol wash counts for a mid-latitude, cold-winter colony—first, with no mite treatment (top), and then given a mid-August treatment that killed 90% of the mites (bottom). The “r” value for mite increase was tweaked to be a bit to the low side for these two simulations, assuming a slight degree of mite resistance (beekeepers in southern states could only wish that mite management could be this easy).
So where would I start? I’d already played a bit with bee population dynamics, which turn out to be relatively easy to model, but which vary greatly from location to location. So I decided early on to simplify my model in three ways:
- Rather than having the model attempt to calculate the bee or brood population, simply have the beekeeper input average observed colony strength and brood area at each time point of the year specific to his location and operation. This would allow for the model to be adjusted to simulate mite buildup in hives anywhere in the world—based upon entered actual observed values by that beekeeper. It would also allow for simulating colonies started from nucs or packages at any time of year.
- To further simplify by assuming that in any simulation that the beekeeper would control varroa to the extent that I could ignore the effects upon the bees and brood from the in-hive virus epidemic that results from uncontrolled mite levels.
- I broke my calculations down into twice-monthly intervals [[5]], so that it would not be too tedious to input seasonal bee and brood measurements, yet still plot out nice curves on the output graph.
The above taken care of, I could now focus upon the basic concepts of any population model–BIDE (Birth, Immigration, Death, and Emigration). The mite’s birthrate here is key—varroa wouldn’t be a problem if it didn’t reproduce so steadily in the hive. So I needed to calculate a new “r” value for the mites’ intrinsic rate of increase for each 15-day time interval. In order to do this, I needed to estimate how long the average mite would be phoretic, relative to the number of days that it spent reproducing in a worker or drone cell.
A learning experience
At this point I needed to educate myself deeply on all that is known about varroa reproduction, which meant reading and rereading all the scientific papers on the subject from the mid ‘80’s on, as well as asking other researchers for unpublished data [[6]]. The starting point for my calculations was the same study as that used by Dr. Stephen Martin for his model [[7]] — the findings of Willem Jan Boot [[8]], who determined that female mites do not actively “seek” a cell to enter, but rather depend upon the chance of the nurse bee upon which they are riding to stick its head into a cell of a mature larva about to be capped over [[9]].
Boot’s findings meant that by inputting values for the number of frames in the hive covered with bees relative to the amount of brood, I could calculate the ratio of adult workers to 8-day larvae, and thus estimate the number of days that the average mite would be phoretic [[10]] relative to the ~12.5 days that it was in a cell. The sum of those two figures would be an approximation of the amount of time required for an average mite’s complete reproductive cycle, and the ratio would tell me the percentage of mites that would be phoretic at that time. The only other input that I needed for the colony was the percentage of brood cells that were drone brood.
Practical application: since the heart of the model is this particular calculation, the user must take the time to carefully look into representative hives in his operation (not guess), and then enter visually confirmed and accurate values for frames of bees, amount of brood, and proportion of drone brood. Any increase or decrease in broodrearing will strongly affect the alcohol wash count, since mites move into or out of the brood. Even small errors in inputs may result in inaccurate simulations. The axiom “garbage in, garbage out” applies–the model can produce accurate simulations only if the user enters accurate bee and brood numbers.
From the literature I gleaned figures from all over the world (especially from Stephen Martin’s numerous and meticulous studies) on the average number of daughters per foundress mites in worker and drone brood, as well as the percentage of those daughters that get successfully mated [[11]]. Add in figures for mite survivorship and drift, and I was ready to start work (Fig. 3).
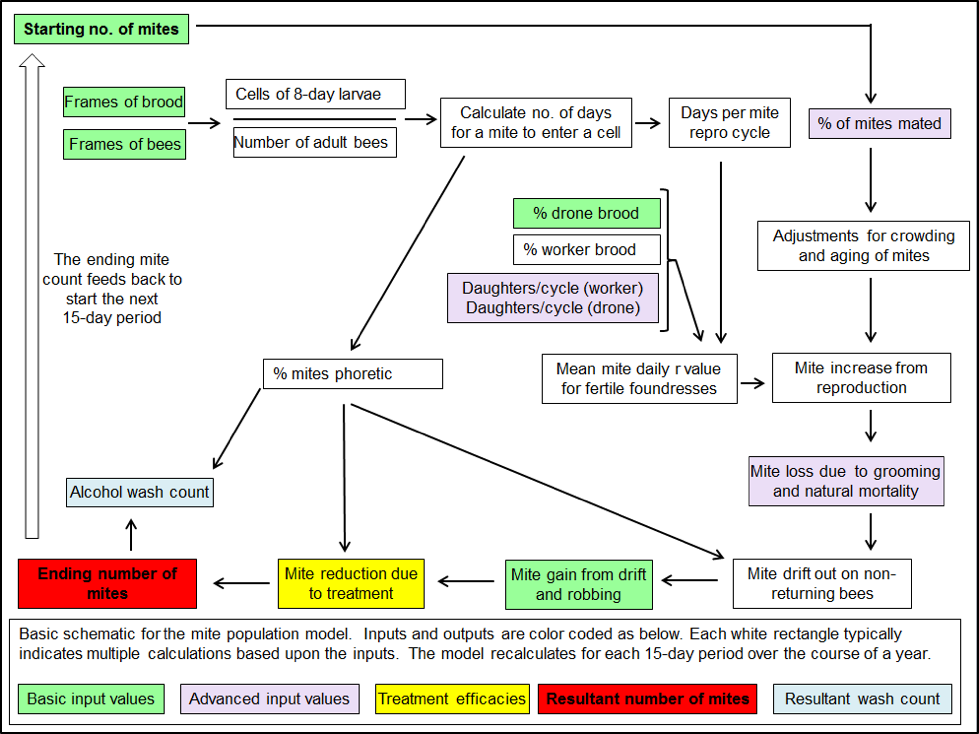
Figure 3. A very simplified schematic for one 15-day cycle of my mite population model. The actual model, created in Excel, performs over 70 calculations for each of 24 15-day intervals in order to create the sort of simulation shown in Figures 1 & 2 (those 1700 calculations are performed instantly each time you hit “return”).
Since few beekeepers would be willing to perform the tedious steps necessary to determine the total mite population of the hive [[12]], I set up the model so that the starting number of mites (or mite levels at any time point) could be estimated from field-confirmed alcohol wash counts alone.
It’s all about the “r”
The core of the model is the calculated average “r” value (the rate of increase) for the mite population in the hive for each time interval[[13]]. To calculate the r value for each interval, the model needs to calculate the length of time involved in an average mite reproductive cycle for that period, and then use other optional input values to fine tune the output for any beekeeper’s specific operation and location.
As pointed out by Wilkinson [[14]], a good model could be also used by bee breeders to understand which resistance mechanisms were likely to give the most bang for the buck (this is termed by modelers as “sensitivity analysis” [[15]]). I’m finding recent studies on the apparent mite resistance mechanisms used by various bee stocks to be fascinating. So I created the model to allow the user to adjust the inputs for number of daughters and percent mated daughters, mite survivorship during both broodless and brooded periods (to account for increased grooming behavior), as well as for some other parameters. By tweaking such factors (including the amount of drone brood in the hive), it’s easy to see how strongly tiny differences can affect mite buildup over the course of the season.
One interesting final tweak to the model was the result of a conversation that I was having with Dr. Stephen Martin. He observed that late in the season, a proportion of the mites would have aged to the extent that they run out of stored spermatozoa—making them no longer reproductive. So I added a calculation to account for those “spent” mites (which improved the simulations).
Mite drift
There can be a surprising amount of hive-to-hive drift of bees within an apiary—up to 40% of the workers in a hive may not have been “born” in that hive [[16]]. This exchange of bees also results in an exchange of varroa throughout the apiary [[17]]. I used data from several sources to allow for adjustments to the amount of mites entering into the hive (immigration), either from bees drifting in from other hives, or from returning robbers who picked up hitchhikers as they were plundering mite-weakened hives.
Practical application: unfortunately, as with diffusion of chemicals in solution, mite drift generally goes in the direction from high-mite hives to low-mite hives. As many beekeepers have noticed, this drift from unmanaged hives can overwhelm their own hives with mites. It hurts those who are controlling their mites than it does those who don’t. The model shows clearly shows this effect.
There is also mite emigration from a hive. On average, as many bees die each day as emerge from the brood, and after midsummer more fly off to die each day than are born—roughly a thousand bees exit each day never to return. A proportion of those bees carry a mite, and it appears that as the mite infestation rate increases, that proportion increases even more [[18]]. This drift of mites out of the hive results in appreciable loss of mites, especially later in the season (up to 100-200 mites per day).
Practical application: the question remains to what extent some of those exiting bees (with their riders) wind up in other hives.
Treatments
The synthetic miticides, when first brought to market, are remarkable effective at reducing mite levels in the hive, with kills of 95% or better. However, as mites evolve resistance to overused miticides, that kill rate goes down. Improper application of the treatment (such as by not placing strips into the broodnest, or by cutting corners otherwise) can also reduce efficacy.
So I allowed in the model for the user to input the percent mite reduction from a treatment applied at any time point [[19]]. I set up the display to show the percentage of mites that are phoretic at any time, so that it is easy to calculate the expected mite reduction from short-action treatments such as oxalic dribble or vaporization, or sugar dusting. I also calculated the mite reduction due to drone brood trapping or swarming.
Practical application: I find the model quite useful for running simulations for various treatment methods.
Evolution of the varroa/honey bee relationship
The varroa mite and the honey bee are coevolving in different ways in various regions, so I designed the model to allow the user to adjust it specifically for the mites and bees in his area.
Validation of the model
This model went through many dozens of iterations before I was comfortable enough with it to share it (it will always be a work in progress—in fact, I’m madly working on it as I write this article). Any model is worthless until it is validated against actual field data (as are the weather models, which are tested against historical data, as well as the daily weather forecast). This model is certainly no exception.
I focused upon two main validation methods:
- I set the model to display the average r value for the time period of mid April through mid September. This value must reflect the values obtained in the many published studies that calculated the rate of mite increase (or from which I could calculate it) over that period of time [[20]]. The model shows this value for every simulation run, so that the user can check the results of his inputs vs. measured hard field data.
- I check the results against alcohol wash measurements–mite counts from any research paper I could find, the BIP numbers, unpublished data, my asking beekeepers all over the world, and especially against the mite counts in my own operation.
I tweaked and tweaked the calculations day after day, week after week, month after month, until the model accurately predicted the alcohol wash counts in my own hives, reflecting different colony managements and treatments. As a result of having taken thousands of alcohol wash counts, I’m well aware of the large degree of hive-to-hive variability, but the model hits the median values of alcohol washes spot on).
Colony crash
I found it useful to make the model demonstrably show when a colony would be expected to crash from an overload of mites (and virus-induced PMS [[21]]) (Fig. 5).
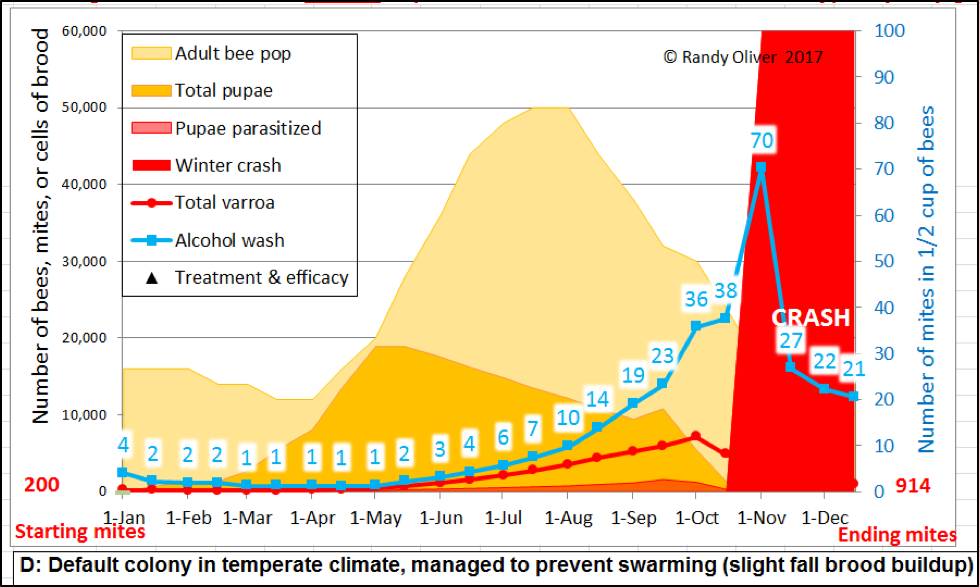
Figure 5. I set the model to indicate in bright red an expected colony collapse should the late-summer alcohol wash count exceed 70 mites per half cup of bees, or a 7% infestation rate if the colony is broodless. Either of those numbers can be set by the user.
The above arbitrary indicators for a crash are likely conservative for some areas and colonies –since collapse is largely dependent upon the virulence of the local virus strains and hive nutrition, as well as the degree of resistance of the colony to those viruses (Russian bees and AHB are notably resistant). Also, colony collapse when brood is present may actually be more related to the infestation rate of the brood, rather than that of the adult workers. As detailed in a fascinating paper by Vandame [[22]], once the percentage of worker brood infestation exceeds about 30% (15% in AHB), that colony is usually toast [[23]]. So I also set the model to calculate the percentage of brood cells that would be infested by one or more mites—and to also show it in the output graph as the reddish “Pupae parasitized” layer (see above).
A work in progress
My model is nowhere near as mathematically elegant as others created by those who know what they are doing. However, it has achieved my goal of being user friendly, visually clear, surprisingly accurate, and extremely useful. In our own operation, we routinely use it to make management decisions regarding varroa. I developed this model with the intent of making it freely available to beekeepers and researchers, and hope that others will help me to improve it.
Try it yourself!
I’ve posted a downloadable beta version of the model at https://scientificbeekeeping.com/randys-varroa-model/ I will continue to update the model, especially if I get feedback or expert suggestions for improvement, so be sure to check the date of the version at the page above (reload the page, so that your cache doesn’t show on outdated version).
Next month I’ll continue with what I’ve learned from the model, and tips on how to use it.
Acknowlegements
The bee research community recently lost our beloved Ingemar Fries, who was instrumental in kick starting varroa modeling. Thank you Ingemar.
And thanks to Peter Borst for his assistance in literature research, and to Katie Lee, and John Harbo, Jeff Harris, Jose Villa, and Bob Danka, whose data sets I found to be invaluable. And I owe a huge debt of gratitude to Stephen Martin, whose original paper on varroa modeling first inspired me, and whose subsequent research allowed me to fine-tune this model.
I wish to thank Dan O’Hanlon and the West Virginia Beekeepers for their initial donation in 2012 in support of me developing my first (and primitive) mite model. And to my ever patient and loving wife Stephanie, who, over the course of the past year has been a varroa widow as “The Model” consumed my waking hours and weekends [[24]].
Notes and citations
[1] Fries, I, S Camazine, J Sneyd (1994) Population dynamics of Varroa jacobsoni: A model and a review. Bee World 75: 4 – 28. Ingemar, after a long and illustrious career as a bee researcher, passed away some months ago, but not before inspiring a new generation of bee researchers. Scott Camazine was a brilliant bee researcher in his early days, who, unfortunately for us, pursued a career in medicine.
Ingemar continued to improve his model—the 1999 version has nice graphs of adult bees vs. amount of brood. He also uses this model to predict the effects of treatments.
Calis, JNM, I Fries, SC Ryrie (1999) Population modelling of Varroa jacobsoni Oud. Apidologie 30(2-3): 111-124.
[2] Fries I. (1996) Dynamics of the parasitic (Varroa jacobsoni) population: modelling criteria, in: Lasram M. (Ed.), The Varroosis in the Mediterranean region, Centre International de Hautes Etudes Agronomiques Méditerranéennes (CIHEAM), Zaragoza (Spain), pp. 23-32.
[3] I owe a huge debt of gratitude to Dr. Stephen Martin, whose original paper on varroa modeling I drew heavily from. Martin, S (1998) A population model for the ectoparasitic mite Varroa jacobsoni in honey bee (Apis mellifera) colonies. Ecological Modelling 109: 267 – 28. Available on the Web.
[4] There have been a number of models published, including Varroapop from ARS’s Carl Hayden Bee Research Lab. A recent and very complex example would be:
Ratti, V, et al (2015) A mathematical model of the honeybee–Varroa destructor–Acute Bee Paralysis Virus system with seasonal effects. Bull Math Biol 77:1493–1520.
[5] It’s easy to expand the model to 365 daily inputs, in order to better understand the effects of induced brood breaks or short-term treatments.
[6] A special thanks to now Dr. Katie Lee, who shared the voluminous data from her doctoral thesis, and to Dr. Bob Danka. Also thanks to Drs. Stephen Martin and Jose Villa.
[7] A huge improvement over Fries’ original model, which did not account for the variation in the phoretic period. Refer to Table 2 in:
Harbo, JR & JW Harris (1999) Selecting honey bees for resistance to Varroa jacobsoni. Apidologie 30: 183-196.
[8] Boot, WJ, JNM. Calis & J Beetsma (1993) Invasion of Varroa jacobsoni into honey bee brood cells: a matter of chance or choice? Journal of Apicultural Research 32: 167-174.
Also, Willem Jan Boot, WJ (1995) Invasion of Varroa mites into honey bee brood cells. Thesis, Wageningen University.
Calis, JNM, WJ Boot & J Beetsma (2006) Attractiveness of brood cells from different honey bee races (Apis mellifera) to Varroa mites. Proc. Neth. Entomol. Soc. Meet. 17: 55-61. Open access.
[9] This model is a work in progress! As I was working on a draft of this article, I went back to Harbo and Harris (1999) Op cit, and added another parameter to the model—an option to add days to the mites’ phoretic period. As noted by those authors, this potential mode of resistance has a profound effect upon mite buildup.
[10] Similar to ticks and tracheal mites—at least at some point during their phoretic periods, mites exhibit “questing” behavior—triggered to leap off their ride onto a late-instar larva appropriate for reproduction.
[11] Serious researchers using this model would need to confirm these average values for the bee/varroa population that they were studying, since the host/parasite relationship between bees and varroa is continually evolving, apparently in different ways in regional bee/varroa populations. The model allows for easy adjustment of these observed values.
[12] The Baton Rouge Bee Lab uses the following method: Count the number of mites in 200 worker brood cells (50 from each side of two combs), then count the mites in 100 drone brood cells (50 from each side of one comb or from several nest areas when drone brood was scattered), then estimate the number of mites per 100 adult worker bees by alcohol wash, then perform comb area estimates (to the nearest 5%) of the numbers of sealed worker and drone brood cells in the hive, and make comb by comb estimates of the number of bees (to the nearest 5%) comprising the colonies. Brood sampling involves opening cells along a row of cells through the center of the brood pattern to avoid bias resulting from the patchy distribution of infested cells. Mother mites and their daughters were individually recognized according to the methods of Ifantidis. Yes, this is how meticulous and tedious accurate scientific field work can be—this was done monthly for yards of hives over the course of two years. Modified from: Rinderer, TE, et al (2001) Resistance to the parasitic mite Varroa destructor in honey bees from far-eastern Russia. Apidologie 32 (2001) 381–394 381.
[13] See my previous article, as well as:
Harbo, JR & JW Harris (1999) Op cit.
[14] Wilkinson, D & GC Smith (2002) A model of the mite parasite, Varroa destructor, on honeybees (Apis mellifera) to investigate parameters important to mite population growth. Ecological Modelling 148: 263 – 275.
[15] Fries ran sensitivity analyses with his original model; his conclusions were that: “The steep slopes in the sensitivity curves for the number of reproductive cycles of the mother mite, the fertility of the mother mite, the number of offspring produced in worker cells under low infestation rates, and the amount of drone brood in the colony indicate that these parameters have a large effect on population growth.” My model, although using different equations, produces similar results. When investigating various resistance mechanisms that bees can use against the mite, tweaking these parameters is quite instructive (and reflects recent research findings).
[16] Pradella, D, SJ Martin FR Dani (2015) Using errors by guard honeybees (Apis mellifera) to gain new insights into nestmate recognition signals. Chemical Senses 40(9): 649–653.
Pfeiffer, KJ &K Crailsheim (1998) Drifting of honeybees. Insectes Sociaux 45(2): 151–167.
[17] Nicely reviewed in:
Nolan, MP IV & KS Delaplane (2016) Distance between honey bee Apis mellifera colonies regulates populations of Varroa destructor at a landscape scale. Apidologie DOI: 10.1007/s13592-016-0443-9 Open access.
[18] Cervo, R, et al (2014) High Varroa mite abundance influences chemical profiles of worker bees and mite–host preferences. Journal of Experimental Biology 217: 2998-3001 Open access.
[19] I agonized over this, since for some treatments, recalculating on a daily basis would give more accurate results, but it made the model unwieldly to use. However, the model can be easily expanded by those interested to calculate on a daily basis (which I have done for some mite management methods).
[20] E.g., Branco, MR, et al (1999) Development of Varroa jacobsoni in colonies of Apis mellifera iberica in a Mediterranean climate. Apidologie 30(6): 491-503.
[21] Parasitic Mite Syndrome—in which larvae and pupae begin to die from stress, viruses, and other infections.
[22] Vandame, R, et al (2000) Levels of compatibility in a new host–parasite association: Apis mellifera/Varroa jacobsoni. Canadian Journal of Zoology 78(11): 2037-2044
[23] A very interesting thing that I found when developing the model is that in two independent data sets, the rate of infestation of the brood increased roughly twice as rapidly as that of the adult bees—suggesting that it’s good to keep mite counts low.
[24] I’ve spent nearly every early morning and many days working the bugs out of each iteration of “The Model.” I now feel that I know varroa better than I know my own wife