


Understanding Colony Buildup and Decline – Part 2
Understanding Colony Buildup and Decline – Part 2
Randy Oliver
ScientificBeekeeping.com
First Published in ABJ in March 2015
CONTENTS
Recruitment and Attrition
Looking At The Numbers
The Annual Cycle
Late Winter Equilibrium
Visualizing Colony Demographics
Acknowledgements
Citations and Footnotes
My sons are in the slow process of learning how to take over more responsibilities in our beekeeping operation. This then leads them to ask me a myriad of questions, for which I attempt to provide knowledgeable answers. In doing so, I often realize how little I actually know about certain aspects of bee biology and wise management.
In attempting to answer their question on buildup for almonds, I realized that I needed to dig deeper into what’s actually involved in colony growth and decline. In order to survive in a wide range of habitats and seasonal conditions, the incredible superorganism that we call a honey bee colony has developed intrinsic regulatory mechanisms to adjust its population up or down according to the season and conditions.
Over the course of a season, the colony population may drop to as few as 7000 workers in order to allow it to survive the frigid winter by conserving its precious food stores, and then grow quickly in spring so that it can reproduce by swarming at the optimal time. It then rapidly recovers and builds to up to maximum population (perhaps as many as 60,000 individuals) at the peak of the main nectar flow, so that the huge workforce can take full advantage of the few weeks of heavy nectar flow, storing enough honey to last for the rest of the year.
And then the colony must quickly drop its population in expectation of the lean times that follow so that it doesn’t eat itself out of house and home. The fascinating thing is that the colony effects these major swings in its population without benefit of either an organismal brain nor central command, and does so in such a smooth and ordered manner.
So how in the world does this group of individual insects manage to self regulate its population size so perfectly? And how can beekeepers use such knowledge to better manage their hives? In answer, let’s begin by elucidating the annual population cycle.
But first allow me to clarify the most fundamental concept of population growth or decline:
Recruitment and Attrition
The day-to-day change in the number of adult bees in a colony is determined by a simple equation:
![]()
In simple English, that means that change in population (∆P) over any time period (t) is the arithmetical difference between “recruitment” (the number of “births” of new workers emerging from the sealed brood (Fig. 1)) and “attrition” (the number of deaths occurring over that same interval). Attrition is generally invisible, since it is an innate behavior of bees about to die from old age, wear, or illness to commit “altruistic self removal” by using their last bit of energy to fly away and disappear.
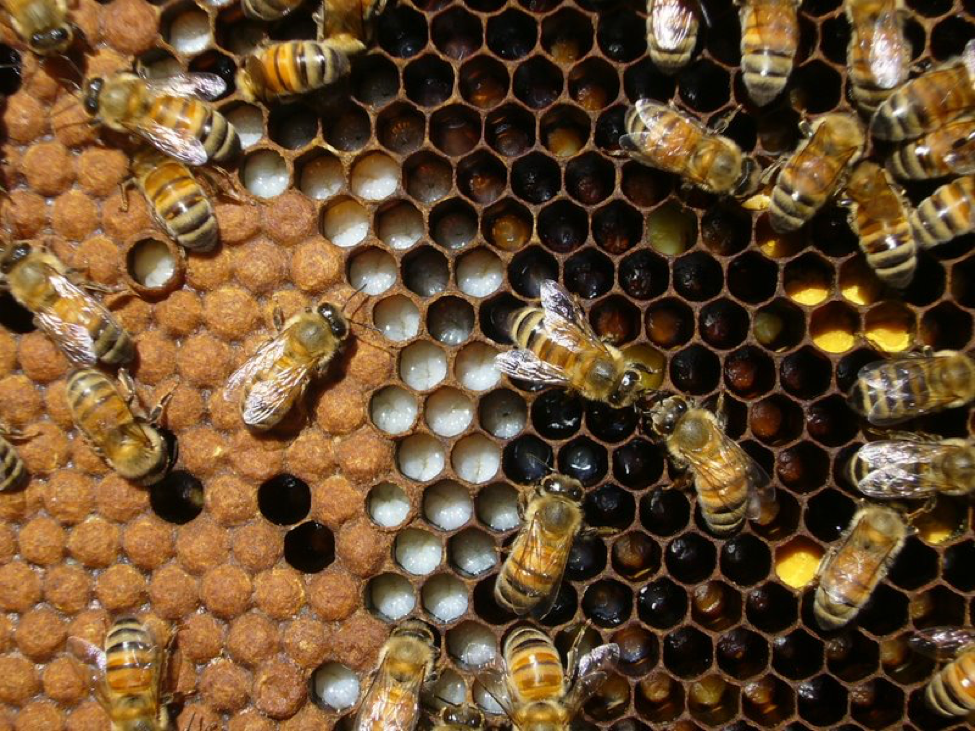
Figure 1. The potential growth of a colony is limited by its daily recruitment–the number of workers emerging from the sealed brood. The colony’s net growth is then limited by the rate of attrition—determined by the overall longevity of the bees already constituting the cluster.
Practical application: when recruitment exceeds attrition, a colony grows in population; when attrition prevails, the colony declines. The greater the difference between these two variables, the steeper the slope of either growth or decline. Thus, many bee management decisions have to do with either affecting the rate of recruitment, or with avoiding excessive attrition.
Looking At The Numbers
In order to get a firm grasp of the day-to-day balance of the recruitment vs. attrition equation, I plotted out the average daily net gain or loss during each 15-day interval [1] over the course of the season (Fig. 2):
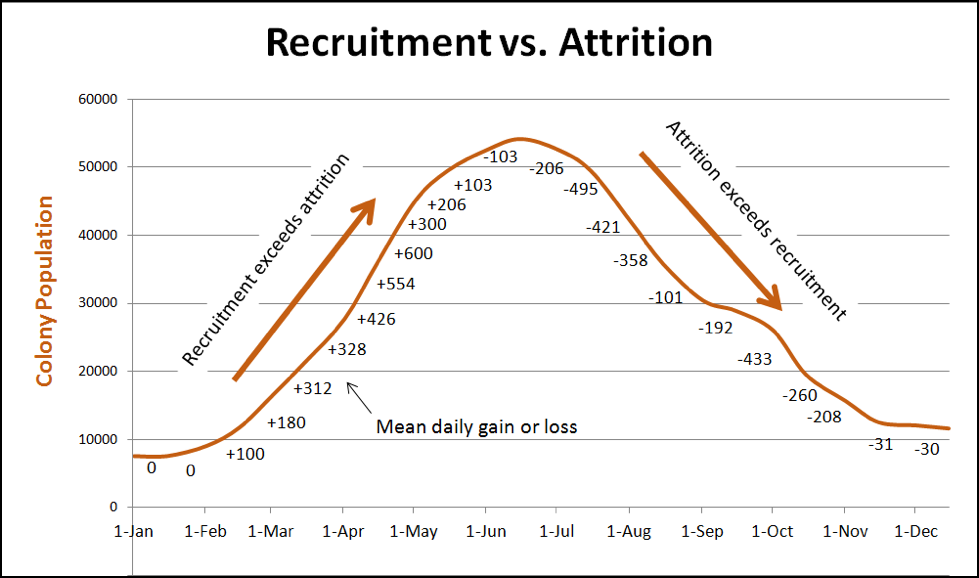
Figure 2. Colony growth or decline is determined by the daily difference between the recruitment of new workers versus the attrition of older workers. The rate of growth illustrated above approximates what I might observe in a vigorous overwintered colony in the California foothills growing from 4 to 30 frames of bees (without swarming). I included a bump for the renewal of broodrearing due to fall bloom (although this has not naturally occurred during our drought). Note how small are the daily gains in population, compared to the ability of a queen to lay 1500 eggs per day.
Practical application: I compared the above daily gains to data from 1976 [2], prior to parasitic mites. In the most rapidly-growing overwintered colonies in those glory days, the daily gain was about 550 bees per day during the steepest growth period, so my best colonies appear to still grow at about the same rate as those prior to varroa and Nosema ceranae.
A Note of Appreciation
Bee researcher Lloyd Harris, in pursuit of his Master’s Degree at the University of Manitoba [[1]] back in the late 1970’s, undertook the incredibly challenging and tedious task of gathering field data to allow him to create an accurate model that could be used to predict colony population over the course of the season. To do so, he started 30 package colonies in two consecutive years, in which he marked cohorts of newly emerged workers, and then reopened the hives every 12 days (the length of the sealed brood stage) to mark more bees and to count the number of surviving previously marked bees, as well as to painstakingly recording the amount of sealed brood at each inspection.
He over wintered the hives, and continued his Herculean efforts. During the 3-year study, he collected longevity data on 37,150 individually marked bees. The second and third year of the study produced 40 consecutive counts over a 16 month period.
From that data he was indeed able to create a very accurate model, but then sat on the data for over 20 years, until he finally coauthored a paper in 2001 [1], after which he’s subsequently published four more.
Lloyd has been extremely generous and helpful to me over the past few years, sharing his extraordinarily valuable original data sets, and helping me in my attempt to understand honey bee population dynamics. I’ve used his data and insights extensively throughout this article.
Colony growth or decline is completely defined by the relationship between recruitment and attrition. We saw last month from Nolan’s data that colonies have the capacity to grow at an extraordinary rate under ideal conditions. Our question then, is what are the limiting factors that restrain such growth at other times of the year? And again, keep in mind that those limiting factors need only to exert their effects upon two variables: recruitment and attrition. I’ve listed some factors that come to mind in Table 1.
| Factors Affecting Recruitment | Factors Affecting Attrition |
| The supply of nutritious pollen or beebread | Nutrition available to newly-emerged workers |
| The behavior and jelly production by the nurses | Shorter longevity due to being chilled as brood |
| The individual queen’s capacity to produce eggs | The degree of early worker mortality |
| The size of the broodnest available to the queen | The epigenetic regulation of worker longevity? |
| Proper temperature environment in the broodnest | Age of first foraging |
| Cannibalism of eggs by workers | The wear of foraging due to wind, distance, cold |
| The proportion of larvae that reach adulthood | Predation upon, or disorientation of foragers |
| Larval disease due to pathogens or parasites | Disease due to pathogens or parasites |
| Larval disease due to pesticides or other toxins | Poisoning by pesticides or other toxins |
Table 1. Factors affecting recruitment or attrition. Any or all of the above factors can shift the balance between the rates of recruitment and attrition, resulting in either colony growth or decline.
Practical application: if the beekeeper has an understanding of the internal and external factors that limit either recruitment or longevity, he may be able to manage those factors to better achieve his goals.
The Annual Cycle
In temperate regions, colony populations follow a fairly predictable cycle (although some colonies grow much larger than others, and some, unfortunately, are unable to complete the cycle). In order to better investigate the regulatory mechanisms involved in colony population dynamics, I’ve broken the annual cycle down chronologically into ten distinct periods of population dynamics:
- Late-winter coming out of “hibernation.”
- First pollen and initiation of spring broodrearing in earnest.
- The “spring turnover” when a new generation of bees replaces the “survivor bees” that held down the fort during winter or extended pollen dearth.
- The linear portion of growth during the spring nectar and pollen flows, but prior to the main honeyflow.
- The swarming impulse.
- The main honeyflow and the putting away of stores for winter (and perhaps a surplus).
- Late summer population decline ((typically in mid July or August).
- The post-frost cessation of broodrearing (typically in October).
- The “fall turnover” of the population as newly-emerged “winter bees” replace the rapidly-dying “summer bees.”
- Midwinter initiation of minor broodrearing to maintain the population.
In the remainder of this article I will address the dynamics of colony growth or decline during each of the above time periods in turn. Let’s begin at the colony’s low point in midwinter.
Late Winter Equilibrium
Beekeepers (unless they pollinate almonds) don’t normally spend much time peering into the winter cluster, since colonies are best left undisturbed during this time. Some may have the impression that the colony is in “hibernation.” But that doesn’t mean that nothing’s going on inside that ball of bees (Fig. 3).
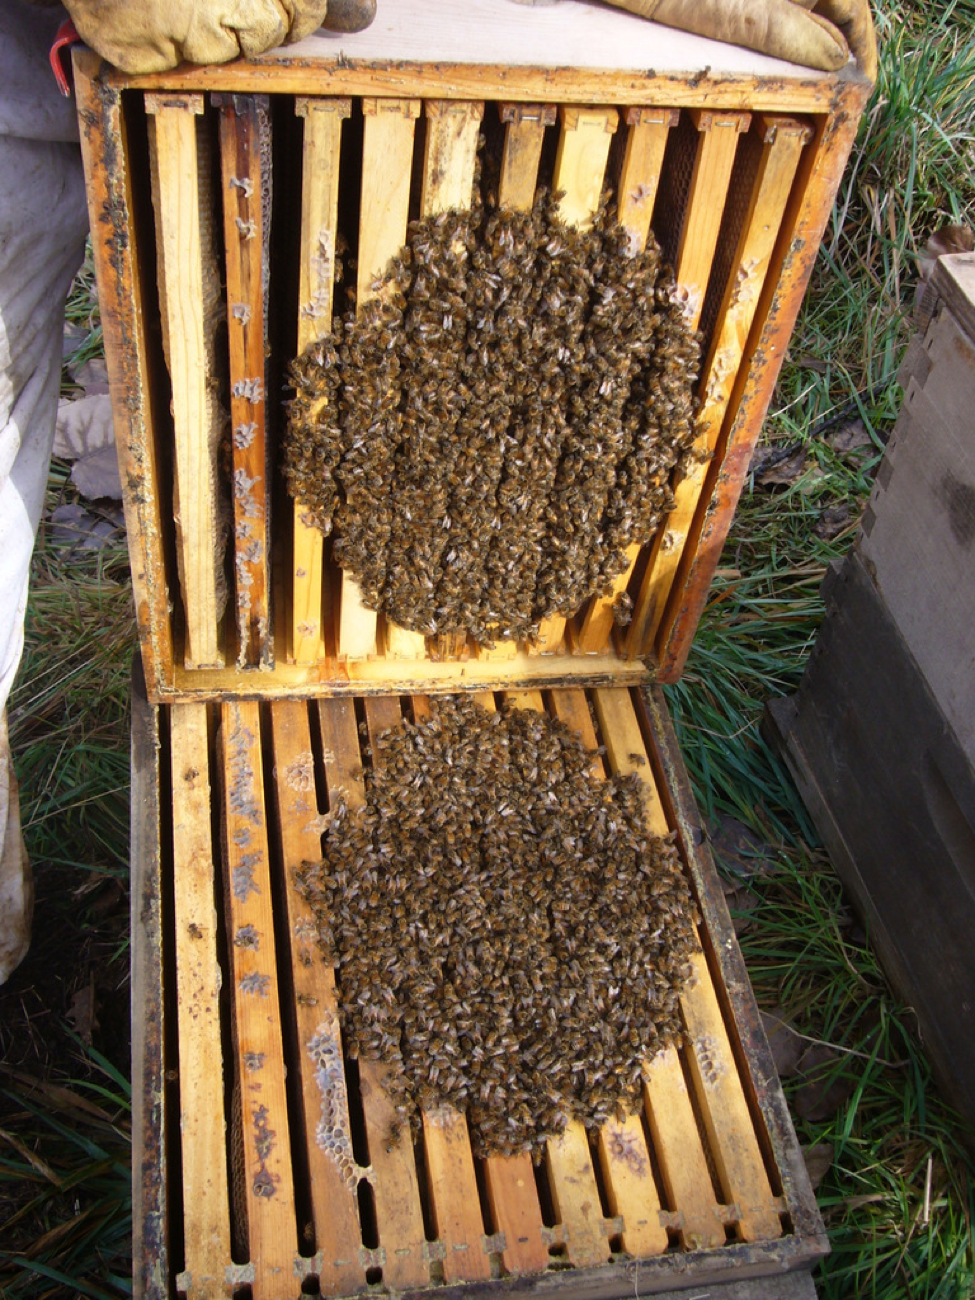
Fig. 3. The dynamic winter cluster. During cold weather the colony coalesces into a warm-blooded ball to maintain a tropical temperature within, as well as to better conserve the heat generated by the metabolic burning of honey. But that doesn’t mean that things aren’t happening within that cluster.
It’s easy to think that the bees are in “hibernation” in the cluster, but that’s hardly the case. In temperate climes, queens typically shut down egglaying during November [3], but then resume again sometime in December [4]—well before the winter solstice. In the depth of winter, colonies with adequate stores of beebread initiate broodrearing in order to maintain the recruitment of fresh workers to take the place of the aging “winter bees.” Late-winter broodrearing then allows the colony to start growing its population to be ready to take advantage of the first spring tree pollens (which then stimulate broodrearing in earnest). Harris [5], when tracking the age structures in a group of colonies shed-wintered in Manitoba, found that:
In March, the most striking feature of colony age structures when the colonies were removed from the overwintering facility was the large proportion of the colony that had been reared during the winter. Approximately 50% of the colony’s populations had been reared in August, September and October, the rest during the winter. The amount of brood reared during winter was almost equal to the number of bees that had died during the winter. If colonies are to maintain their numbers during winter, they must rear some brood. If they do not, their numbers in March will only be about half of what they were in December.
Indeed, one of Harris’ tracked colonies came out of winter with more bees than it had when it when into the shed.
Practical application: the above can only occur if the hive is packed with beebread. We California almond pollinators are generally not that fortunate unless we have a good fall Rabbitbrush location. As a result, many of us feed pollen sub in fall and/or over winter.
But Harris was studying hives wintered in sheds. Hives placed in outdoor holding yards in mild-winter California can go downhill severely due to:
- The ambient temperatures not being conducive to the formation of an energy-efficient cluster,
- The wearing out the workers due to “fruitless foraging”–especially if the colonies are stimulated by the feeding of sugar syrup,
- The negative effects of robbing and defense (especially in crowded holding yards), and
- The transfer of parasites and pathogens (in said same yards).
Practical application: Canadian beekeepers have long experience with shed wintering. Of late, a number of commercial almond pollinators are finding that wintering hives in sheds can reduce winter mortality and feed consumption.
I looked a bit closer at Harris’ original data for those shed-wintered hives. By mid December, the colonies averaged only a bit over a 6-frame cluster [6], yet 3 months later in mid March, they’d only dropped to 5.4 frames. What is of interest is that although there was a bit of broodrearing going on, the main reason that the colonies were able to maintain their populations was that the “winter bees” lived amazingly long lives—with average lifespans of some marked cohorts often over 150 days (and some individuals up to 250 days).
Visualizing Colony Demographics
In order to more visually appreciate the changes in colony population age structure (proportion of worker bees in each age class), I spent a couple of weeks’ worth of mornings and evenings entering his data into a spreadsheet, and playing with how best to display it [7]. The culmination of those efforts is the colorful chart below (Fig. 4).

Figure 4. Seasonal demographics of a colony headed by a vigorous young queen, shed wintered in Manitoba. Each band of color represents the proportion of bees in each 12-day age class at any time point. Red (0-12 days of age) through green (61-72 days) age cohorts represent short-lived “summer bees,” which rarely live longer than two months. The blue and violet age classes are the long-lived “winter” (diutinus) bees that hold down the fort when there is no incoming pollen (and thus little recruitment). The dotted line represents the number of cells of brood. The numbers along the x axis represent the average age of all bees in the hive at any time point.
Update: I’ve added a clearer version of The Graph–click on it to see an enlargement.

When I finally created the graph, I just sat back and stared at it. What a wealth of information in one figure! I was surprised by how the amount of brood peaks so early in the season. I could easily see how the diutinus bees age in the winter cluster, abruptly dying off in early spring, followed by the impressively rapid population expansion of the youthful “summer” bees in order to put on the honey crop. And look how strikingly the concepts of “spring-” and “fall turnover” are illustrated. I realized that one could base a book (or at least my next several articles) on this chart.
Note that the average age of a bee in the hive during the period of spring through fall never exceeds 30 days, compared to average ages of over 100 days during winter. This has important ramifications when I later discuss the buildup of parasites and pathogens in the hive, and the seasonality of disease.
In other climates and conditions, you can easily adjust the chart. For example, in Alaska, the “summer bee” portion would be even more compressed. On the other hand, in Hawaii or Florida, you’d snip out all the blue age classes and stretch the center area to fit the year. In warm arid areas such as Southern California or parts of Mexico, the presence of diutinus bees, instead of during winter, would occur at any time that broodrearing is restricted during dry summertime dearth. And in some areas, there may be two peaks of buildup during the season. But no matter where, the same principles apply to how the colony manages its population.
I will post a printable version of this chart to my website, should you want to keep it for reference. And I will return to it time and again in subsequent installments of this article.
We’ll pick up again at the most critical time of the year for colonies living where no flowers bloom during the winter—the “spring turnover.”
Acknowledgements
Thanks again to Lloyd Harris and all the hardworking bee researchers who have spent years investigating bees for our benefit. And to my ever so patient wife Stephanie, who only sees my back while I’m buried deep in spreadsheets and pdf’s. Of course I cannot forget my comrade in research Peter Borst, and also wish to thank the donors to ScientificBeekeeping.com, who allow me to spend the time necessary in writing these articles.
Citations and Footnotes
[1] Simply because a smooth graph can be plotted with points at 15-day intervals; the daily changes in population are the means for each 15-day period.
[2] Lloyd Harris’ original data, courtesy of Lloyd.
[3] In my snowy foothill location, every queen used to shut down in November back 35 years ago. Nowadays, unless we have a really cold fall, only a few do. We use this break in broodrearing as a window of opportunity for varroa management.
[4] Even when the hives are in pitch black wintering sheds in Canada.
[5] Harris, JL (2008) Development of honey bee colonies initiated from package bees on the northern Great Plains of North America. Journal of Apicultural Research and Bee World 47(2): 141–150.
Harris, JL (2009) Development of honey bee colonies on the Northern Great Plains of North America during confinement to winter quarters. Journal of Apicultural Research and Bee World 48(2): 85-90.
[6] For the control group. I calculated cluster size from his population estimates, by dividing the population by 1800 bees per frame.
[7] I based the graph on the averaged values for Lloyd Harris’ colonies 4b and 5b, which represent colonies headed by young queens. Colonies headed by year-old queens built up much more slowly, and never grew as large.