
Winter Colony Losses

October 13, 2013
A Pesticide-Free Control Group
The Midwinter Assessment (Size Matters)
Spread of Infection From Hive to Hive
Winter Colony Losses
Randy Oliver
ScientificBeekeeping.com
First published in ABJ September 2013
For nearly a decade now beekeepers have been experiencing a higher rate of overwintering losses than “normal.” My field research has given me some insights as to some of the factors involved.
Supplying strong hives to pollinate California almonds has become a critical aspect of commercial beekeeping. The winter months leading up to almond bloom are stressful for colonies kept in all but the warmest areas. Honey bees are unique among insects in cold-winter areas in that they maintain an elevated body temperature over the course of the winter by generating heat in a tight winter cluster (Fig. 1). The cluster is composed of ever-aging bees susceptible to a variety of parasites and pathogens. These geriatric bees must initiate midwinter broodrearing, often in the absence of incoming pollen or nectar. Not all colonies are able to successfully grow to pollination strength by mid February.
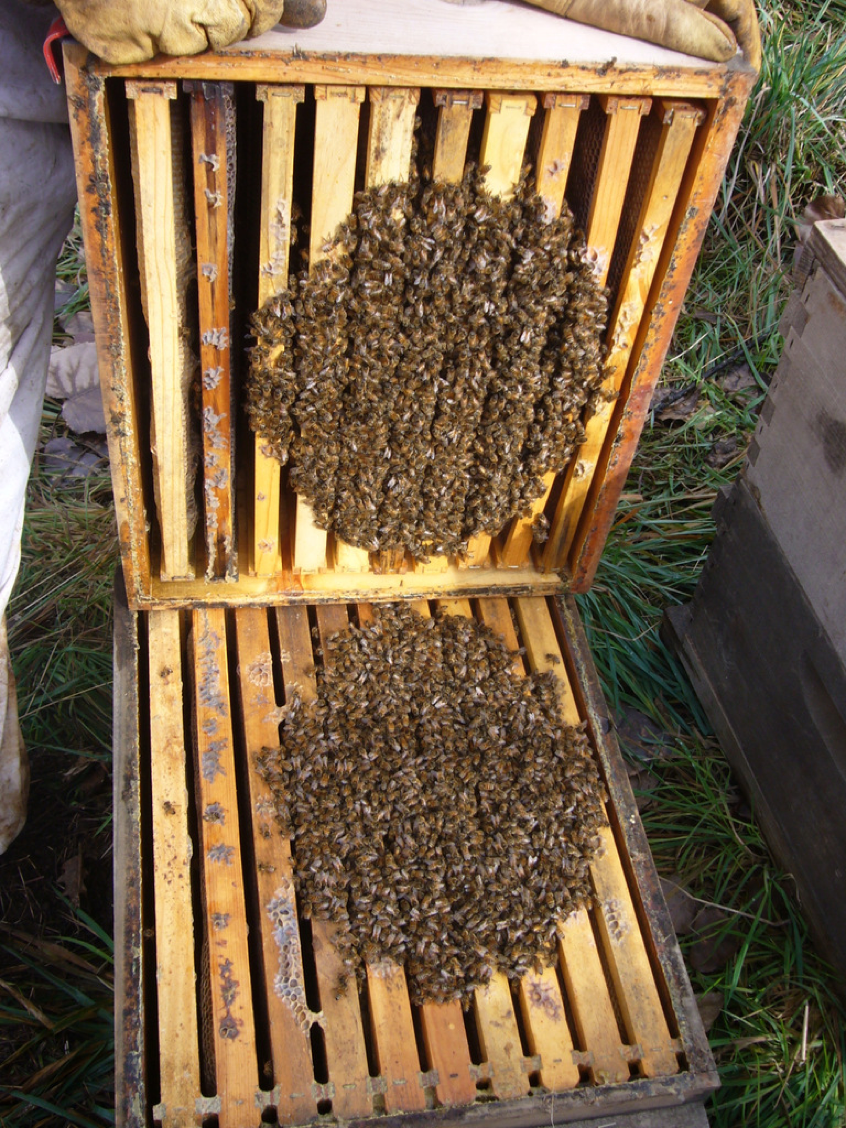
Figure 1. Colonies hunker down into a closely-thermoregulated tight cluster in order to survive the winter. During this period, these aging bees are under considerable stress from nosema and viruses. Any additional factors, such as high varroa levels, poor nutrition, or pesticide residues, can tip the balance, perhaps leading to winter loss, or an unsuccessful “spring turnover.”
For nearly a decade now, beekeepers have been plagued by an elevated rate of winter losses. Over the past few years I’ve run or participated in several field trials in which I’ve kept close track of colonies over the course of the winter, and depending upon the experiment, collecting data on colony strength and survival, weight loss, parasite levels, etc. My analysis of this valuable data has given me some insights into the factors that contribute to overwintering losses, at least in the Sierra foothills. I was planning to write about what I’ve learned later in my Sick Bees series, but I realized by the time I was going to get to it, that it would be too late to be of use to beekeepers this coming winter.
A Pesticide-Free Control Group
Since my hive are kept far from conventional agricultural pesticides during the summer, and since I don’t use synthetic miticides, they serve as a sort of control group in which pesticides would not be a contributing factor to winter losses. So their performance might be of value as a baseline for comparison to colonies that do receive greater pesticide exposure. However, the first data set that I’m going to discuss was gathered by several cooperating beekeepers, most of whom do use synthetic miticides, and whose hives are exposed to agricultural pesticides.
2011/2012 Beeologics Trial
Over the winter of 2011/2012, I participated in a large-scale field study for Beeologics involving a number of commercial beekeepers. The company generously shared the entire data set for the untreated “control” hives with me (beekeeper names redacted), of which I could use that for nearly 500 hives (100 of my own, 399 from ten others). All colonies had been managed to go to almonds in the spring, receiving each beekeeper’s normal feeding and mite treatments.
Each hive was graded for colony strength (standard count of frames covered with bees) at three time points (Figs. 2 and 3).
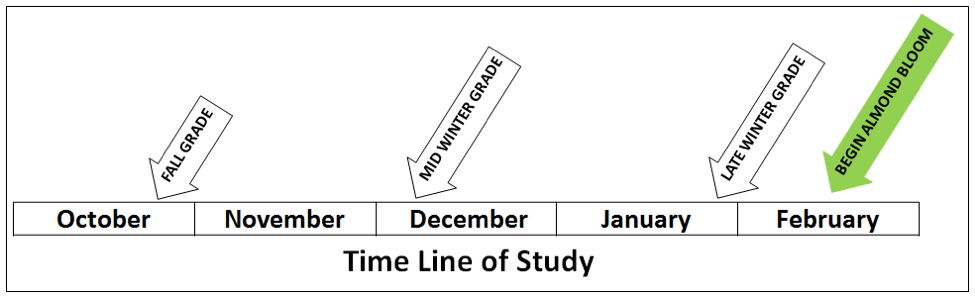
Figure 2. The three time points for grading during the study. Each colony was graded by the beekeeper in fall, at midwinter, and shortly prior to moving to the almond orchards.
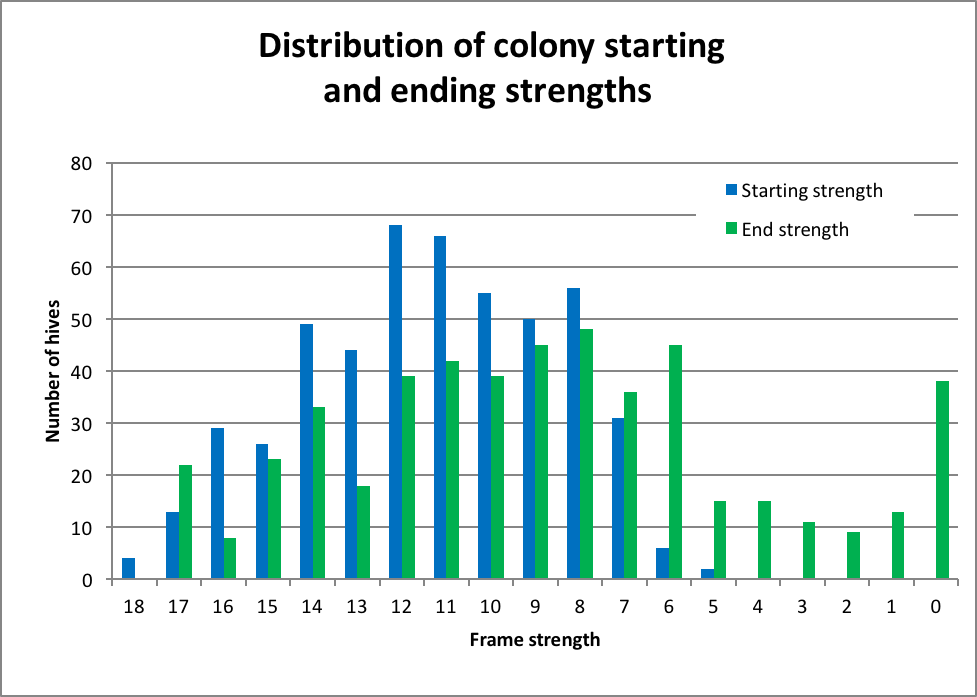
Figure 3. Distribution of colony strengths of the 499 hives at the initial grading in fall (blue bars) and again in late January (green). Most of the hives went into winter in good shape strength wise. The average starting strength was 11.3 frames covered with bees; the average end strength was 8.8 frames; 80% of the hives made 6 frames at that time (and would be expected to grow further by bloom). There were 38 complete deadouts (8%) by the end of January.
In my first analysis of the data, nothing much jumped out at me. Then, months later it occurred to me to reanalyze it, this time sorting the hives into groups based upon their starting strength grade at the end of October (Fig. 4). Suddenly, interesting patterns began to emerge!
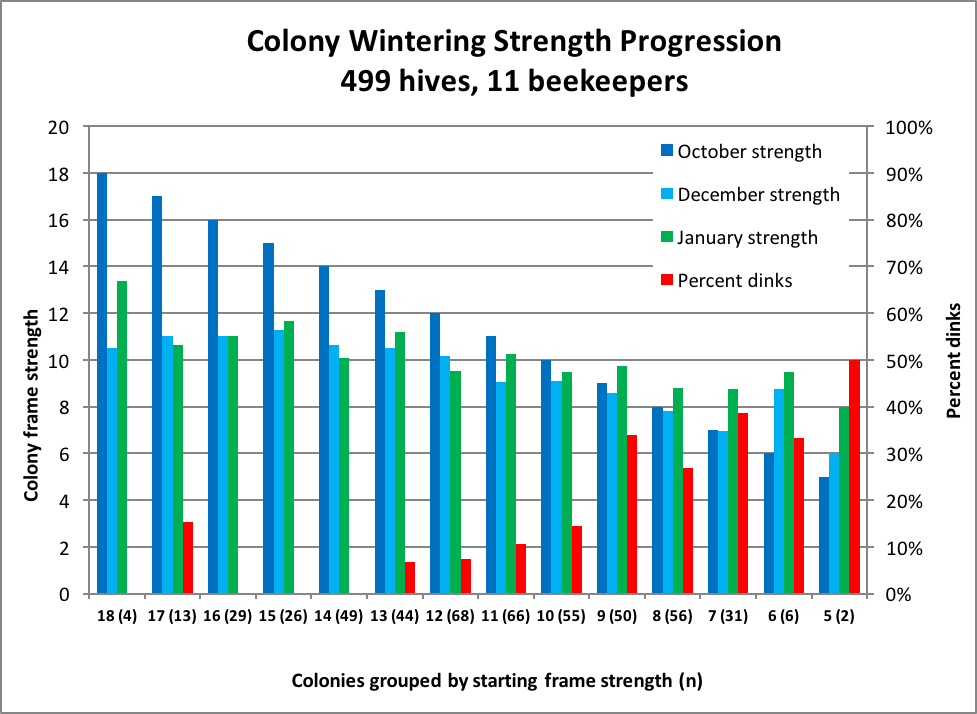
Figure 4. A tracking of the “frame strength” of 499 hives managed by 11 commercial beekeepers in various states. I classified colonies grading at less than 4 frames of bees in late January as “dinks” (red bars), and excluded their midwinter and final strengths from the means (light blue and green). The data is organized by the fall starting strength grade (e.g., there were four 18-framers at far left group; at far right there were only two that started as 5-framers, one of which became a dink). Data was missing for two beekeepers’ December gradings (100 hives).
There is a lot of information in the above figure. It much easier to explain if I could point and gesticulate, but obviously can’t do so here. So I beg you to take the time to study it carefully while I try to guide you through it with text alone:
The dark blue bars
These reflect the starting strengths with which to compare the other bars. Since the data is organized by starting strength, these bars step down evenly from 18-frame to 5-frame.
The light blue bars
The change in height from the dark blue bars to the light blue midwinter strengths tells us how much the colonies shrunk (or grew) from fall through midwinter. Note that the larger the colony, the more strength it loses during this period of time. On the other hand, small colonies (if they survive) tend to grow (the beekeepers were free to feed their hives as they saw fit, but I have no data on what they actually did).
The green bars
The change in height from light blue midwinter to the green end of January bars tells us how much the colonies grew during that time. Surprisingly, the stronger colonies grew hardly at all, whereas the weaker colonies demonstrated their capacity to grow substantially (should they not crash)!
The red bars
The red bars indicate the percentage (on the right vertical axis) of each starting strength group that didn’t make grade (less than four frames covered with bees) at the end of January. Note the nearly linear relationship between fall strength and percent failure, despite a weak colony’s demonstrated potential to recover.
For the full uncensored dataset of 550 hives, only 15% graded at less than 4 frames at the endpoint. Compare this to the 22% winter losses recorded by the BIP for beekeepers nationwide [1]. Keep in mind, though, that these figures can’t be directly compared, since Beeologics had asked us to start only with hives that graded at least 7 frames, and additional losses would have likely occurred in the early spring after the late January grading. But for the 12 commercial almond pollinators in the full data set, winter losses in the untreated control colonies were not excessive.
An additional item of interest is that of those colonies that crashed over the winter, some went down quickly—from midwinter grades of up to 12 frames to zero in January! I would assume that some of these went queenless, and that some suffered from sudden colony collapse due to viruses and/or nosema.
Discussion
I get the feeling that this data set provides us with a potential learning experience, so let’s mull it over. I suspect that the substantial loss in strength for the strongest colonies was due to the fall population turnover, during which a large proportion of the remaining “summer” foragers abandon the hive, leaving a population consisting mainly of long-lived “winter bees” [2]. The data from these hives suggests that strong colonies in tend to drop to a 9- to 10-frame midwinter cluster, and then build back up by about a frame by the end of January (in California).
The data also suggest that weak colonies strive to build up to a goal of 9 or 10 frames over winter. I find these observations to be of considerable interest. What’s with the 10-frame magic number? Do bees have some sort of ideal target cluster size?
Corroborative data come from a German study by Dr. Elke Genersch [3], who tracked the health of nearly four thousand hives over the course of four years. She also found that winter survival correlated with fall colony strength– colonies that survived the winter averaged 12 frames in October; those that died over winter had averaged only 10 frames. Here we see that 10-frame tip point again—are the bees trying to tell us something?
Practical application #1: this data set suggests that building up huge colonies in late summer may not be worth the expense, since they will likely soon drop to about 10 frames anyway.
Practical application #2: this data suggests that it may be most cost effective to give your weaker colonies extra attention.
Practical application #3: these data lend support to the axiom, “Take your winter losses in fall.”
What Makes Dinks Dinks?
We can see that the weaker the colony in fall, the greater the odds that it will go downhill over winter. But is lack of a robust cluster size the cause of poor wintering? As I pointed out above, weak colonies certainly have the potential not only to winter well, but to actually grow. So it’s hard to make the case that so many failed simply because they weren’t strong enough to start with.
Rather, what I suspect is that the reason that they were small in fall was because they already had something wrong with them! Obviously, there must have been some reason why they didn’t go into winter as 16-framers! The most obvious suspects would be poor nutrition, parasites (varroa, nosema, or viruses), poor queens, or pesticide residues. I’m guessing that many of the weaker colonies in fall were on their way downhill, and winter only exacerbated their decline. So let’s look at the above suspects (which I’ve listed in what I suspect is the most likely order of culpability):
- Poor nutrition: all other factors pale in comparison to nutrition. A strong, healthy colony requires adequate beebread and honey to get to that strength, for overwinter survival, and for early buildup. Any California almond pollinator can testify to the fact that one can build colonies in late summer to any size with enough supplemental nutrition. The flip side is that poor nutrition leads to dinks.
- Varroa: most beekeepers and researchers attribute our higher winter losses these days either directly or indirectly to the varroa/virus complex. High varroa levels in fall = high winter losses.
- Nosema: nosema infection starts to climb with the advent of cool weather and normally peaks midwinter. In my own operation, I find that my strongest hives have very few bees infected by nosema, whereas dinks often (but not at all always) have serious nosema infections.
- Viruses: the two groups of viruses that appear to me to be of most concern are the “cloud” of DWV variants [4], and the “paralytic viruses” (KBV, ABPV, IAPV). I will discuss the overwinter impact of these viruses (as well as nosema) in an upcoming article.
- Poor queens: a percentage of colonies simply go queenless over winter—more these days than in yesteryear. Failing colonies in early spring often are attempting to supersede their queen. There is also the “colony morale” issue dependent upon the queen producing sufficient pheromones. However, I’ve seen far too many dinks spontaneously recover to always blame the queen.
- 6. Pesticide residues: prior to varroa, beekeepers found that exposure to certain insecticides would lead to higher winter losses. For colonies coming off of intensive agriculture, pesticides are of course an obvious suspect, although I’ve yet to see evidence that we should point the finger at the neonicotinoids. I suspect that the chemical cocktail (including miticide residues) in many of today’s combs contributes to winter losses.
The Midwinter Assessment (Size Matters)
At our midwinter check of my own operation, my son Eric asked me just how small a cluster I would be comfortable with to include in our hive count for almonds. Our best colonies go to frame-strength contracts in which we get top dollar for 11-frame colonies. However, we’ve also got contracts for which we guarantee only 4- or 6-frame minimums. So, based upon midwinter assessment, what failure factor should we use to estimate what percentage of our weak hives could be contracted for a 4-frame or better contract? In order to answer Eric’s question, I plotted the data for the weaker hives ranked by their midwinter grading (Fig. 5).
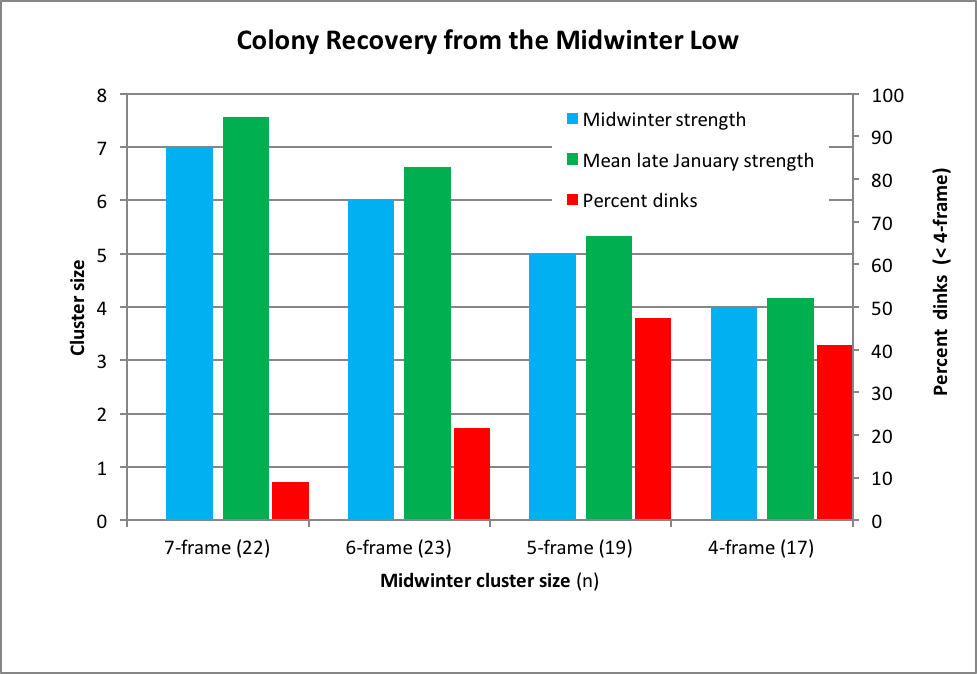
Figure 5. In this chart I show final colony strength relative to the midwinter strength, for the 81 hives that graded from 4 through 7 frame strength at the midwinter time point. The red bars (plotted relative to the right-hand axis) show the percentage that didn’t make at least 4 frames of bees at the end of January.
Most of the 7-framers at midwinter made 6 frames by late January. They would have graded substantially stronger by 10% bloom in late February. But these data suggest that we should expect 20% losses in our midwinter 6-framers, and 40-50% losses in the 5- and 4-framers.
Practical application: based upon this data set, I’d tell my son to include only half the colonies with a 4- or 5-frame cluster in early December in the count.
Another Trial
This last winter we ran additional field trials. One started in late November. We took our weakest hives (likely those that had some sort of “issue”) and equalized them to between 6 and 7 frames of bees. We had to boost quite a few to even make this strength for the initial grading on December 19, at which time they averaged 6 ¼ frames covered with bees. I fully expected poor colony overwinter survival, especially since we got hit with unusually cold weather soon afterward.
But in this trial we did something that we don’t normally do—the protocol called for us to feed the colonies 1:1 sucrose syrup throughout the winter. We fed via top jar feeders directly over the cluster (Fig. 6).
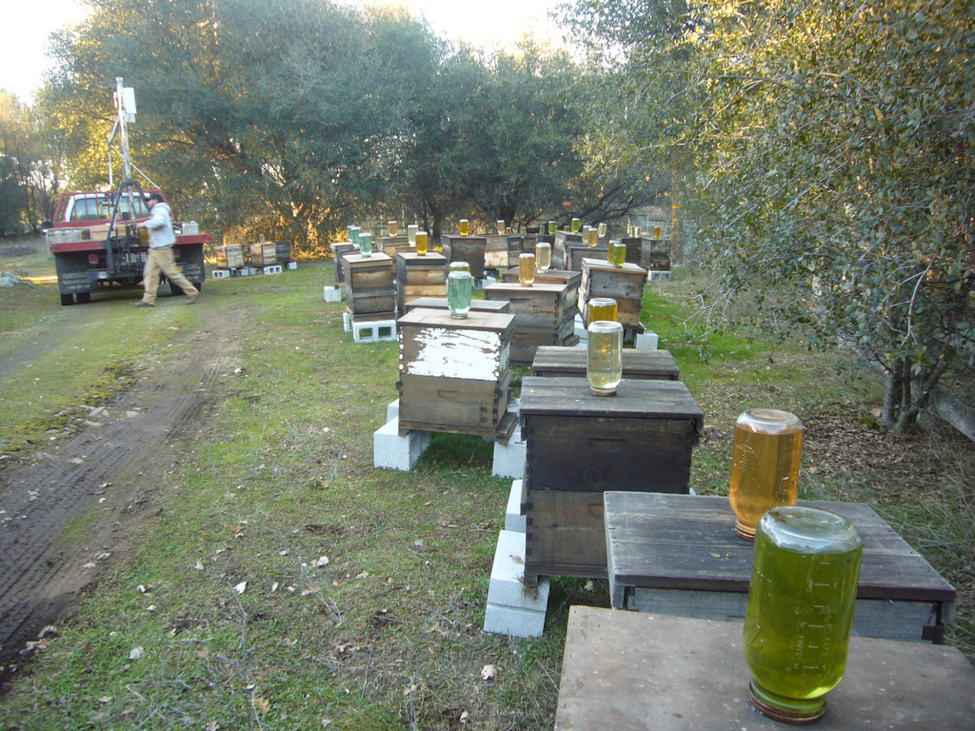
Figure 6. We gave these weak colonies 4 half-gallon feedings of color-coded syrup between December 24 and February 6, plus a pound of pollen supplement on January 30. We set up the hives as weak singles in the upper box, with drawn comb below. Despite the fact that the syrup was directly in contact with the clusters, it often took the bees a week to empty the jars due to the cold weather.
I feared that feeding weak colonies this much 1:1 syrup during cold weather when they were tightly clustered might harm them. I could not have been more wrong! We took 130 of the 150 to almonds, easily making 6-frame average. By the March 25 grading upon return, they averaged 10 frames, and 142 of the 150 (95%) were still alive, despite the fact that a number of clusters had shrunk to as low as two frames of bees at the end of January (Fig. 7)!
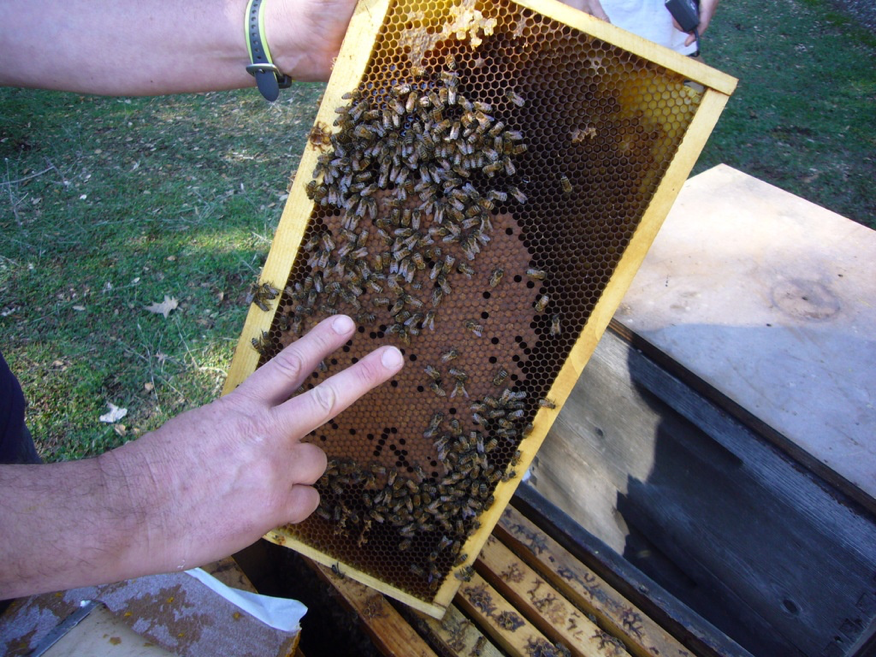
Figure 7. This colony filled only two bee spaces on January 30, but it was ready to rock and roll! A number of these two and three-framers built up to 18-20 framers by April 15!
And this brings us to the concept of the winter turnaround…
The Winter Turnaround
The honey bee colony in temperate climates typically reaches its low point in early December. Brood rearing has been curtailed or completely shut down, meaning that there has been no recruitment of new bees to take the place of those dying. The colony is reborn in each year during its “spring turnover,” in which the “elderly” winter bees must replace themselves with a new generation of workers in late winter/early spring. This is the most perilous time of the year for a colony, as lack of honey stores, pollen income, or pathogen infection can sabotage the process. And this turnover occurs shortly before or during (if colonies come out of cold storage) the almond bloom (Fig. 8).
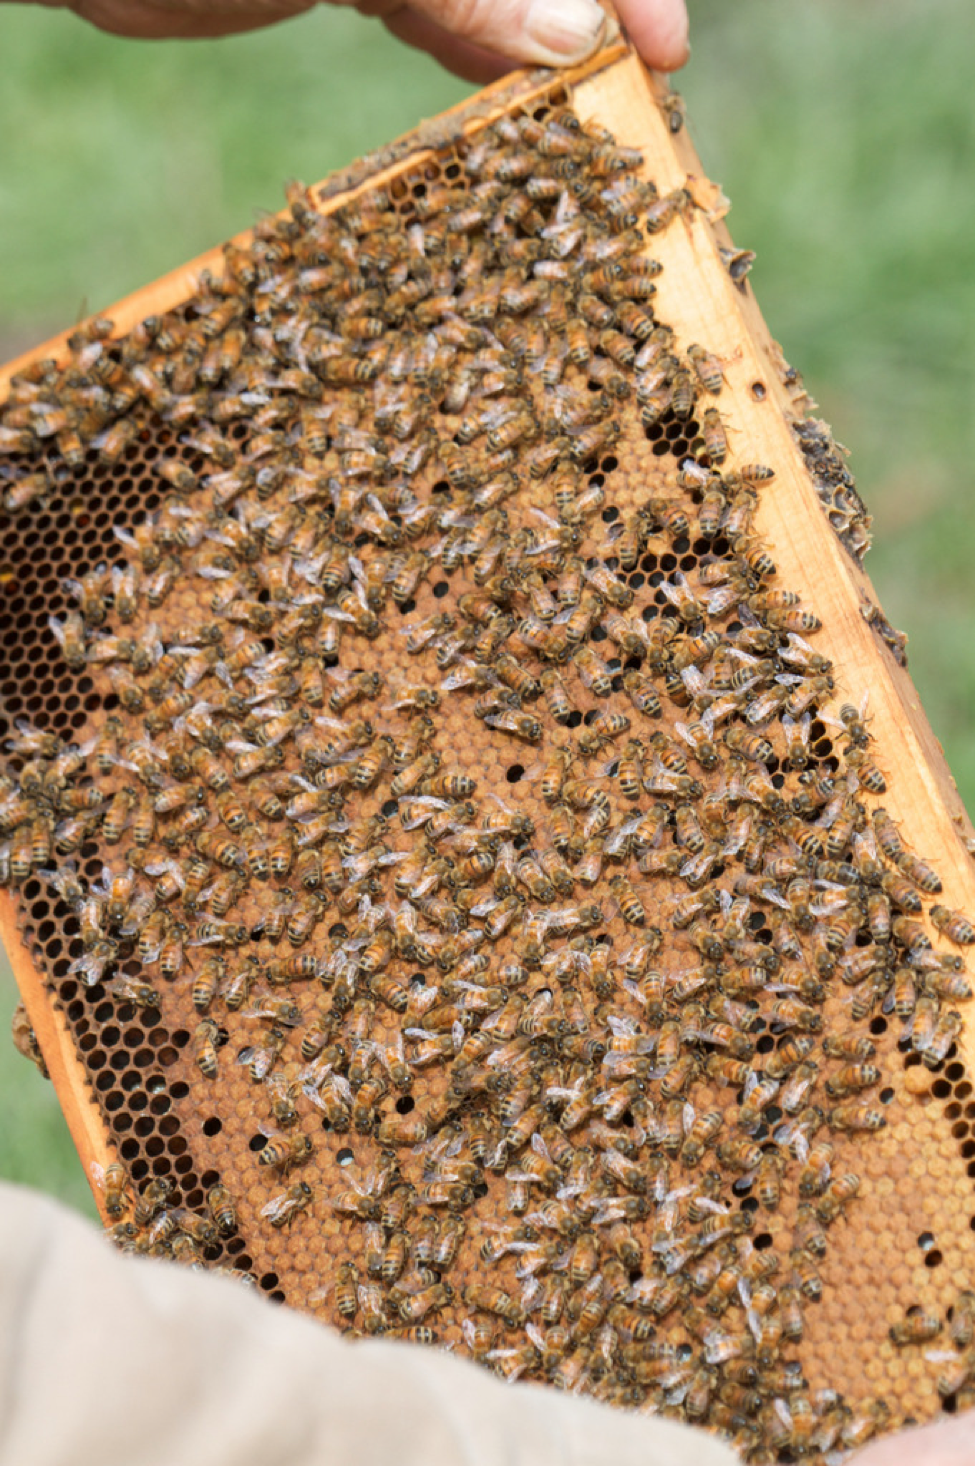
Figure 8. A brood comb from a recovering 3½-frame colony in late February. Such a small number of adult bees are challenged to the max to feed and incubate this much brood! But if the colony can hold on until the first round of brood emerges, then it will likely continue to grow rapidly.
Practical application: weak colonies have the potential to recover and build up even during a cold California winter. I was dumbfounded by the high survival rate of those 150 “write off” colonies with which I stocked the above trial. It appears that weak colonies in the Sierra Foothills can not only handle a fair quantity of 1:1 sugar syrup in cold weather, but indeed thrive on the stimulation.
So What To Do With Dinks?
What to do with the dinks—this is an age-old question. The common adage is that combining two dinks does not create a viable hive (Fig. 9). On the other hand, I’ve seen many a dink spontaneously fully recover in early spring.
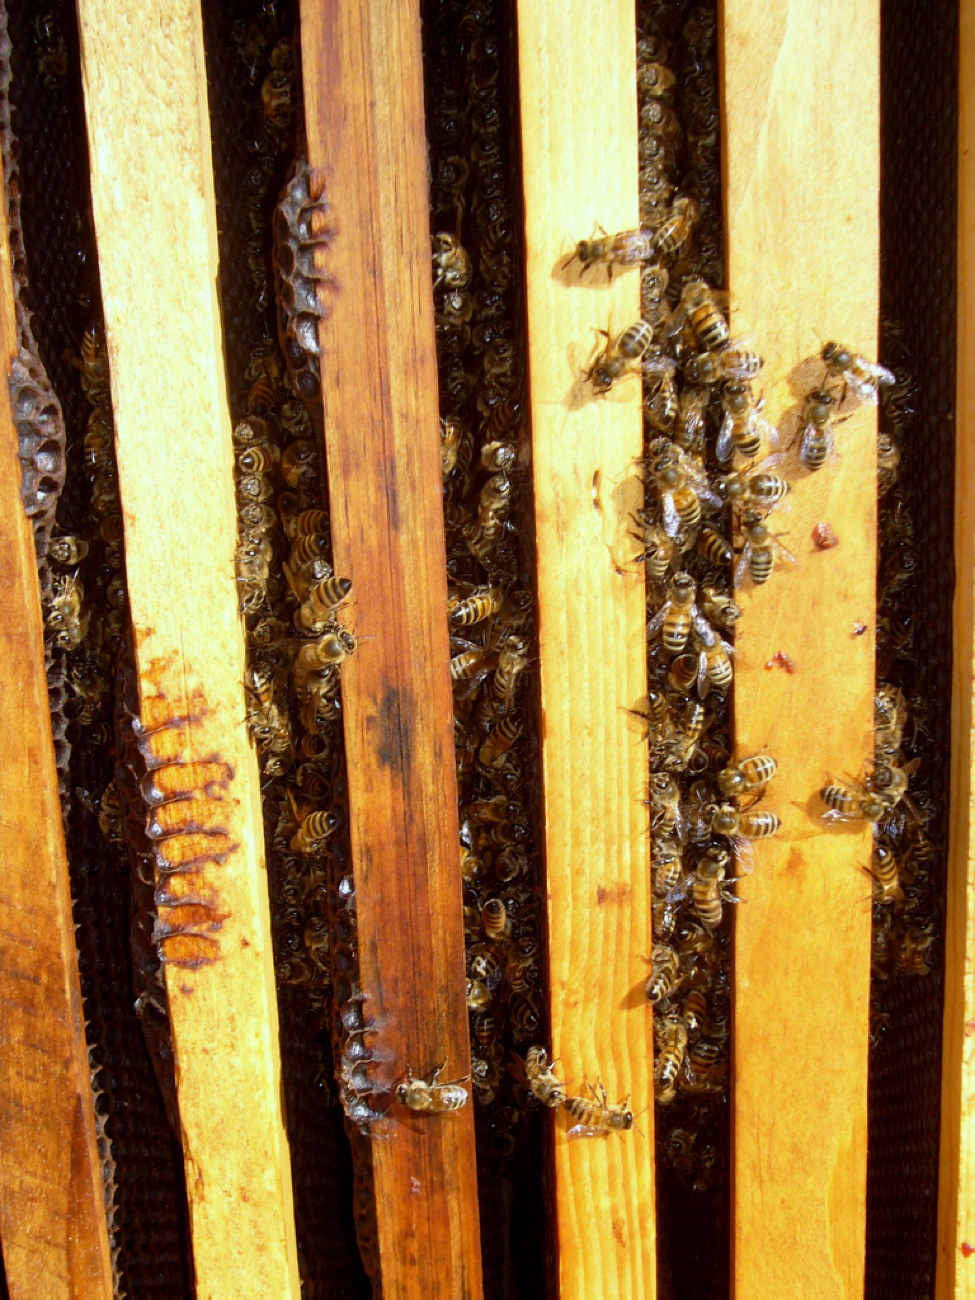
Figure 9. Bottom view of a ~3-frame dink just warm enough for the cluster to begin to break.
There is always the question of why is that dink a dink in the first place? Time and again I’ve left dinks behind when I move yards to almonds, to return to them a month later and find them booming. I no longer blame the queen—I’ve seen far too many dinks turn around and allow that queen to again hit her stride. So I strongly suspect that any dink is likely fighting an infection of some sort.
It’s probably not wise to combine dinks with stronger hives, since if the dink is fighting something, why take the chance of transmitting it to the healthy hive?
Practical application: There’s no way that I’m going to give advice, but I can tell you what I do. I sell bees in April. Therefore I want the most bees in April, and reach that goal by giving my attention to my strong colonies. As for the dinks, I generally combine dinks with dinks midwinter to give them a larger cluster size, in order to help them better thermoregulate and clear whatever infection they are dealing with. If not, I haven’t spread infection to my better hives.
And this brings us to the subject of my last observation—the spreading of infection within a yard of bees.
Spread of Infection From Hive to Hive
We’ve now run quite a few controlled field trials over the past few years (we test products for manufacturers and for ourselves). One observation that really strikes us is that infection appears to move from hive to hive one small step at a time. I don’t have any firm evidence, but it appears that infected bees drift from sick hives into the hive next door, spreading the infection. We see this time and again.
If one hive starts to go down, the one on either side of it will often go next, and then maybe the one behind it. At the end of each trial, the deadouts are invariably clumped—in a yard of 48 hives, there will be a group or two of 3-6 hives right next to each other that will all die, but the rest of the yard will remain healthy. We can watch the infection slowly spread. This is not by robbing, since we don’t allow a hive to get that weak before we remove it, and robbing would likely affect the entire yard.
Of note is that this phenomenon was observed by a number of beekeepers who suffered from CCD in the years 2004-2008. One colony would go down, and then the disease would slowly spread like a steamroller across the yard over a period of weeks. That observation lends considerable support to the hypothesis that CCD was due to one or more transmissible pathogens.
Practical application: it’s common sense that if you’ve got a sick hive, it’s wise to move it away from your healthy ones. This seems completely obvious when you say it, but how many beekeepers actually do it?
Coming
Running field trials is difficult, exacting, and tedious work. But I then get access to great data sets on someone else’s dime. In addition, I’m now getting enough donations to my website that I can afford to run trials to answer practical questions in beekeeping management. I’ve already completed two so far this spring, one is in progress, and we are setting up a large-scale trial (160 hives) this week that will run until almonds next year. I’ve been trying not to overload this journal with my articles (and the danged Sick Bee series is taking far longer than I expected), so if you like this sort of information, let the editor know. I will be writing more about the biotic factors involved in winter colony losses in my Sick Bees series as soon as I finally get through pesticides.
References
[1] http://beeinformed.org/2012/05/winter2012/
[2] Mattila, HR, JL Harris, GW Otis (2001) Timing of production of winter bees in honey bee (Apis mellifera) colonies. Insectes soc. 48: 88–93.
[3] Genersch, E, et al (2010) The German bee monitoring project: a long term study to understand periodically high winter losses of honey bee colonies. Apidologie 41(3): 332 – 352. http://www.apidologie.org/articles/apido/pdf/2010/03/m09161.pdf
[4] Martin, SJ, et al (2012) Global Honey Bee Viral Landscape Altered by a Parasitic Mite. Science 336: 1304-1306. (Broken Link!) http://sciences.blogs.liberation.fr/files/abeille-varroa-virus.pdf


