
Creating a Model for Oxalic Acid Vaporization: Part 2

June 17, 2026
Contents
THE QUESTION OF OA DOSAGE and EFFICACY. 4
MY APPRECIATION TO OUR “CITIZEN SCIENTIST” BEEKEEPERS! 15
Creating a Model for Oxalic Acid Vaporization
Part 2
Randy Oliver
ScientificBeekeeping.com
First published in ABJ March 2026
Oxalic acid vaporization (OAV) works great in colonies without brood, but at other times of the year it takes a series of sequential applications to reduce the mite population. The questions then are, what is the optimal interval between vaporizations, and how many applications will it take? Could I create a computer model to answer those questions?
It took me hundreds of hours to create Randy’s Varroa Model [[1]], but since it is based upon 15-day intervals, it isn’t appropriate for predicting the effect of OAVs applied at shorter intervals (nor for extended-release OA). So I needed to create a model based upon daily intervals, and instead of inputting overall efficacy of a treatment (which is appropriate for synthetic miticides, formic acid, thymol, etc.), it would need to calculate the daily kill of only the “phoretic” mites (not that of the overall mite population) [[2]]. So let’s walk through the steps necessary to develop a model.
DEVELOPING A MODEL
Rather than creating a theoretical model based upon assumptions, I “reverse engineered” a model to match actual field data — some collected by me, but most from a number of citizen scientist beekeepers who generously shared hundreds of mite-drop counts that they had tediously collected from stickyboards (thank you to all!).
THE NECESSARY PARAMETERS
The first thing to figure out are the parameters used by the model to calculate the simulations:
Time period: I arbitrarily set the model to cover 60 days, since that would cover a typical period of OAV applications.
Colony starting condition: I start the simulations assuming populations of 36,000 adult bees (a full 10-frame double-deep) and five combs 65% covered with brood. The model must run for 12 days before the first treatment, in order to later account for the number of mites exiting the brood each day.
Varroa reproduction dynamics: I allow for “normal” varroa reproductive success, and validate the model by showing its calculated daily “intrinsic rate of reproduction” (r-value) before application of treatments.
Varroa phoretic period: This is perhaps the most critical parameter, since OAV appears to only affect mites that are on the adult bees. It can be calculated theoretically from Willem Boot’s finding [[3]] that the phoretic period is a matter of chance, based upon the availability of 8-day-old larvae for mites to invade, relative to the infestation rate of the adult bees. I validated this figure by comparing the calculations to field data from Drs. Katie Lee, Jeff Harris, and others (who determined the percentages of phoretic vs. brood mites in hives, from which one can then calculate the average duration of phoresy at the time of sampling).
Varroa “turnover”: This is a critical part of the model, which needs to account for how many mites are entering the brood each day — a number that drops dramatically following an OAV. And then how many mites are emerging from the brood each day — which reflects how many entered 12 days earlier. (It’s not yet clear whether mites that are able to enter a brood cell after being exposed to OA then die in the cell, or are otherwise able to reproduce.)
Immediate and delayed mortality: After an OAV, the mite-drop counts onto a sticky board remain elevated for several days. This was a tricky factor to include in the calculations, since although oxalic acid has a very short half-life once it’s on the bees, we don’t yet understand the reason(s) for this delayed mortality. Is it due to the acid’s residual toxicity or behavioral effects? And might a treated mite enter a brood cell and die afterward? So I analyzed the post-vaporization data from beekeepers who had recorded sticky-board counts on a daily basis, to calculate the progression of total 5-day mortality (Figure 1).
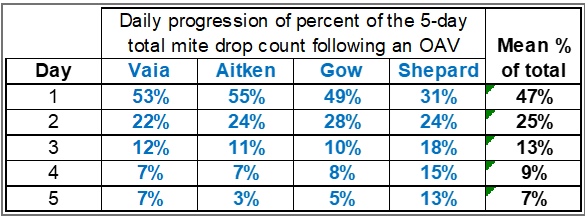
Fig. 1 Not all mites drop immediately after vaporization, but the progression of daily mite-drop counts following an OAV were fairly consistent from dataset to dataset. So for the model, I used the average values to spread the kill over five days.
Practical application: It’s not clear whether the sustained mite drop over the days following a vaporization is due to delayed exposure to the rapidly-degrading OA residues, or delayed mortality (from footpad injury, desiccation, or something else).
In any case, by two days, the acid has degraded to such a low residue level that it presumably would have a steeply diminishing effect upon any mites emerging from the brood (whose numbers would not be enough to account for the elevated sticky-board counts anyway).
INPUTS BY THE USER
To keep things simple, I’ve minimized the user inputs to only four (but I invite any user to adjust the model, and let me know how to improve it!):
- Colony population dynamics: I give the user a choice of either of two scenarios: Type in “S” for summertime simulations with continual brood rearing, or “F” for a late-summer to fall simulation during which the colony slows down brood rearing, then ceases brood initiation, then goes completely broodless 21 days later.
- Starting varroa population: The user inputs the estimated starting mite population, which they can back-calculate (using the model) from their own field mite-wash or sticky-board count. The starting count is arbitrary, and is only necessary if you want to determine the ending mite population.
- Treatment intervals: The user can leave this input blank to see the projected mite growth without treatment, or input 4, 7, 10, 14, or “C” (custom) for the number of days between OAV applications.
- Expected efficacy: The user inputs a value for the percent kill of the phoretic mites (you can determine this for your vaporizer and conditions by taking mite-wash counts before, and a few days after an OAV). For small colonies during a broodless period, 95% is a reasonable value (one gets diminishing returns above 85%), whereas for larger colonies, or for applications in cold weather, use a lower value.
Efficacy depends upon a number of factors, notably the “dose” of OA, and how strongly the vapor plume blows into the hive. Other factors include the weather (poorer efficacy when cold), colony strength, vaporizer type, and setpoint temperature. The inputted efficacy makes a difference (Figure 2).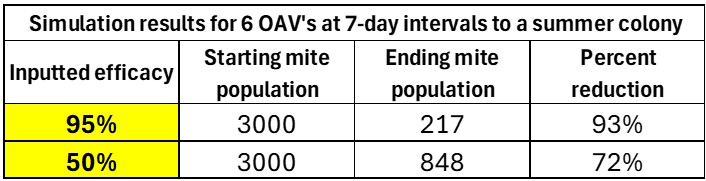
Fig. 2 I ran two simulations to compare the simulation results for 95% vs. 50% efficacy. Not shown is that it took nine applications at 50% efficacy to attain the same mite reduction as six applications at 95% efficacy.
THE QUESTION OF OA DOSAGE & EFFICACY
I discussed the “dose” of oxalic acid to apply to a hive in Part 1 of this series. Although I have little personal data on mite reduction from OAV, the first time I tried it on two high-mite hives in 2018, I applied only 2 grams per double deep, and obtained very high efficacy (Figure 3).

Fig. 3 The best way to determine how well your OAVs are working would be to take mite-wash counts before the first treatment, and then several days after application (to allow mites to emerge from the brood).
Practical application: To replicate the degree of mite reduction in the chart above, I needed to input 100% efficacy per vaporization. My point is, that even with high efficacy, if your starting mite infestation rate is high, it’s gonna take a number of OAVs to bring it down to a low level!
On the other hand, Cameron Jack [[4]], after applying three OAVs at 7-day intervals in October to singles containing brood, got relatively poor efficacy from 1-gram doses to single-deep hives, but good efficacy from 4-gram doses.
Practical application: We need a lot more data on titration of the acid residues on the bees following OAVs, as well as more mite-wash counts following an OAV to get a better handle on the optimal dose.
OUTPUTS
The model creates a graphical chart that shows the following:
A breakdown of the mite population: the projected total mite population of the colony, the number of mites in the brood, and the number of phoretic mites on the adult bees.
Mite monitoring counts: the projected mite-wash count, daily mite-drop count, and the expected 48-hour post-OAV mite-drop count.
The model also shows all the daily calculations for mites going into or coming out of the brood (Figure 4), as well as many other things.

Fig. 4 The headers for some of the 60 daily calculations instantly made for each simulation
VALIDATING THE MODEL
To be of value, the projections of a model should match data from the field. Luckily, Cameron Jack’s aforementioned study also included mite-wash counts. When I ran a simulation of his experiment, the results closely matched his field findings.
But most of the datasets that I’ve been able to review recorded only sticky-board counts, which often don’t reconcile with simulations by the model (Figure 5).

Fig. 5 Kevin had only applied 2 grams per hive — perhaps an inadequate dosage. But when I use my model to try to replicate his results, even if I input only 50% efficacy, it still projects a decrease in mite-drop counts over time, rather than an increase.
And Kevin’s wasn’t the only dataset in which the mite-drop count increased for the first few vaporizations [[5]](Figure 6) — something that never occurs in my simulations.

Fig. 6 Note that Theo’s mite-drop counts increased before decreasing — something that I’ve also seen in other datasets. The spikes in early October are possibly the result of a week without treatment, as the colony was shutting down brood rearing, so that more mites were out on the bees.
Could it be that there is a residual effect, with the oxalic building up in the hive? That’s not what we see in our titrations. And a surprising observation by Al Toufalia [[6]], following vaporizations of broodless colonies two weeks or one week apart, was that:
In Year 1 varroa mortality from the second OA treatment was lower than in the first, 87.2 vs. 96.8%. This difference is significant (p < 0.001). We also saw the same pattern in Year 2, indicating that this is a general difference. We do not know why the second application was less effective than the first.
The above observations do not support the hypothesis that oxalic residues build up to affect the subsequent cohort of phoretic mites.
Practical application: The model calculates how many mites would be emerging from the brood each day. Not enough mites emerge between vaporizations four days apart to replenish the phoretic population, even when I input a very low efficacy, so that cannot explain the stepwise increase in Theo’s mite-drop counts. This discrepancy remains a frustrating mystery to me, so I’m not going to claim that the model will exactly predict each outcome in the field.
USING THE MODEL
It’s hard to show how to use the model in a magazine, so I hope to record a video by the time you read this. Anyway, I snipped some of the output charts from a variety of simulations to show how it can be used (Figures 7-12).

Fig. 7 This chart shows the baseline expected mite buildup in a summertime colony full of brood, over the period of 60 days (circled in red). The inputted starting mite count of 3000 results in a calculated starting mite-wash count of 13 (blue square), and a natural daily mite drop of ~70 (the first row of black figures) — indicating that it’s already past time to take action! I fixed the y-axis to max at 5000 mites, since although higher counts go off the scale, it better shows the results after inputting treatments.
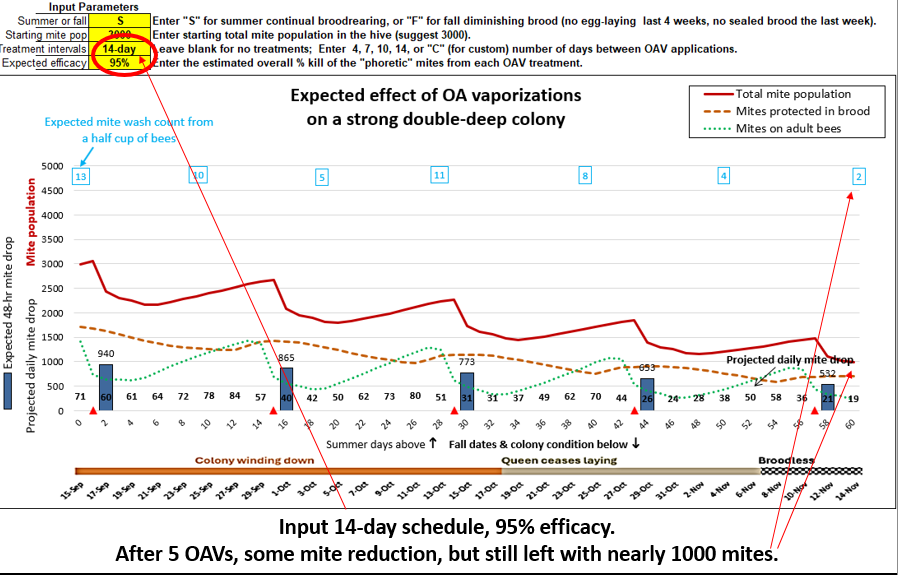
Fig. 8 I then inputted an OAV application interval of 14 days, and a 95% kill rate of the phoretic mites from each treatment. Five treatments took the colony down to ~1000 mites remaining in the hive (and a mite-wash count of 2).
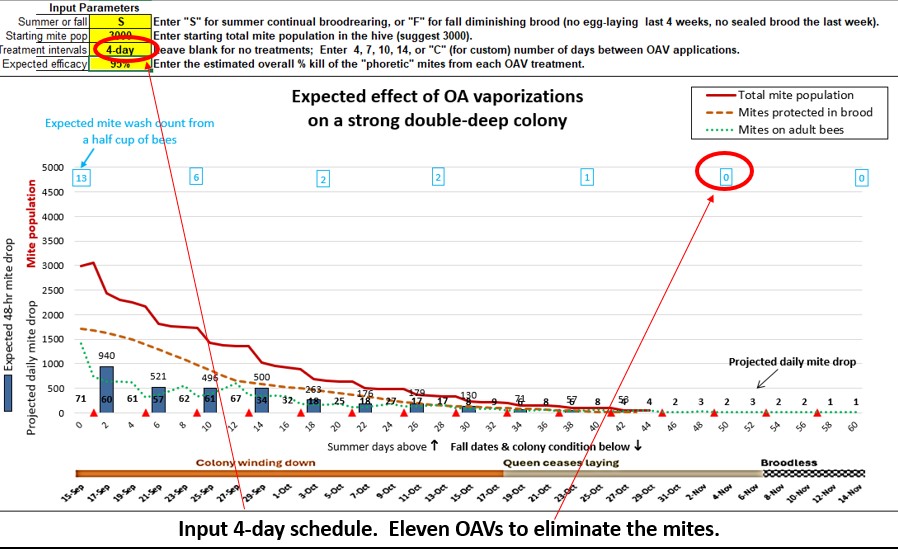
Fig. 9 So I narrowed the application interval to four days. It still took eleven applications to fully eliminate the mites. (Don’t expect a miracle from a few OAV applications!)

Fig. 10 Now let’s switch to the Fall (F) setting (dates and colony condition circled in red), with the same starting mite population of 3000 (which grows to ~6000 (off the chart), and levels off.

Fig. 11 Let’s try applying OAVs at 10-day intervals to that colony in the fall. The mite-wash count zeroes out after six vaporizations (as the colony goes broodless).

Fig. 12 But maybe you want to get the mite pop down earlier, in order to address virus transmission to the cohort of brood that will eventually form the winter cluster. So you input “C” (for Custom) and manually check boxes for the dates to hit the colony with four vaporizations at 3-day intervals in September, followed by two more once they go broodless. Bingo — you did it!
Hey, this is like playing a video game! Do I need to worry about you getting addicted?
Practical application: I’m of course curious as to whether this model could be used to predict the effect of an extended-release OA pad treatment. It does, if you input a 15-20% kill of the phoretic mites each day (as opposed to their roughly 2% natural mortality).
REMAINING QUESTIONS
This is a model in progress! I don’t know why it doesn’t replicate some of the mite-drop datasets that I’ve received, and whether there are additional variables or inputs that I need to account for. Here are some of my yet-unanswered questions:
- Are there long-term effects (perhaps sterility) in treated phoretic mites that do not suffer death?
- What’s the indirect effect upon mite reproduction from the kill of larvae from a vaporization (and the resulting reduced cohort of prepupae several days afterwards)?
- Are ambient temperature and humidity important factors? Is there less “penetration” of OA into the cluster when there is cold air inside the hive? Does humidity affect the rapidity of degradation (the half-life) of oxalic acid?
- Why is there sometimes a smaller mite drop after the first application, compared to the next?
- My own (yet unpublished) data indicate that oxalic acid reacts with bee cuticle to produce an odorant that is repellent to mites, and that when an extended-release pad is applied to a hive, the proportion of mites that are phoretic increases — suggesting that oxalic acid may reduce their ability to reinfest a brood cell, perhaps making them more susceptible to a second vaporization.
Practical application: The rate of mite drop following an OAV could be due to a combination of the acid dosage that actually reaches the bees, the distribution of the fumes and fog due to temperature, and by multiple modes of action, which may affect the mites independently, or synergize.
The initial acute contact toxicity would cause immediate mite drop, followed by chronic or slow-acting toxicity. Additional mortality could occur as mites move from their feeding sites (or emerge from a cell) and their feet come in contact with acid (which may also make the mites unable to hold onto a bee). And as the bees clean the OA off their bodies and ingest some of it (they do), they may expose the mites feeding on them to the acid in their hemolymph, leading to subsequent mortality.
There’s also the question of whether contact with OA could burn the receptors on the mites’ sensory papillae, which could affect their ability to navigate within the hive, or locate a feeding site on host bees, thus leading to desiccation (similar to the effect of amitraz, which may take several days to cause a mite to die from thirst); a mite can only survive for about a day without feeding [[7]]. And there may be some olfactory avoidance which could affect their movement, feeding, or ability to locate a brood cell to enter.
We’ve still got a lot to learn about OAV! But even this first version of the model can help us to plan how best to use this method of applying oxalic acid. That said …
ROTATE TREATMENTS!
Time and again I hear beekeepers ask me whether they can just use oxalic acid year-round as their sole treatment for varroa control. The answer is NO! Although to date we haven’t yet seen evidence of varroa evolving resistance to oxalic acid, I wouldn’t bet against the evolutionary process of natural selection!
Some beekeepers have a hard time grasping the concept of Pest Resistance Management — the purpose of which is to prolong the useful life of each particular pesticide. If you use only a single pesticide year after year to control a pest, that strongly selects for any rare genetic mutants that exhibit resistance to that particular mode of action. The last thing you want to do is to perform a series of consecutive high-efficacy treatments of the same chemical (whether synthetic or “natural”), since you would then be applying strong selective pressure to propagate any mite bloodlines carrying a mutation that confers (even partial) resistance to that chemical’s mode of action — “high efficacy” being the key word. It would be unwise to perform more than one series of OAVs in a year — rotate in at least one (or even better, two) alternative treatment modes of action each season.
WHAT’S IN OUR TOOLBOX?
As far as the useful lives of the synthetic miticides registered since the arrival of varroa, it took our industry less than ten years to breed for mites resistant to fluvalinate, then only three years until coumaphos was no longer efficacious, but to my surprise about twenty years until beekeepers could no longer count on amitraz to be efficacious.
That said, we beekeepers are not entirely to blame — it’s up to registrants to go through the tedious and costly process of getting a pesticide approved by EPA (it’s not EPA’s job to help us), so our industry has often been stuck with too few registered products to legally use in rotation. The EPA is well aware of what they call this “wicked problem.” [[8]]
There are currently 10 different substances having different modes of action registered for use against varroa (Figure 13).

Fig. 13 Some varroa bloodlines have evolved resistance to the three synthetic miticides. That leaves four highly efficacious, well-tested biopesticides (the only ones that my sons and I have used in our commercial operation for 25 years), and two promising recently registered products.
Practical application: You don’t need to give up on amitraz or fluvalinate forever — you could likely extend their useful life by using them only once a year, in rotation with biopesticides.
WRAP-UP
Due to unexplained variations in the many datasets I’ve reviewed, and the many other variables involved, the model cannot predict absolute values for what will happen in the field. But it can be used to compare projected outcomes on a “level playing field,” since it holds all the extraneous variables constant.
I’ll post the model to ScientificBeekeeping (along with a video of how to use it) at [[9]], for you to experiment with in order to figure out your best plan for applying OAVs!
MY APPRECIATION TO OUR “CITIZEN SCIENTIST” BEEKEEPERS!
I can’t do this work alone, and we should thank the beekeepers who sent me their data sheets of mite-drop counts following OAV applications. Pulling sticky boards day after day and counting hundreds (or thousands) of mites is tedious work, and I appreciate their dedication as citizen scientists. Thank you to Jennifer Short, John Carson, Ed Lutman, Kevin Gow, Donald Aitken, Koursoumis Kostas, Vincent Paneso, Adam Ritchie, Theo Eicher, Mike Garvey, and Craig Shepard!
CITATIONS AND NOTES
[1] https://scientificbeekeeping.com/randys-varroa-model/
[2] I’ll continue to use the term “phoretic,” although the proper term would be “dispersing.”
[3] Willem J Boot, Johan N M Calis & Joop Beetsma (1993) Invasion of Varroa jacobsonsi into honey bee brood cells: a matter of chance or choice? Journal of Apicultural Research 32(3-4): 167-174.
[4] Jack, C, et al. (2020) Evaluating the efficacy of oxalic acid vaporization and brood interruption in controlling the honey bee pest Varroa destructor (Acari: Varroidae). Journal of Economic Entomology 113(2): 582–588.
[5] See Figure 4 in Part 1 of this article.
[6] Al Toufailia, H, et al. (2018) Towards integrated control of varroa: 4) varroa mortality from treating broodless winter colonies twice with oxalic acid via sublimation. Journal of Apicultural Research 57(3): 438-443.
[7] De Guzman, L, et al. (1993) Survival of Varroa jacobsoni Oud.(Acari: Varroidae) away from its living host Apis mellifera L. Experimental & Applied Acarology 17(4): 283-290.
[8] https://www.epa.gov/system/files/documents/2024-05/ppdc-resistance-management-recommendations-final_2021workgroup.pdf
[9] https://scientificbeekeeping.com/a-model-for-oxalic-acid-vaporizations/


