
Monitoring varroa

June 25, 2015
The concepts of monitoring pest population levels, and taking action as such pest levels approach seasonally-adjusted treatment thresholds is integral to integrated pest management, no matter whether we are speaking of varroa or any other agricultural pest.
When brood is present in a hive, varroa increase is nearly always exponential from Day 1–in non resistant bees, doubling about once a month. This is for the entire varroa population in the hive. The illusion of linear increase in the mite population occurs for two reasons: (1) all exponential growth curves appear linear in the early stages, and (2) the bee population in a colony builds along with the mite population for the first part of the season, so the infestation rate (number of mites per bee) does not change to any great degree so long as the colony is also growing at the same rate as the mites.
The monitoring of the infestation rate of adult bees does not directly reflect the total mite population in the hive, since a proportion of the mites are typically hidden in the brood (about 50% for much of the broodrearing season). Natural mite fall more accurately reflects the total mite load of the colony, but needs to be considered in the context of the size of the colony, and the amount of brood emerging on that day (natural mite fall is mostly correlated with daily adult bee emergence, and typically varies greatly day to day).
The sudden increase in varroa level in late summer, observed when monitored by the sampling of adult bees, gives the illusion that the varroa infestation of the colony has suddenly begun to “go exponential.” What has actually occurred is that the recruitment rate of bees tends to rapidly drop off after the main flow, due to reduced broodrearing. This results in a greater infestation rate of the remaining brood, and a shift of the mite population from out of the brood, and onto the adult bees, hence the appearance of an “exponential explosion” of the mites.
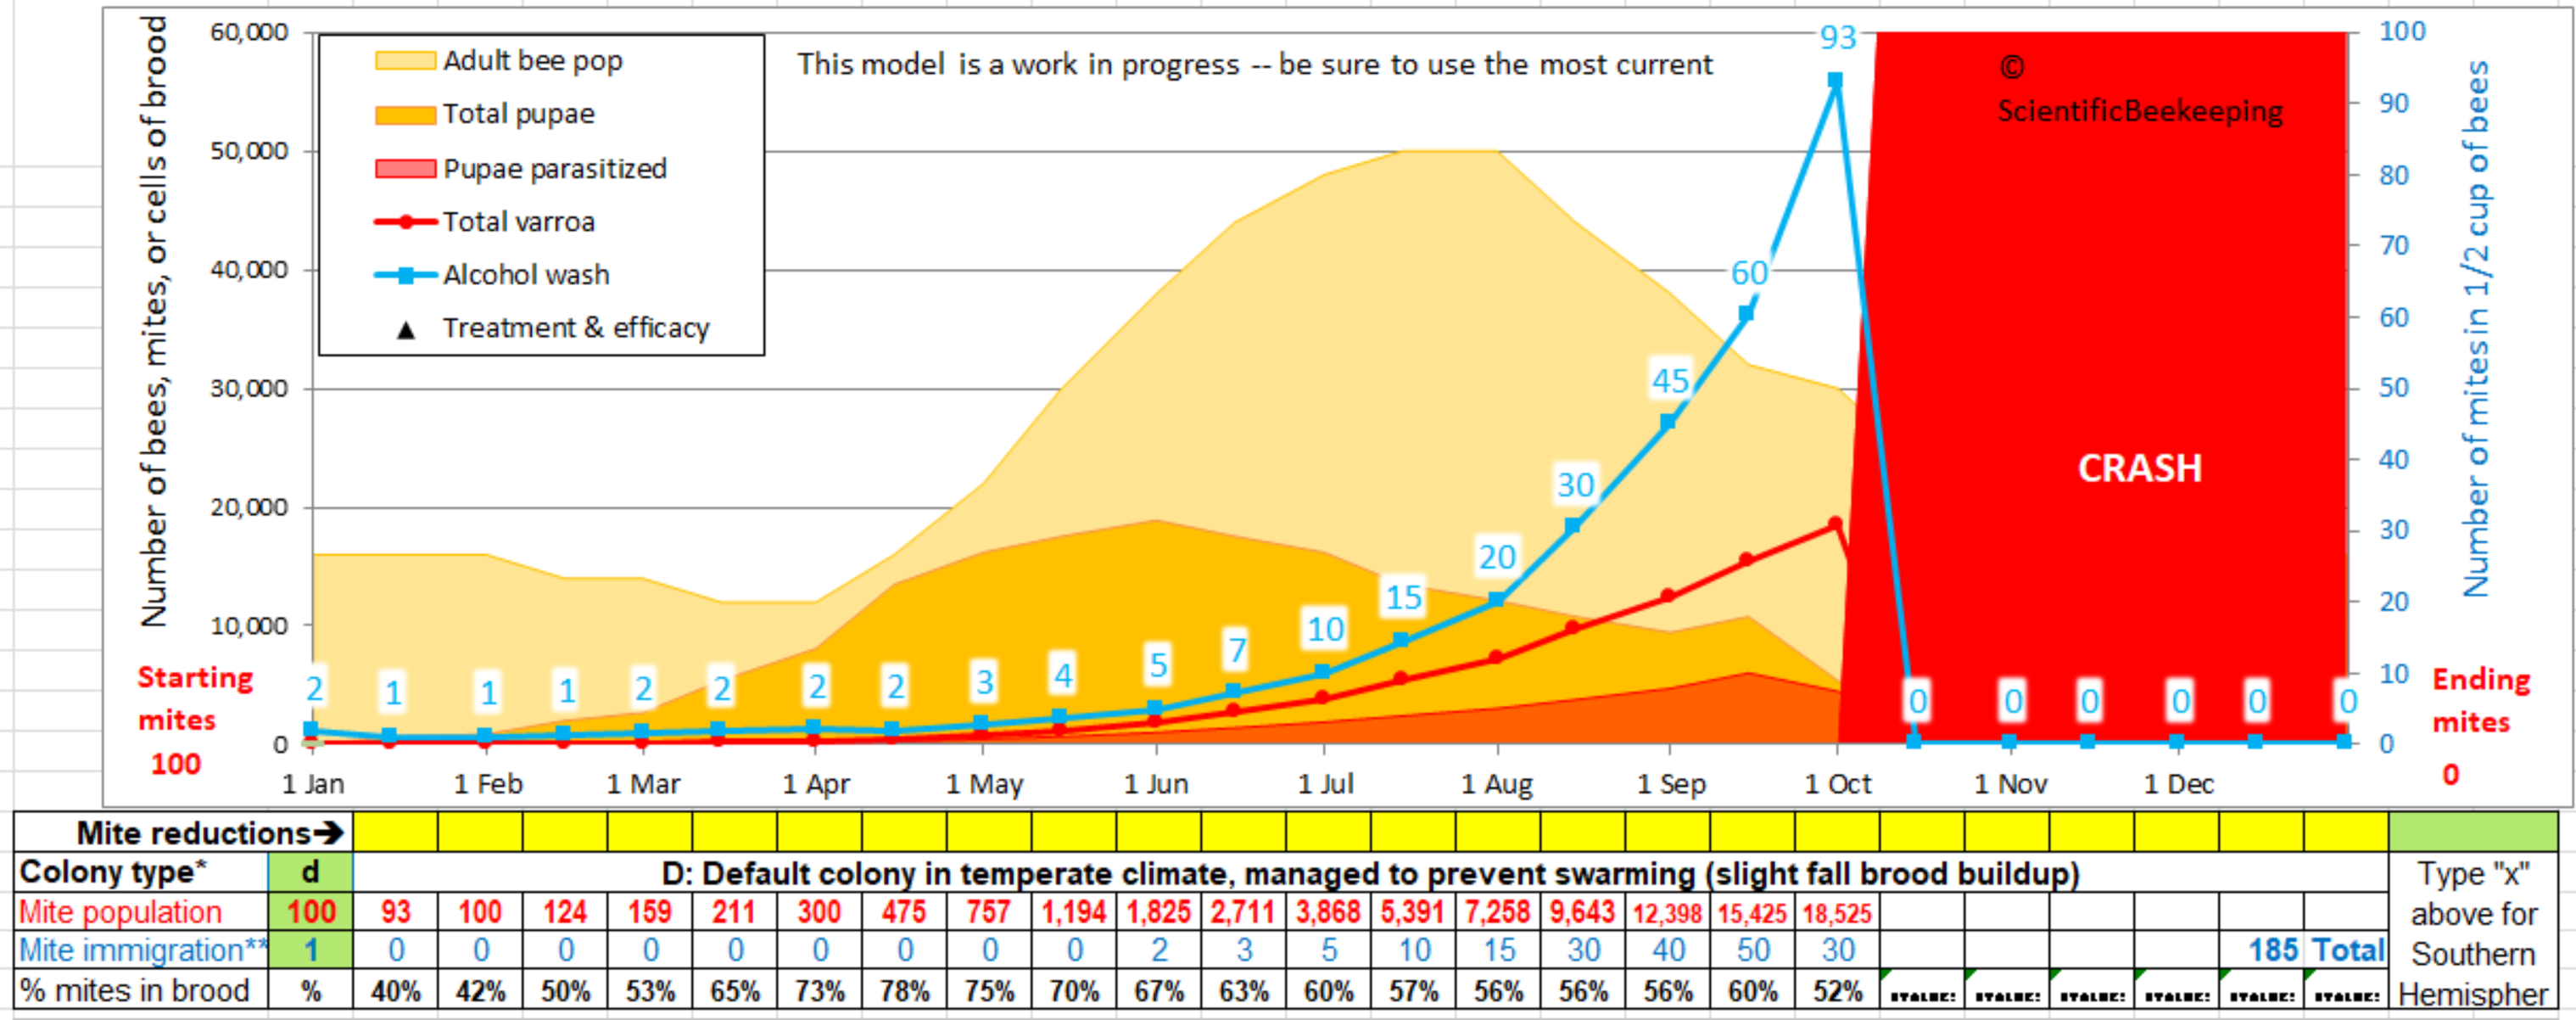
The above simulation is from Randy’s Varroa Model — a free download that you can use to plan your mite management strategy. https://scientificbeekeeping.com/randys-varroa-model/
Note how the mite infestation rate “explodes” in late summer/ fall, despite the fact that the total mite population of the hive appears to have only increased relatively slightly. This illusion is due to the scale of the y axis. Allow me to plot out the exact same data for the mite population on a more illustrative scale below:
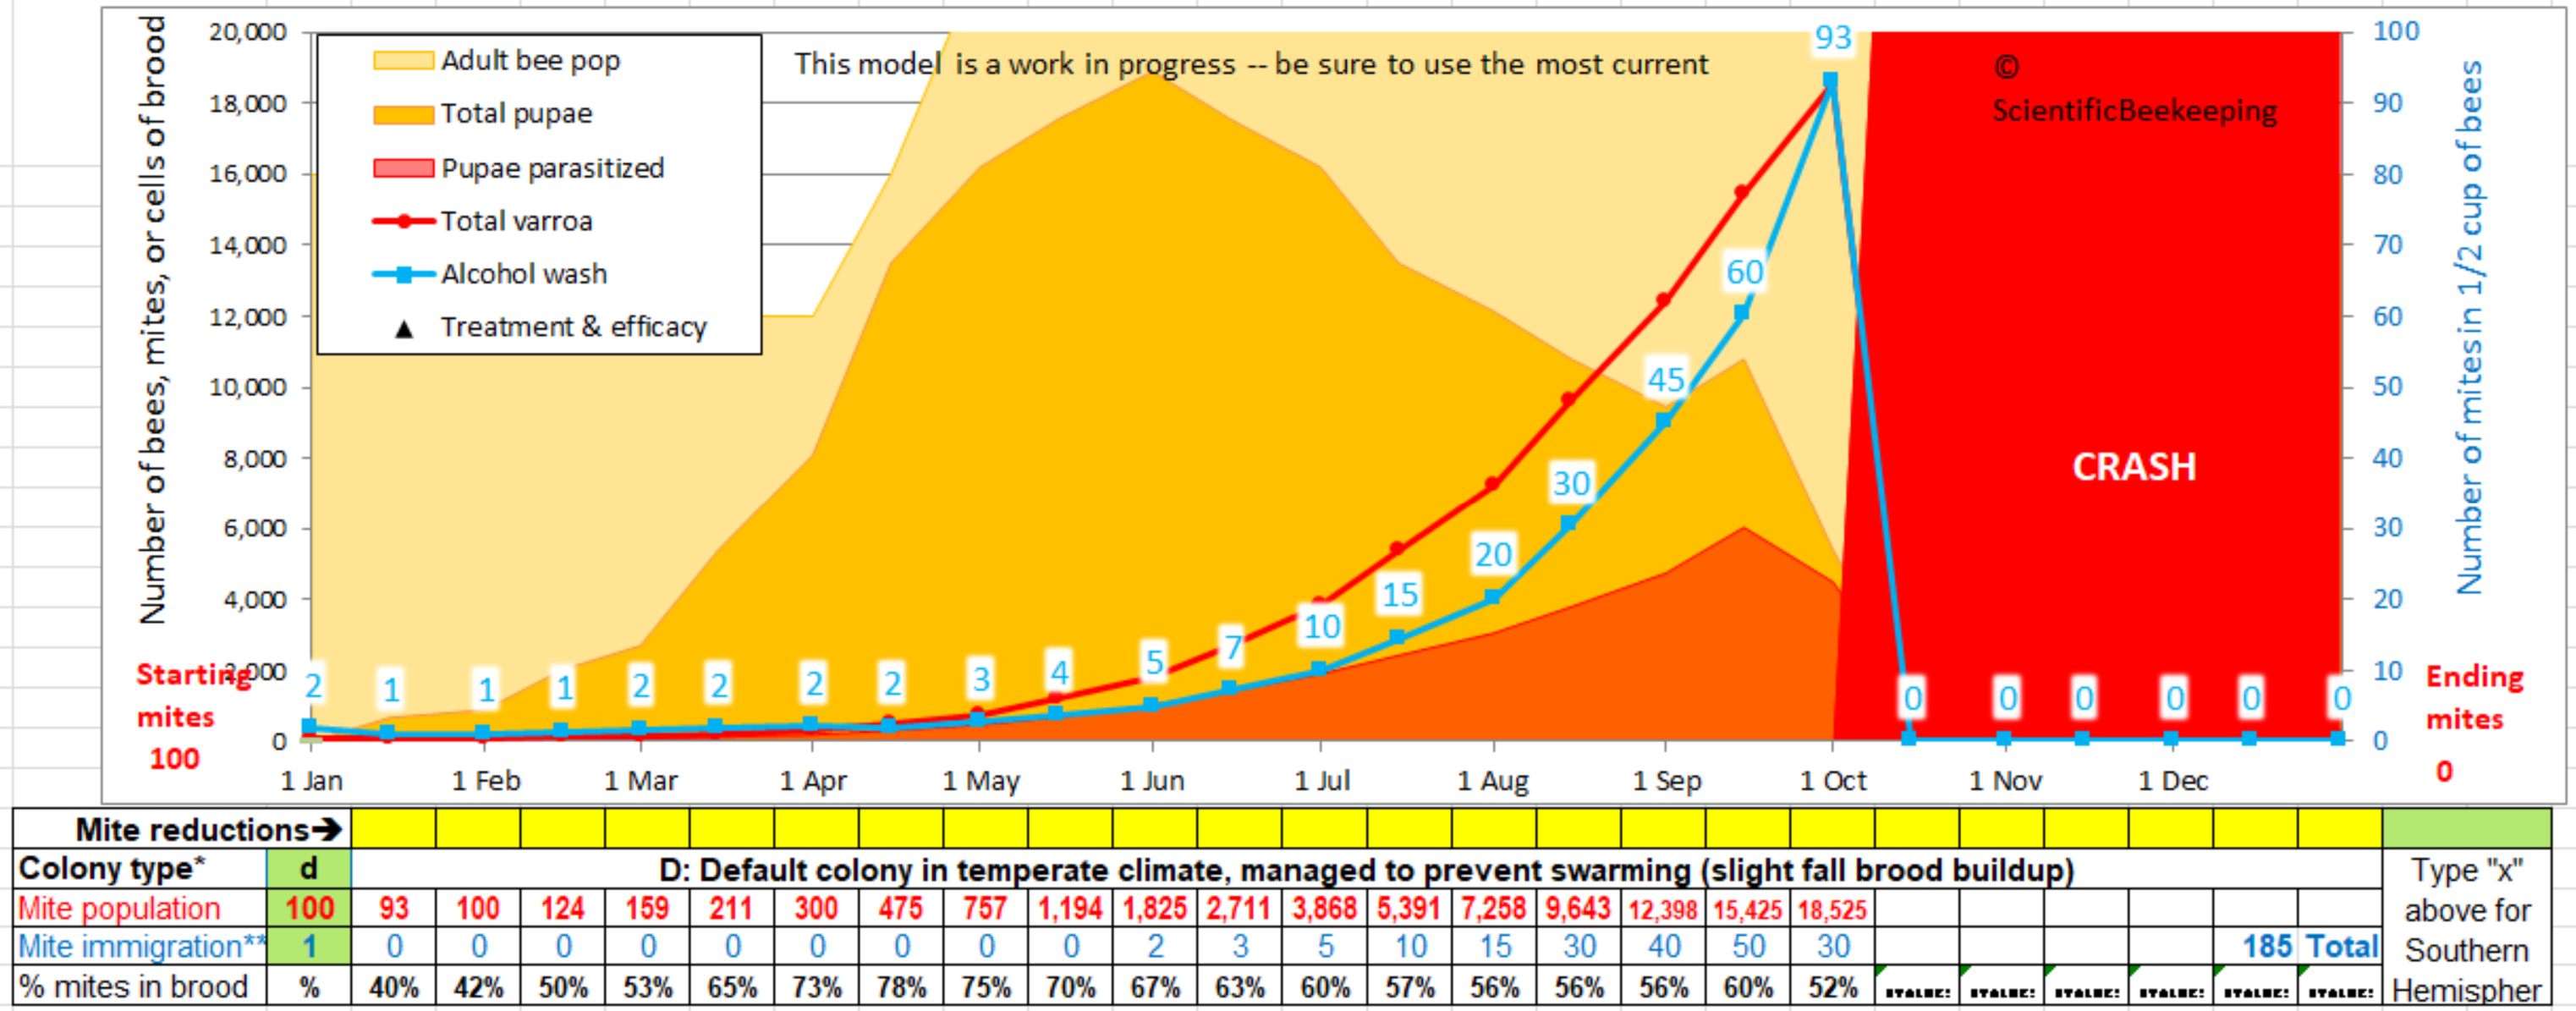
This is exactly the same simulation, but plotted on a different scale. The mite growth is clearly exponential.
The mite wash count is even steeper later in the season, as the amount of sealed brood decreases, forcing more adult mites out onto the bees.
Important point: Mite wash counts underestimate the total mite population early in the season. Note the percentage of the mites in the brood on the bottom row. Only as little as 20% of the mites are on the adult bees during swarming season, when there is a ton of sealed brood.
The other factor that can cause an increase in the mite population is immigration of mites from other highly-infested hives in the neighborhood, which typically occurs in late summer and fall. Robbing and drifting bees can suddenly increase the mite population of surviving hives within flight range.
The proactive beekeeper will monitor mite levels throughout the season, and apply seasonally-adjusted treatment thresholds to keep the mites at acceptable levels. It is far better for the bees to keep mite populations from building, than it is to reduce them after they’ve built to damaging levels.
In our operation, we don’t want to see mite wash counts from a half cup of bees to exceed 1 (one) mite in the springtime. By the first of July, we treat if the count is above 6 mites.
The most important concept to keep in mind is that it is not the mites that kill the colony–it is epidemics of viruses vectored and triggered by a high rate of mite infestation. So long as the infestation rate of the adult bees remains below about the 2% level (6 mites per half cup of bees, assuming complete recovery of mites by your sampling method), viruses are seldom a serious issue. As the level approaches 5% (15 mites per half cup), depending upon the individual colony, in-hive epidemics of either DWV, one of the paralytic viruses, or Lake Sanai Virus begin to occur.
Such virus epidemics, as well as the rate of recruitment of new bees via broodrearing, are highly influenced by the protein intake of the colony, in the form of pollen or pollen sub.
The proactive beekeeper understands pollen, bee, and mite population dynamics, and manages his hives to prevent the relative population of the vector (the mite infestation rate) from exceeding the threshold at which viruses are likely to go epidemic.
I have a number of articles on this website, continually updating methods for mite monitoring. By keeping a constant eye on varroa, your colonies can thrive!


