
The Varroa Problem: Part 13 Using the Mite Model

December 12, 2017
The Varroa Problem: Part 13
Using the Mite Model
First published in ABJ December 2017
Randy Oliver
ScientificBeekeeping.com
It’s been nearly 25 years since I saw the first varroa mite in one of my hives, and it’s been a wild ride since then. Not only for our bees, but also for the business of beekeeping, in which we’ve been forced to adapt and evolve.
As my sons Eric and Ian take over the beekeeping operation in which they grew up, I look back over the challenges and changes in beekeeping over the course of their lives. The invasions of tracheal mite, varroa, the Small Hive Beetle, and Nosema ceranae—each with devastating consequences. A changing climate, with shorter winters and longer droughts. A shift from focusing upon honey production to almond pollination income. The change from moving my hives to idyllic summertime pastures of weedy, long-blooming alfalfa, to supplemental feeding of pollen subs and sugar syrup. And most importantly, being a witness to, and participant in, the rapidly-occurring coevolution between our bees, the varroa mite, its associated viruses, and beekeeping practices.
The stopgap measure for varroa management relied upon by most professional beekeepers—regular applications of effective synthetic miticides—does not appear to be sustainable. On the other hand, there are more and more reports of bees naturally evolving some degree of resistance to the mite. Some time ago, I consulted my crystal ball for a peek into the future, and decided that I needed to focus upon three goals:
- To better understand varroa, its population dynamics, and the biological ways by which bees develop resistance to the mite. This led me to create the mite model which this article is about.
- To get serious about figuring out how to selectively breed for mite-resistant bees. To this end I will continue my Walking the Walk reports on the progress of my attempt to demonstrate an economically realistic and practical breeding program.
- And finally, for mite management during the transition to naturally-resistant stock, to find a sustainable and safe varroa control product for use during the heat of summer—one that doesn’t contaminate the honey or the combs. For this I’m focusing upon obtaining registration of the extended-release application method for oxalic acid in glycerin.
I’m happy to report that I feel that I’m now on track towards achieving all the above goals [[1]]—and it feels pretty good! So let’s return to see what we can learn from my varroa model.
Still a work in progress
When an artist completes a masterpiece, no one would think to add another brushstroke. This is not the case for my mite model! I’m under no illusion that it is a “done thing”—I’ve already uploaded several revised versions since first posting it [[2]].
Most beekeepers using the model need not go beyond simply choosing an appropriate “Colony” type, entering a mite number to reflect their observed alcohol wash counts, and then seeing the effects of applying treatments. Other, more motivated beekeepers, will, I hope, send me spreadsheets with observed in-hive values for frames of bees, amount of brood, and percent drone brood over the course of the year for their specific ecoregion–which would then allow us to customize the model for beekeeping anywhere in the world.
And then I invite those with a deeper interest to go deeper into the assumptions and calculations used in the spreadsheet in order to continually improve it. At this point, however, let’s go under the assumption that the model produces fairly accurate simulations, and see what we can learn from it.
Adjusting the model For your bees and region
Maybe some of you have already played with the model. One can generically learn about mite management by using the Default “colony” setting, but the model is far more useful if you fine tune it for your specific conditions and management. The model consistently reproduces the observed alcohol wash counts in my own operation and those from other data sets [[3]]. But if the simulations don’t match the mite counts in your own hives, first confirm that the bee, brood, and drone brood settings on the “colony” tab accurately reflect what actually occur in your hives, and then use the “advanced” settings to adjust the mite buildup rate to match what you observe.
Learning from the model
Resistance and sensitivity analysis [[4]]
One of the most interesting things to play with in the model is to change the variables for number of daughter mites per foundress, their success at getting mated, the mortality rate of the mites (perhaps due to grooming behavior by the bees), as well as the attractiveness of the brood cells to the mite [[5]].
Practical application: I’m surprised at how little it would take for bees to improve their resistance to varroa—perhaps most easily by engaging in “the battle of the pheromones” [[6]].
Interpreting the Alcohol wash
The simulations indicate that during spring buildup, the alcohol wash mite count increases at a much slower rate than does the hive’s total mite population [[7]]. This is because early in the season, a lower percentage of the mites are phoretic—since most will be in the brood (see the last column in Fig. 1).
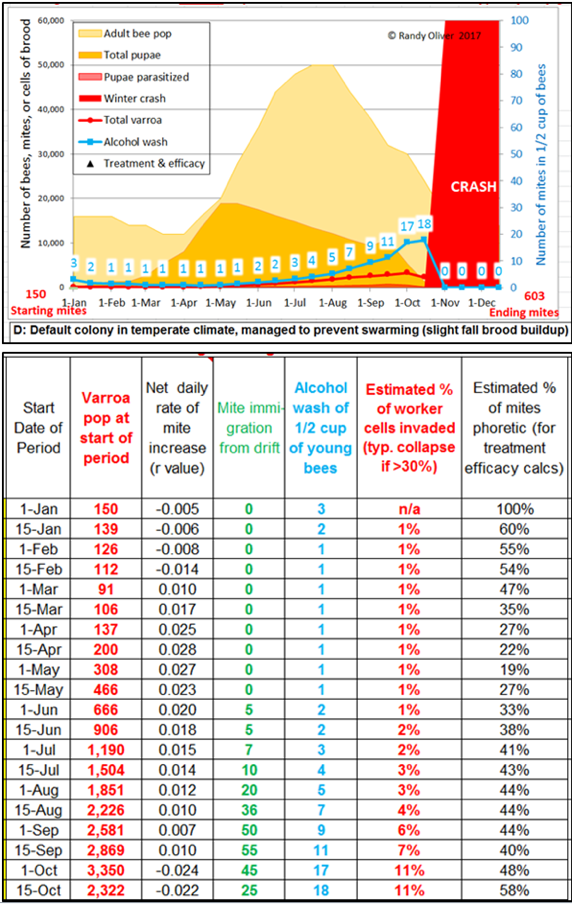
Figure 1. Note in the graphic how the alcohol wash count (in blue) may not be alarming clear through mid July, yet the mite population in the hive has grown tenfold (as indicated in second column of the table). Note also how the mite population increases at a much greater rate during spring buildup than it does later in the summer, as indicated by the “r” values in the third column.
Practical application: don’t be misled by low alcohol wash counts early in the season—the varroa population is growing at it most rapid clip at that time, due to the youthful mite population, the high brood-to-bee ratio, and the abundance of drone cells.
What I soon realized was that alcohol wash counts need to be carefully interpreted—they do not necessarily reflect the actual rate of mite buildup. This is because the percentage of mites that are phoretic varies greatly over the course of the season (refer to the last column above). Note that on the first of May, roughly 80% of the mites may be hidden in the brood, and thus not be reflected by a sampling of adult bees. To illustrate, I took the values from a similar simulation, and plotted them in a different manner (Fig. 2).
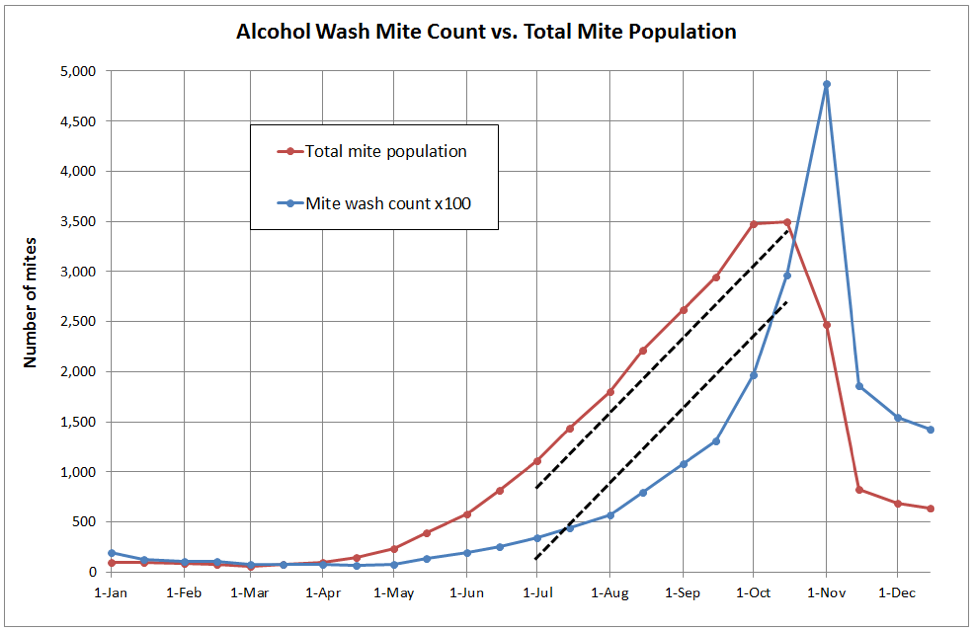
Figure 2. In this typical simulation for a mid-country colony, the alcohol wash count from 1 March through 1 July went from about 1 to 5, whereas the total mite population increased 18-fold. This is because during the period of active broodrearing early in the season, a greater proportion of the mites are in the brood, and thus not reflected in an alcohol wash. Fortunately, the alcohol wash tracks the total mite buildup rate more accurately during the critical July through September time period (compare the slopes of the dotted lines).
This doesn’t at all mean that the alcohol wash isn’t useful, but rather that it needs to be interpreted appropriately. During swarming season (when there is lots of sealed worker and drone brood) the vast majority of the mites will be in the brood, and alcohol wash counts will read low (Fig. 1). Then for most of the summer, roughly half the mites are in the brood at any time [[8]], and the alcohol wash gets back on track. In September and October, as the colony cuts back on broodrearing, alcohol wash counts may skyrocket—especially if there is much mite immigration due to drift from more highly-infested hives [[9]].
Practical application: there is no single “treatment threshold”—a mite count of 1 may be cause for concern in May, whereas a count of 10 may be acceptable (to some) as the bees are wrapping up broodrearing in autumn. By happy chance, the alcohol wash pretty accurately reflects the degree of overall mite infestation from July through September.
EFFECT OF IMMIGRATION
There has been much discussion of late about “mite bombs” and “mite drift.” In order to account for this in the model, I downloaded several data sets in which researchers had counted the number of mites entering mite-free monitored colonies—via drift and/or robbing (some of the measured numbers were surprisingly high). So the model allows the user to set one of five values for mite immigration, depending upon how many colonies crashing from mites are within flight range. What the simulations indicate is that late-season mite drift can easily push a colony past the tip point (Fig. 3).
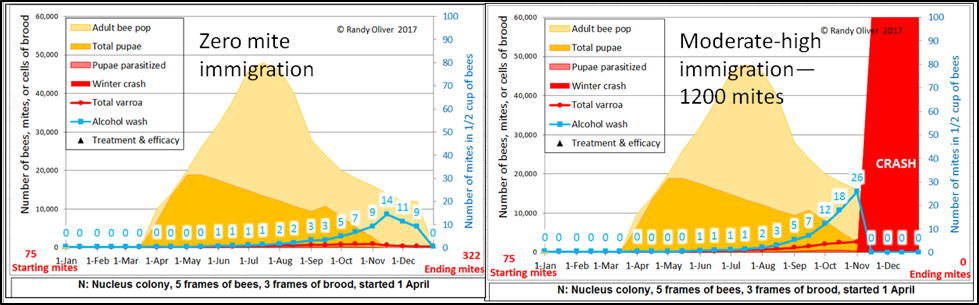
Figure 3. Two identical simulations for a colony started from a nuc in April—changing only the amount of mite immigration. The 1200 mite figure is high, but unfortunately quite realistic if one’s apiary is surrounded by apiaries suffering from late-season colony losses due to lack of mite management [[10]].
Note that the colony on the left would likely have survived the winter, but it would start the next year with four times as many mites, and would not survive the next season without treatment.
Practical application: I find that it makes a big difference which setting I use for mite immigration, especially following an August treatment. In some urban areas, incoming mites can frustrate those diligently attempting to manage varroa [[11]].
the Amount of drone brood
Mites reproduce more successfully in drone brood than they do in worker brood. So it’s reasonable to ask just how important (or feasible) it is to manage the amount of available drone cells in the hive. According to a meticulous study by Allen [[12]], a colony will typically allocate up to 5% of its brood area to the rearing of drones. But if there is an excess of drone comb available, they may rear up to 20% drone brood. Running simulations, if I increase the amount of drone brood from 5% to 10%, it makes a substantial difference in the rate of mite increase.
Practical application: if you are not using foundation or are inserting drone combs, it may be wise to keep tabs on how much of that comb your colonies are using for rearing drone brood. Conversely, the model allows for mite trapping in drone frames as a “treatment.”
Practical application of the model
The utility of a having a model for varroa is explained by Wilkinson [[13]]:
A robust and flexible model of varroa in a honeybee colony can be a very useful tool to improve our understanding of varroa population dynamics, and to highlight the more accurate monitoring methods, and the more promising control regimes.
Well put. As I’ve slowly developed this model, I’ve found it to be very useful for deciding upon my own management decisions regarding mite control. As an example, allow me to run a simulation with which I’m quite familiar—that for the colonies that we split 4 ways into nucs after almonds (Fig. 6).
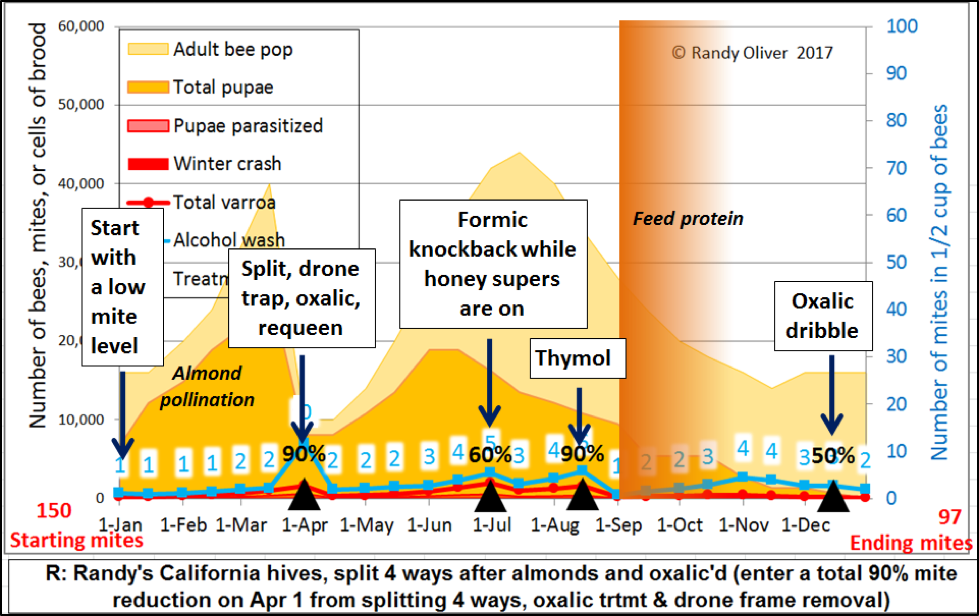
Figure 6. Our typical mite management for those colonies that we split 4 ways in the spring [[14]]. I adjusted the rates of mite buildup and immigration to match what I typically observe in our California operation. In some years, we may need to do an additional thymol or formic treatment in late September or October. Note that we knock the mites way down before we begin stimulative protein feeding in September. Since our colonies often don’t go completely broodless, I didn’t show a high efficacy for the winter oxalic dribble. Note that we make a point of rotating treatments.
There you go—have at it with the mite model. Create your own management schemes and test them out. Have fun!
Acknowledgements
Thanks as always to Pete Borst for research assistance, and to all the dedicated and hard-working bee researchers from whose publications I draw useful information.
Notes and Citations
[1] I’ve of course still got other irons in the fire, such as the development of better pollen subs, different hive configurations, and improved application methods for thymol and formic acid.
[2] https://scientificbeekeeping.com/randys-varroa-model/
[3] There is a large degree of hive-to-hive variation in mite buildup rates in my own operation (this is what allows me to perform selective breeding for mite resistance), but the model pretty accurately predicts median values for what I observe in the field.
[4] Sensitivity analysis with regard to a varroa model such as this refers to the user’s ability to tweak the input variables, in order to determine which treatments, timing, management methods, or traits for mite resistance would likely be most effective.
[5] In some mite-resistant colonies, the phoretic period of questing mites appears to be increased. This may have to do with the attractiveness of 5th-instar larvae to questing mites. The trait appears to be highly heritable–refer to Table 2 in Harbo, JR & JW Harris (1999) Selecting honey bees for resistance to Varroa jacobsoni. Apidologie 30: 183-196.
[6] Anderson, D (2006) Clarification of aspects of Varroa reproduction—first stage of a possible new control method. RIRDC Pub. No. 06/007. “The simplest [approach for producing varroa-resistant bees] would be to search for A. mellifera populations that produce a [kairomonal] signal profile that is outside the receptive range of the Korea…genotype of V. destructor. Such bees could be easily propagated in isolation to produce varroa-resistant bee lines.”
[7]This is further exacerbated by the problem that in order to get the model’s output chart to fit the maximum bee populations and maximum alcohol wash counts, I needed to use two different scales on the y-axes. This makes the slope of the alcohol wash count curve appear less steep than it actually is relative to the curve for the total mite population.
[8] I got a very nice data set from Dr. Katie Lee in support of this. For a nice visual, see Fig. 3 in Rinderer, TE, et al (2001) Resistance to the parasitic mite Varroa destructor in honey bees from far-eastern Russia. Apidologie 32 (2001) 381–394 381.
[9] If all hives within flight range have the same mite infestation rate, there wouldn’t be any net change due to drift. A positive value for mite immigration only occurs when there are “mite bombs” in the vicinity—the roughly 10% of hives (in my operation) in which the mite population explodes, and especially if those mite bombs get robbed out as they collapse.
[10] Frey, E & P Rosenkranz (2014) Autumn invasion rates of Varroa destructor (Mesostigmata: Varroidae) into honey bee (Hymenoptera: Apidae) colonies and the resulting increase in mite populations. Journal of Economic Entomology, 107(2):508-515. I also consulted a number of other studies for hard data.
[11] I’ve reviewed weekly mite counts taken by beekeepers in some urban areas in which mite drift is a real problem. They can get their mite counts to zero in August, but need to keep treating as mites flood in from their neighbors.
[12] Allen, MD (1965) The effect of a plentiful supply of drone comb on colonies of honeybees. Journal of Apicultural Research 4(2): 109-119.
[13] Wilkinson, D & GC Smith (2002) A model of the mite parasite, Varroa destructor, on honeybees (Apis mellifera) to investigate parameters important to mite population growth. Ecological Modelling 148: 263 – 275.
[14] I still need to confirm alcohol wash counts for October and November, for which I don’t have much data.


