
Re-Evaluating Varroa Monitoring: Part 4 – What About Letting the Shook Bees Fly Off?

August 6, 2020
Re-Evaluating Varroa Monitoring
Part 4
WHAT ABOUT LETTING THE SHOOK BEES FLY OFF?
Randy Oliver
ScientificBeekeeping.com
First appeared in ABJ June 2020
In my previous article I showed how the varroa infestation rate of bees varied by comb type, with those on brood frames having higher mite counts, but those on storage frames, despite showing lower counts, appearing to perhaps be more consistent. Is there a way to strike a happy medium?
In order to collect a sample of bees, some beekeepers drag a bottle over the comb to cause the bees to drop in. Others, including myself, prefer to first shake the bees into a tub (Fig. 1) for a few reasons:
- So that I can check for the queen in the tub before I scoop up the bee sample, and
- I find that after the older bees have flown off, the remaining young bees are much easier to level off in a measuring cup (they have zero interest in stinging), and thereby allow me to get a consistent number of bees in the sample, and
- By allowing the older bees to first fly off, I’d have only nurse bees left — those which should have the most biologically relevant varroa infestation rate.
I have no doubt about the first two reasons, but in my process of questioning every assumption regarding alcohol washes for mite monitoring, I felt that I should confirm the last.
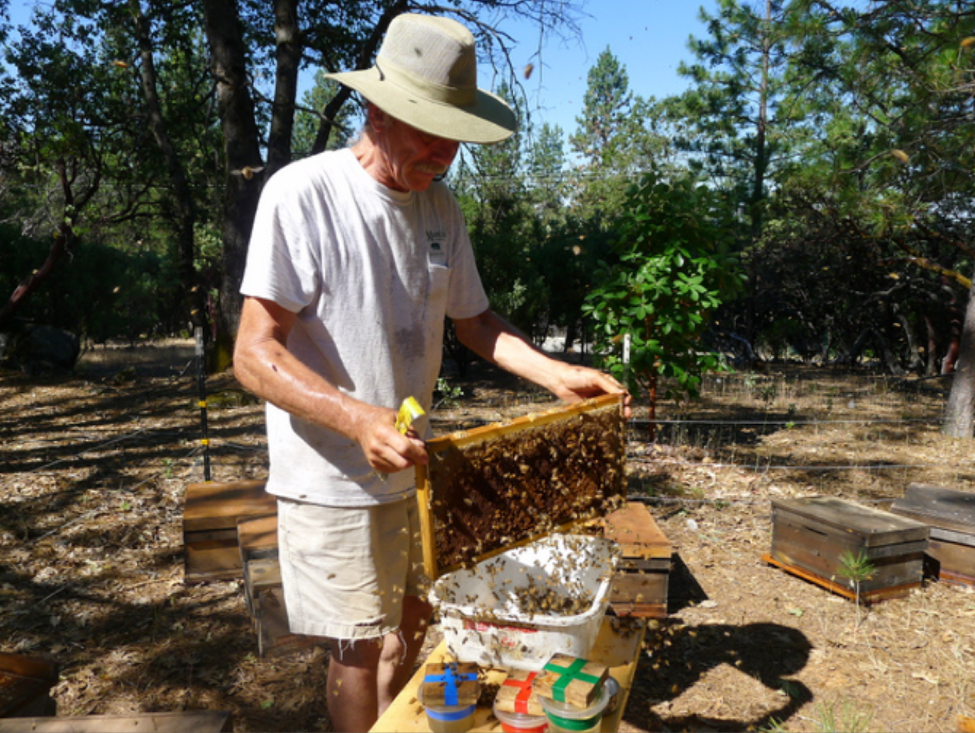
Figure 1 Shaking the bees from a comb into a tub does not elicit any noticeable defensive behavior (at least with my bees) — I use this method at all times of the day, and in all sorts of weather and temperature. Tip (thanks to Dr. Jeff Pettis): use an 18-qt dish tub rather than a 12-qt, since you can then hold the comb diagonally and get most all the bees into the tub with less chance of spilling a queen (yes, I’ve seen it happen a number of times).
Older bees with flying experience will immediately fly toward light (Fig. 2), and then back to the hive entrance. Younger bees avoid light, and remain temporarily stunned in the tub. After several seconds, they spread out and form an even layer over the bottom and sides of the tub, making it easy to spot a queen. Those remaining bees are as gentle as pussycats, and can be comfortably handled and measured.
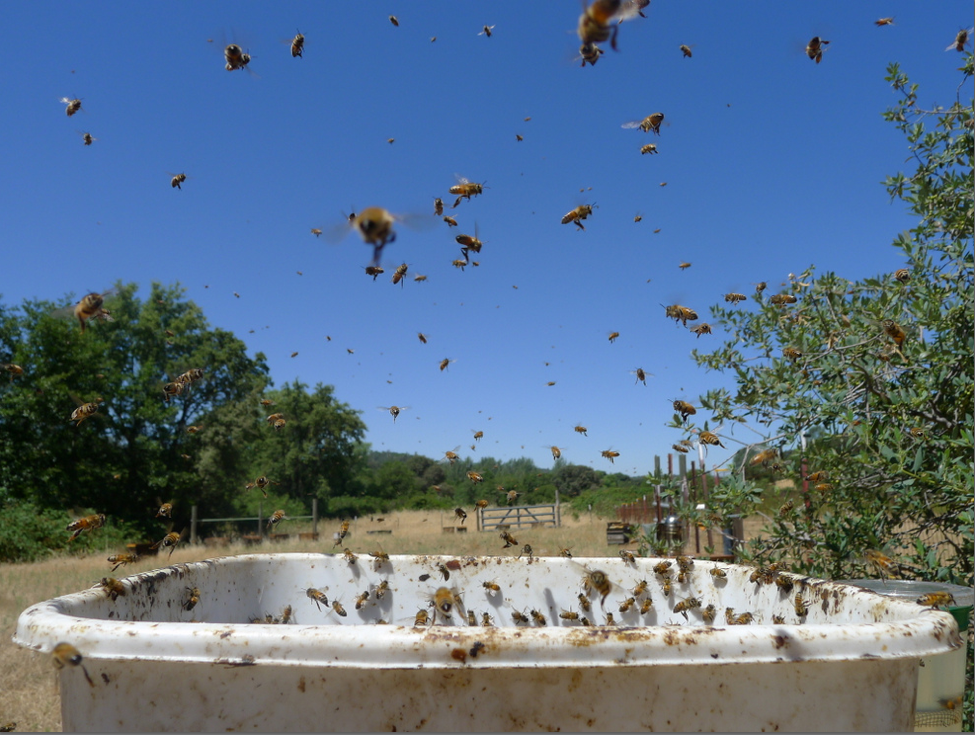
Figure 2 Older workers fly towards light; younger workers stay in the tub. My question is, do the remaining younger bees consistently exhibit a higher mite infestation rate than the bees that flew off?
If the bees that fly off indeed have a lower infestation rate, then waiting to scoop the sample will result in a higher, and perhaps more biologically relevant, mite count.
Analysis of a previous study
In the second article of this series, I presented somewhat conflicting data regarding worker distribution on the combs by age class. One data set was collected by J.B. Free [[1]]. He marked bees by age class, and inserted combs of even-aged larvae into hives. He later removed the frames, and counted the number of bees of each age class on each type of comb. He found that a goodly proportion of nurse bees were distributed even over the storage combs of a hive (Fig. 3).

Figure 3. I worked up Free’s raw data. Notice the greater proportion of older bees (blue) relative to nurse bees (green) on the storage combs, especially those in the upper boxes. It seems to reason that those older bees would lower the overall mite infestation rate of a bee sample taken from those combs. But what if you first allowed the older bees to fly back?
Fortuitously, Free had also measured something else: he counted the number of bees of each age class that flew from the combs back to the hive. He found that 95% of bees over 22 days of age would fly back to their hives (Table 1).
| Table 1. Fly-off of bees by age class. After data from Free, 1960. | ||
| Age of bees | % that flew back | |
| 2 & 3 day | 2% | |
| 4 & 5 day | 7% | |
| 8 & 11 day | 18% | |
| 15 & 18 day | 39% | |
| 22, 25,29,33,36 day | 95% | |
So I adjusted the data for Figure 3 to estimate what the proportional age groups would be in a shook bee sample after allowing for fly-off (Fig. 4).
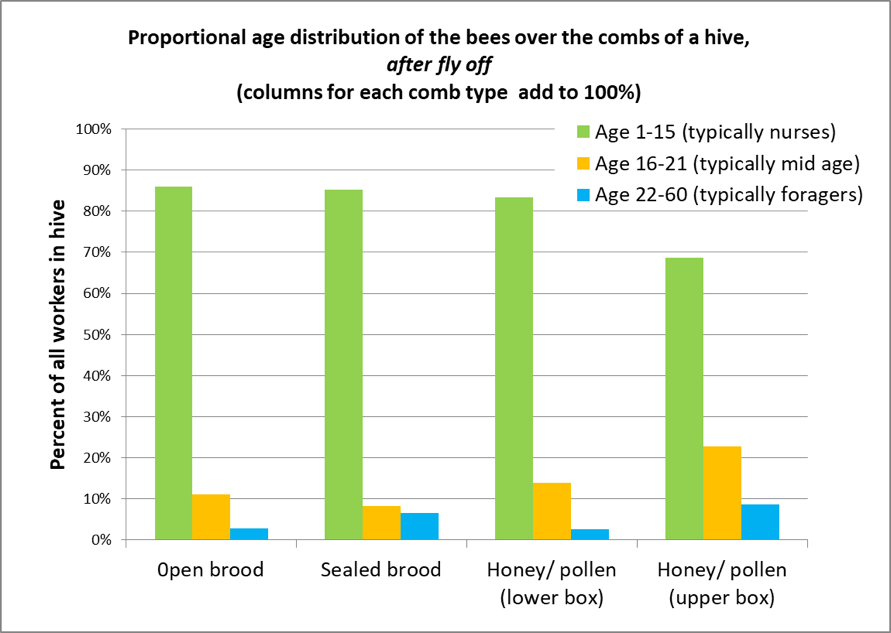
Figure 4. This calculated projection shows the expected age class distribution in samples of shook bees from the different comb types, after allowing for fly-off. This may explain why mite counts are so much higher on bee samples taken from brood combs if the older bees are allowed to fly off. Note that on honey and pollen frames taken from the upper brood chamber, even after fly-off, only about 70% of the remaining bees are nurses, as opposed to 85% on brood combs.
My own field study
In his study, Free did not shake the bees from the combs, so I’m hesitant to extrapolate with confidence regarding the effect of fly-off upon shook bee samples. So I performed a field study of my own.
Materials and methods
I shook bee samples from high-mite hives at the end of the California season while there was still some brood in the hives to provide young workers (on October 31 and November 1). The hives were not especially strong, so I often shook bees from more than one comb (some containing brood) into a tub. I took photos of each step (Figures 5-11).
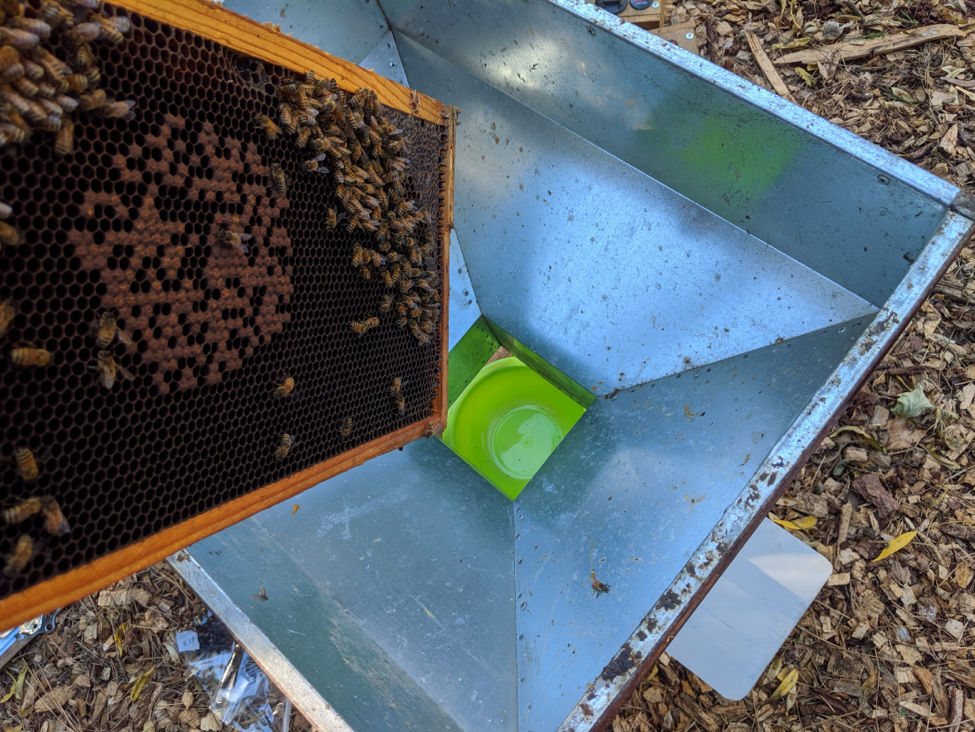
Figure 5. I set a plastic bowl (green) beneath a funnel used to shake package bees. I gave the combs a snap shake. The bees dropped directly into the bowl with a negligible fly-off. I then immediately slid the aluminum sheet at the right across the bowl to trap all the bees inside.
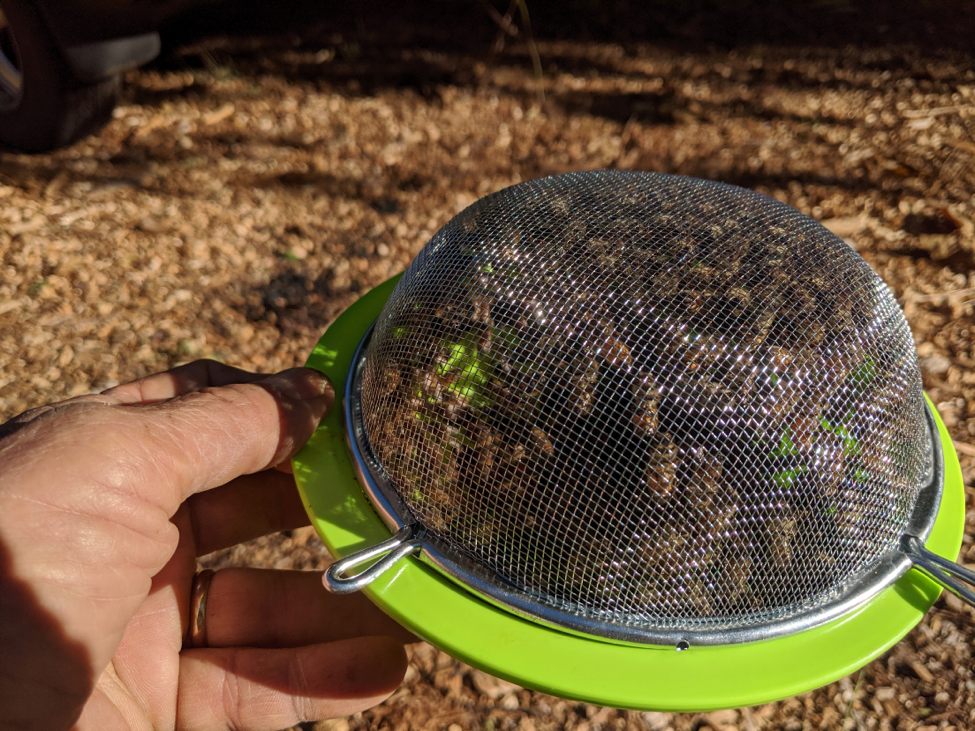
Figure 6. I then placed a sieve above the aluminum sheet, and withdrew the sheet to allow any bees that wanted to fly to go up to the screen. I watched their behavior as I tapped the bowl — the bees that went up stayed up, the bees that stayed down stayed down.
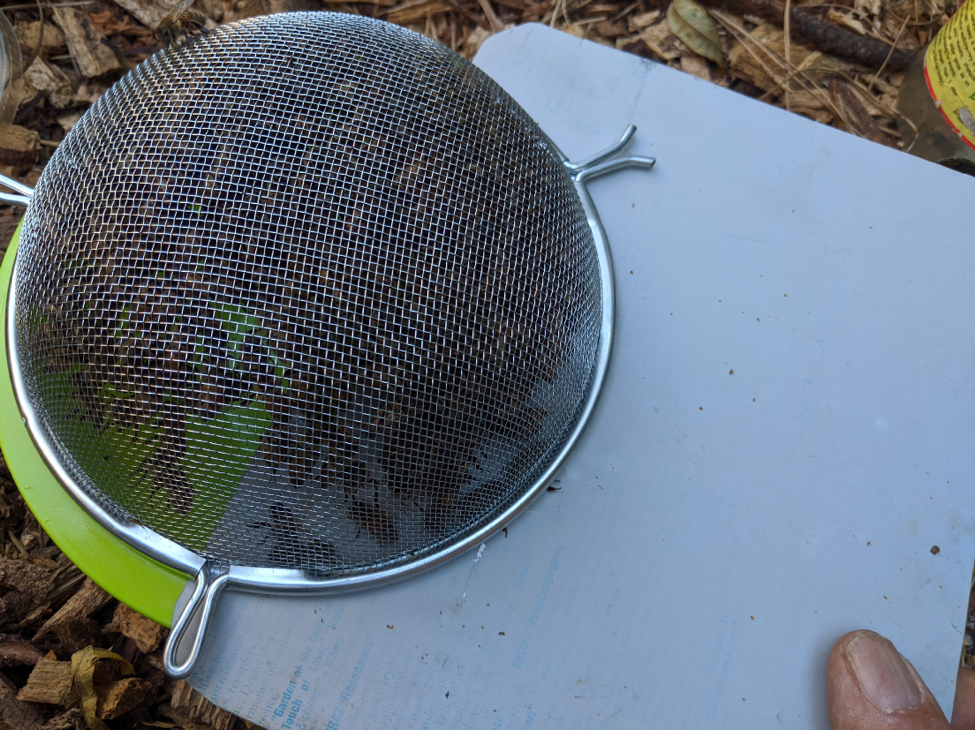
Figure 7. I then slid the aluminum sheet back between the bowl and the sieve, thus separating the bees of each shook sample into two groups: those that wanted to fly, and those that didn’t.

Figure 8. I performed alcohol washes on each group of bees, using color-coded cups for the flyers and remainers. I performed two timed and calibrated washes of each sample to obtain 100% mite recovery.
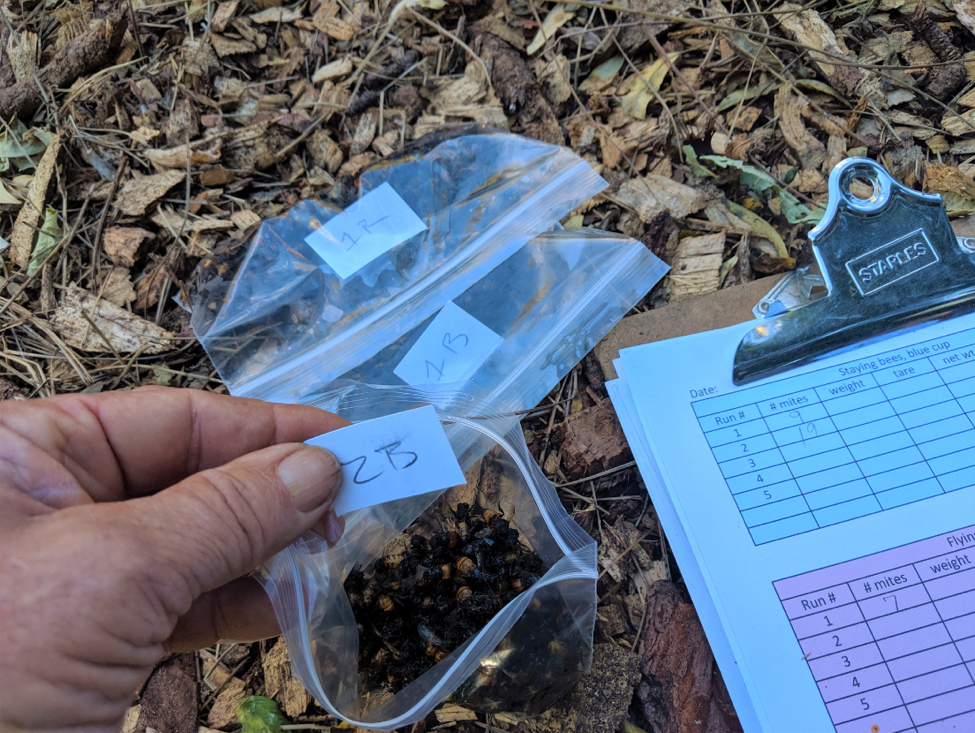
Figure 9. After washing, I drained each bee sample equally, and placed it in a bag for weighing back at home.
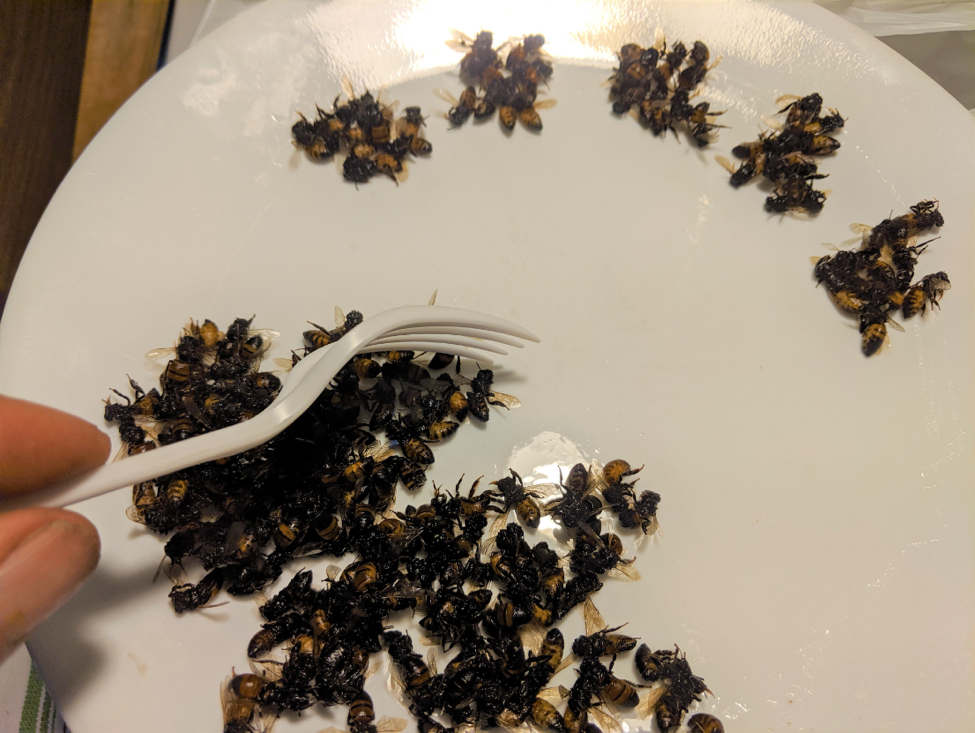
Figure 10. Back at home I counted several samples of 100 bees to determine the average weight per bee, so that I could then estimate the number of bees in each sample.
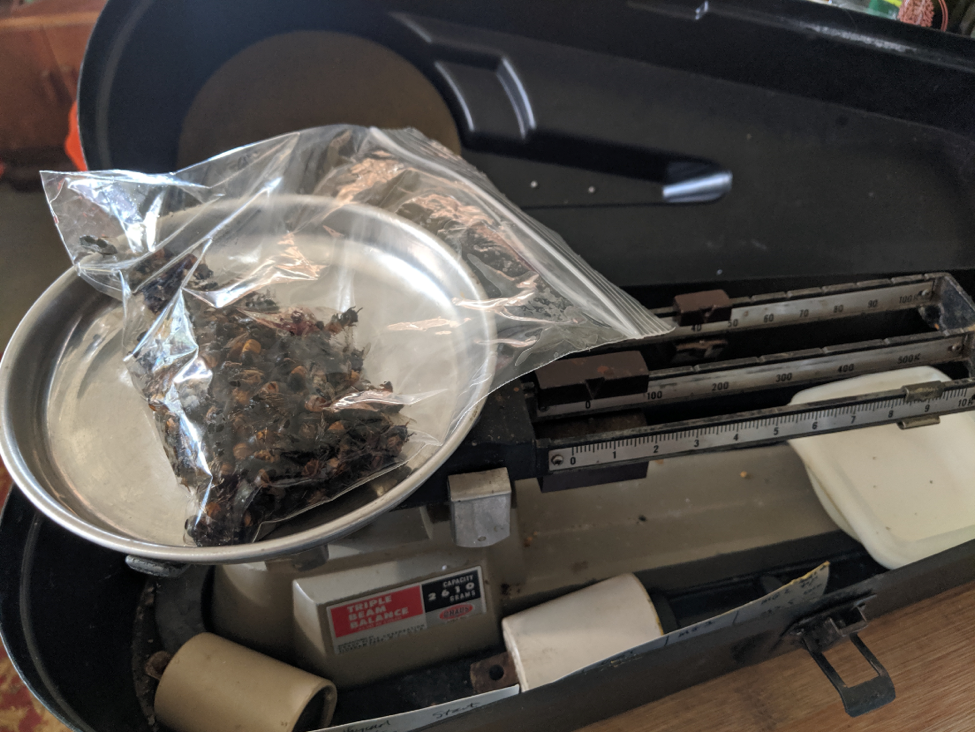
Figure 11. After subtracting the tare weight of the plastic bag, I calculated approximately how many bees were in each sample.
Results
The results are shown in Fig. 12 below.
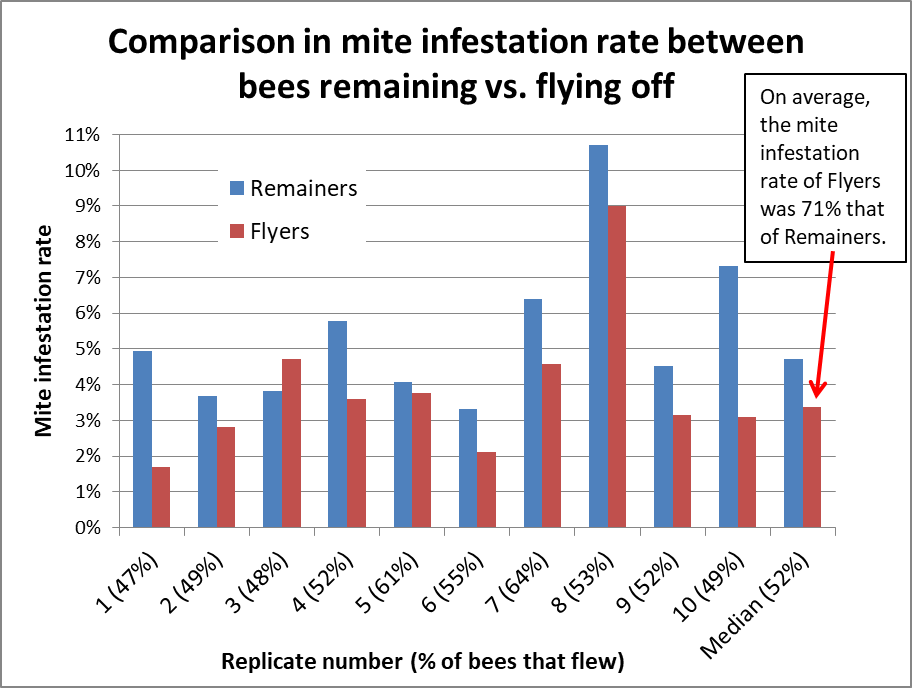
Figure 12. I shook 10 samples of bees, allowing each to divide themselves into “Flyers” and “Remainers.” The percentage of bees that flew is shown in parentheses (averaging 52%). The varroa infestation rates of the remainers are shown in blue, those of the flyers in red. In all but one case, the infestation rate of the Remainers was higher than that of the Flyers (sometimes appreciably so).
I then calculated what the infestation rates would have been of the original unseparated samples, and compared them to the rates of the bees that remained in the tub after fly off. The remaining bees had ~1.2x higher infestation rate than the original sample before fly off.
Discussion
I appears that you can consistently get a higher (and perhaps more representative) mite count by allowing the older bees to fly off.
Of interest is that Lloyd Harris’ data on bee longevity [[2]] suggests that during the spring and summer, over half the workers in the colony would be of “nurse bee” age. My own observation when I shake bees from the upper brood chamber of growing colonies in full brood production, based upon the proportion of bees that fly from the tub, is that the majority are often nurses. However, when I worked up Harris’ raw data to produce the chart of colony demographics over the season [[3]], it indicated that when colonies slow down their brood rearing, that a greater proportion would be expected to be older. My field observations also support this, since later in the season, after peak brood rearing, a greater proportion of bees typically fly out of the tub (in broodless colonies, they may all fly out). Surprisingly, in the late-season colonies used in this study (with minimal brood rearing), half the bees still flew — perhaps diutinus “winter bees,” similar to nurses, don’t tend to fly off.
So what practical advice can come from these quick and dirty field studies? The question, of course, is which comb is the most appropriate comb from which to take the bee sample. So I went back to my frame-by-frame sampling from last month. I had shaken most of the bee samples when it was cool and the colonies well settled, so there was not a great deal of bee fly off, other than in hive #6. I noticed that in that hive the mite counts from the frames adjacent to the brood were fairly consistent.
Since I nearly always take my bee samples from a comb in the upper brood chamber, I worked up the frame-by-frame sampling data for those combs alone, in order to see if comb placement relative to the broodnest made a difference. I sorted the combs by their distance from the nearest brood comb, and then normalized them all by dividing them by the colony average mite count. I also averaged the brood comb counts for comparison. The results are below (Fig. 13).

Figure 13 The black columns represent the average mite count for all frames in each hive (normalized to a value of 1). The green columns indicate the average mite count from the brood frames. The columns representing the storage combs range from orange (closest to the brood, and sometimes containing beebread) to yellow (furthest, and typically containing honey or drawn comb). The Average is for all hives.
Note that a sample of bees taken from a brood comb will contain around half again as many mites as a sample taken from a storage comb, at least under conditions of minimal fly-off. By allowing older bees to fly off, you may be able to decrease that difference. But perhaps the most important takeaway from the graph above is that samples taken from a comb adjacent to a brood comb always fairly closely represented the colony mean mite count. Caveat: not shown is that there was still a goodly amount of variation in the same hive even for combs in similar positions.
Practical application: Lo and behold, my assumption proved correct. So I will continue to take my samples from a comb adjacent to the brood. Such a comb appears to provide a consistent and representative sample, plus the queen is seldom on it. Then I let any shook bees that want to fly off to do so. But keep in mind that there is considerable variation in mite counts from the same hive — don’t trust any single mite count, and sample a large number of hives in each apiary.
I hope that the field data that I’ve presented will allow you to make informed decisions as to which comb types to sample. The main thing to keep in mind is to be consistent — you can’t compare samples taken from brood combs to those taken from storage combs.
Practical application: In my own operation, colonies perform well so long as mite counts (mites per half cup of bees) from storage combs are in the 0-1 range in springtime, do not exceed 6 during summer, don’t peak over 10 in autumn, and drop back to 2 by early winter.
References
[1] Fig. 3 in Re-Evaluating Varroa Monitoring, Part 2, in the April 2020 issue of ABJ.
Free, JB (1960) The distribution of bees in a honey‐bee (Apis mellifera L.) colony. Proceedings of the Royal Entomological Society of London. Series A, General Entomology. 35 (10‐12): 141-144.
[2] Harris, JL (2010) The effect of requeening in late July on honey bee colony development on the Northern Great Plains of North America after removal from an indoor winter storage facility . J Apicultural Research and Bee World 49(2): 159-169.
[3] Figure 4 at https://scientificbeekeeping.com/understanding-colony-buildup-and-decline-part-2/


