
A Field Trial of Probiotics

September 2, 2021
A Field Trial of Probiotics
Beekeeper-Funded Research
First published in ABJ May 2021
Randy Oliver
ScientificBeekeeping.com
In recent years, we’ve learned that the honey bee gut hosts a microbiome consisting of several core groups of bacteria (Figure 1), which if disrupted, may have detrimental effects upon bee health [[1]]. Many beekeepers, in the hope of improving colony health, especially when feeding artificial diets, or after application of antibiotics, have asked me whether there is a benefit from feeding a probiotic supplement. So I ran two field trials to find out.
Introduction
Probiotics are products containing live “beneficial” microorganisms, typically promoted with claims that they provide health benefits when consumed, generally by improving or restoring the symbiotic bacteria living our human gut, or those of our managed livestock. However, there is often little supportive evidence for those claims [[2]]. And in the case of the honey bee, such claims are especially questionable, since the inoculation of the bee gut occurs naturally in the hive during its first week after emergence [[3]], during which time the core microbiome is obtained not so much from trophallaxis, but rather from beebread and the “fecal oral route” via grooming and contact with comb [[4]].
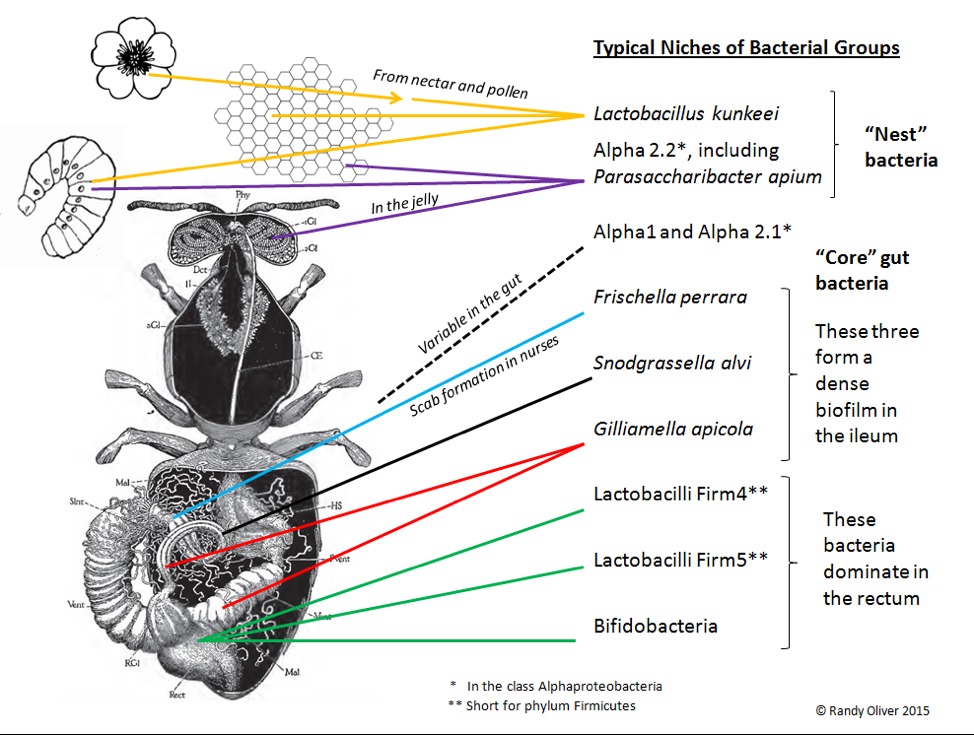
Fig. 1. The core gut bacteria of the honey bee.
Practical questions: Since worker bees easily obtain their core gut bacteria from the combs, why would they need to be fed a probiotic product? Would it make any difference?
This field trial was designed to determine whether monthly feeding of either of two commercial probiotic formulations specifically marketed for honey bees would provide a benefit to colony strength (as measured by cluster size) or performance (as measured by weight gain).
I like to use the above two simple metrics for two reasons:
- Both reflect the final calculus of every aspect of colony health and adult survival, and
- They are the only two metrics that put money in the beekeeper’s pocket.
I ran two simple trials, coupling field measurements with high-tech molecular biology (“next-gen” sequencing), to first see whether either probiotic affected either colony strength or weight gain, and then (to be published later) to learn whether the feeding of the probiotics resulted in any other biological benefits.
Hypotheses to test
Scientifically, the trials were designed to test the following hypotheses:
- Whether feeding a commercial honey bee probiotic over time will result in better colony performance, as measured by cluster size or weight gain.
- Whether one of the two tested probiotics shows greater improvement in colony performance than the other.
- If so, whether such treatment is cost effective (the probiotics aren’t cheap).
- Whether any of the bacterial strains in the probiotics actually establish in the gut.
- Whether feeding of probiotic affects virus, yeast, or nosema prevalence or intensity.
- Whether the gut microbiome is affected by the application of oxalic acid as a varroa treatment.
- Whether feeding of probiotic affects gene expression.
- Whether a probiotic improves reestablishment of the core gut microbiome after treatment with antibiotics.
Yes, quite a list, but we’ll see what we can tease out of the trials.
Experimental design
The trial was set up to determine whether there were measureable effects upon colony performance resulting from monthly feedings of either of two commercial probiotics — SuperDFM (Strong Microbials ) or Pro DFM (Mann Lake) (Figure 2)— compared to feeding a sham control of powdered sugar.
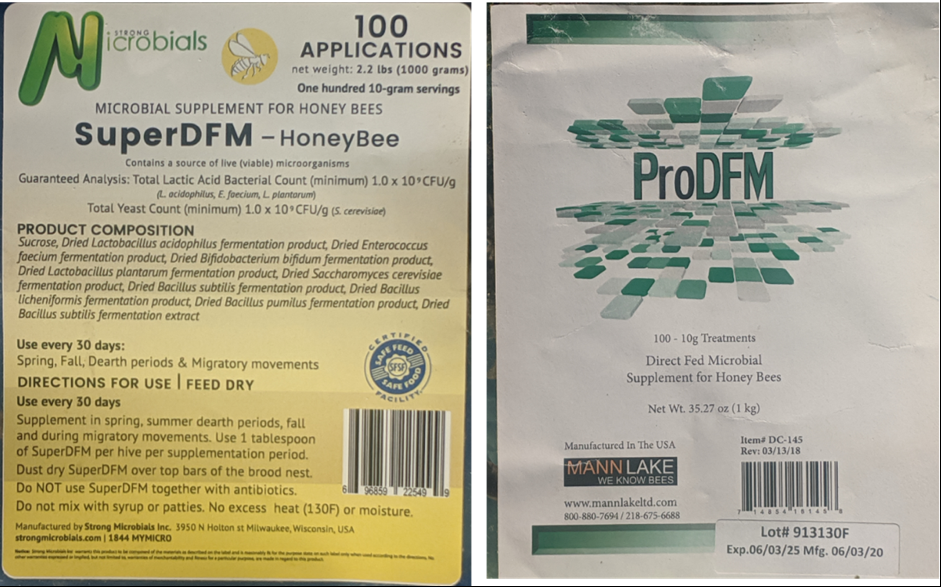
Fig. 2. The two probiotics tested. Will field data support the claims made by the manufacturers?
Methods
We ran the trial in two apiaries (one sunny, one shady; Figures 3 & 4) in the Sierra foothills at approximately 2900-foot elevation. We’d established the yards in April as nucs with queen cells, mating the queens in the yards, each apiary established with cells from different queen mothers. In late June, as the honey flow was winding down, we selected only healthy hives with good brood patterns for the trial, and roughly equalized them for strength (to a median 8.5-frame cluster size) by swapping combs (due to a miserable spring, most colonies in our operation were still weak in June). We treated all hives with formic acid prior to starting the trial, and checked each colony for queenrightness afterwards (taking a replacement queen from the few extra colonies in each yard if necessary).
We then consecutively numbered the hives, and randomly assigned one of three treatments to one hive in each numerical block of three hives. We blinded ourselves as to which treatment was which by asking a visiting researcher to pour the probiotics (or powdered sugar control) into mason jars, labeling them A, B, or C.
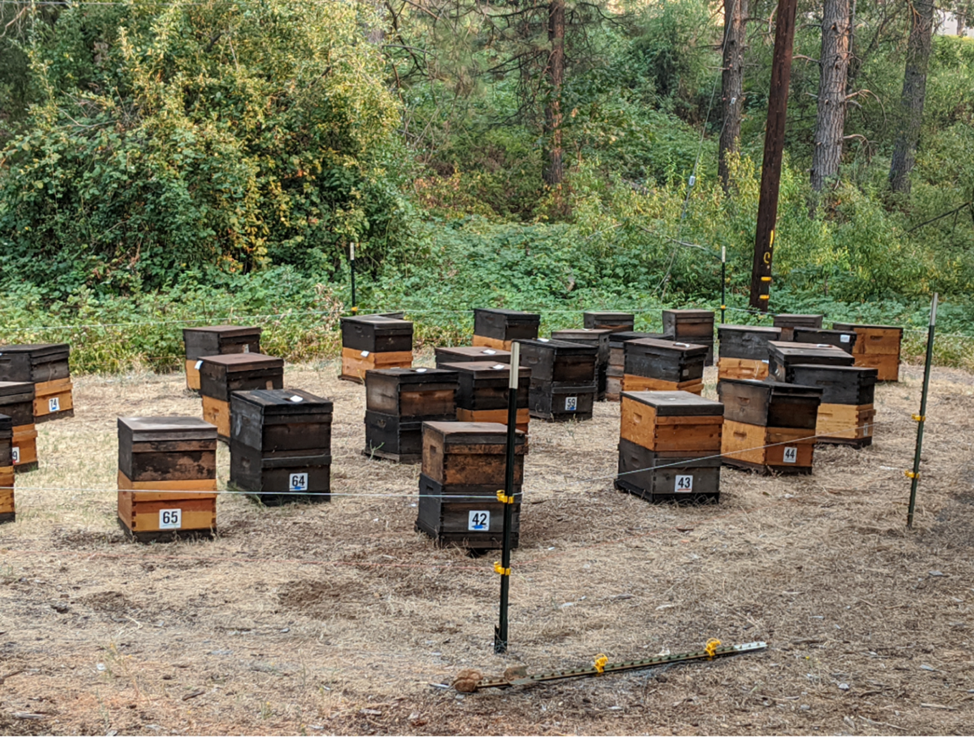
Fig. 3. The sunny yard. To eliminate any possibility of bias, we blinded ourselves as to which treatment was which.
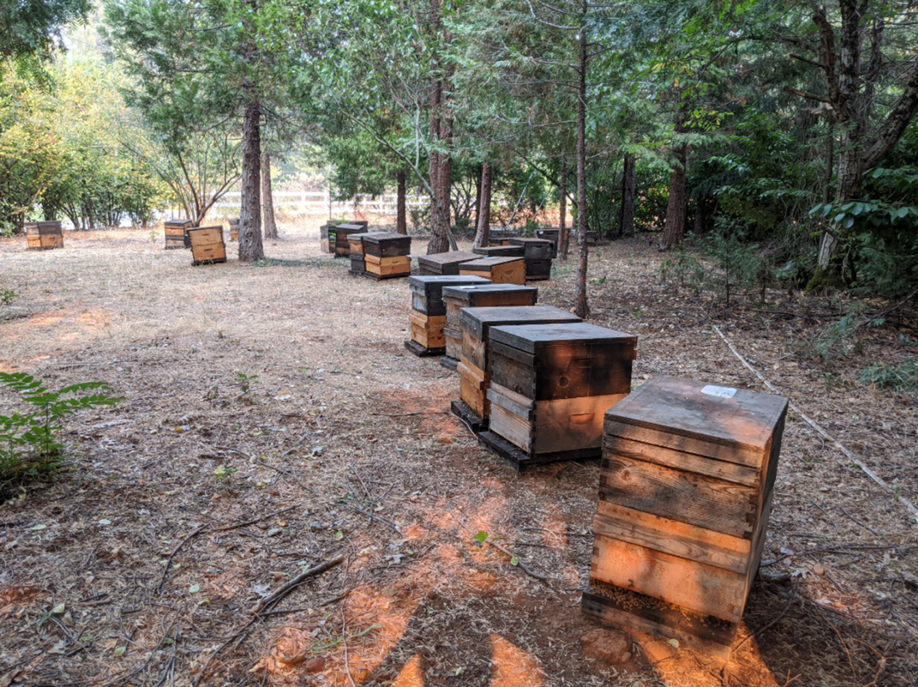
Figure 4. The shady (and cooler) yard. This yard receives a flow of cedar honeydew in late summer. We expected the colonies to grow in strength during the trial, but most didn’t, apparently due to drought and hot weather.
At the start point on July 2, we graded for pretreatment cluster strengths (Figure 5) and hive weights (Figure 6).

Fig. 5. We perform grading for strength early in the morning (or on cool days) before the clusters have broken, looking between the frames of each box from both top and bottom. My grandson Ryder was schooling online due to covid, and proved himself to be a first-rate recording field technician throughout the trial, making sure that all data was correctly entered, and that every hive received the correct feeding.
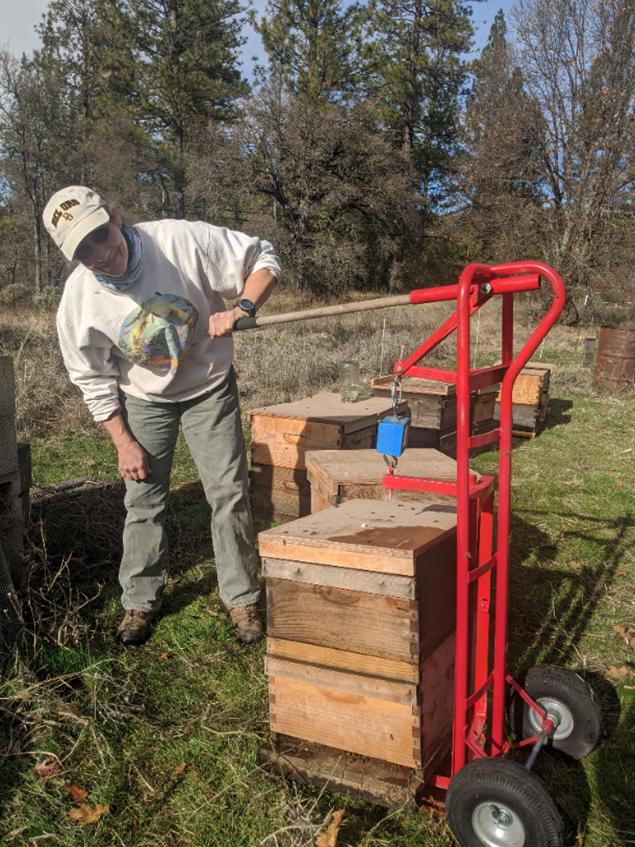
Fig. 6. Another technician who helped me greatly was beekeeper Alice Dunbar, here showing the custom hand truck that I welded together for quick and accurate weighing. The blue digital crane scale weighed each hive to the tenth of a pound.
We also took samples of ~50 bees from a brood comb from every colony and immediately froze them on dry ice (Figure 7) for next-gen sequencing of the gut microbiota to be performed by our collaborator — the Anderson Lab at the USDA Carl Hayden Bee Lab.
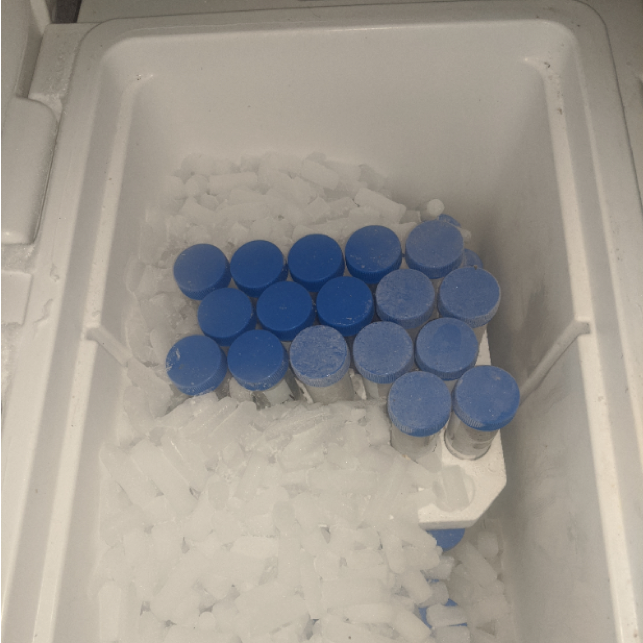
Fig. 7. We placed samples of ~50 bees into plastic tubes, immediately packed them in dry ice, and then shipped them overnight (at great cost) to the USDA lab for later analysis.
Once initial grading and sampling was completed, we dry-fed the probiotic treatments at the manufacturer-recommended rate of one tablespoon per month, sprinkled over the top bars of the lower brood chamber the first week of each month (four applications in all) (Figure 8).
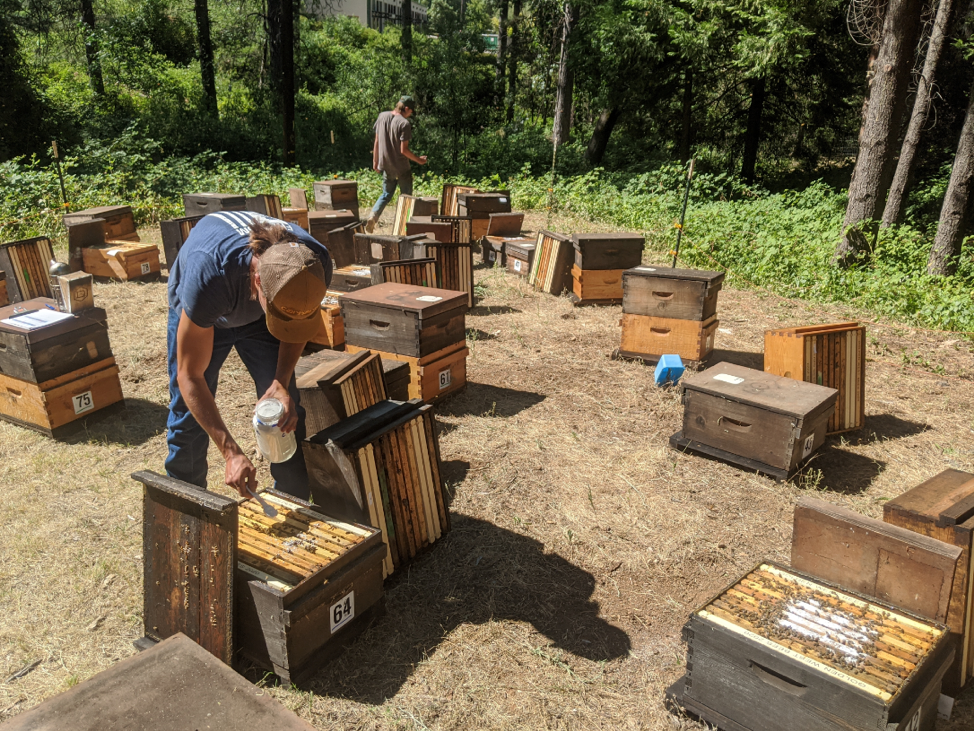
Fig. 8. The first feeding. All colonies had been set up as singles, above which they received a box with 6 empty drawn combs and two combs of foundation. They were set up this way so that there was enough room for them to store any late honey plus sugar syrup, without needing a third box. We color coded the hives and probiotic jars to avoid misapplication of the white powders.
The trial intentionally spanned the stressful summer dearth period, so the colonies were supplementally and equally fed an artificial diet of pollen subs (Healthy Bee, followed by Mann Lake Bulk Soft) and 1:1 sugar syrup in addition to the minor natural pollen flows over the next four months. By the end of the trial, the colonies had largely filled the upper brood chambers with honey, honeydew, and sugar syrup “honey.” Throughout the trial, we monitored varroa infestation rates, and used extended-release oxalic acid to keep mite counts below the 1% level.
We repeated the grading, weighing, and sampling for endpoint results on November 4 & 5, as the bees were ramping down broodrearing prior to winter.
Results
Rather than bury you in means and statistics, I’ll show the actual raw data for each group of hives below (Figures 9 – 14). Unfortunately, the results were a bit disappointing.
Change in Colony Strength
Due to unusually hot and dry weather, most colonies did not increase in cluster size, although part of that was due to grading them during much cooler weather in November. Of interest is that there was scant correlation between starting and ending strengths — indeed, the stronger the colony at the start, the more they tended to shrink by November (Figure 9).
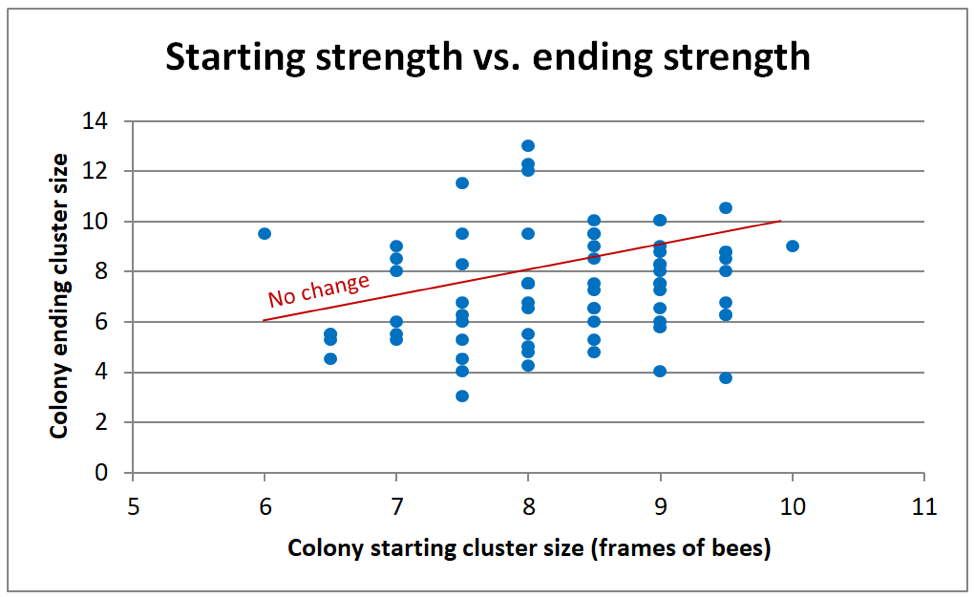
Fig. 9. I added a “no change” line to help to see that the stronger the starting strength, the more likely a colony shrunk in size by November (compare the number of data points above or below the line). I have no idea why, but we observed the same thing in another field trial that I ran in other yards at the same time.
But our question is, did the feeding of a probiotic lead to larger cluster sizes (indicating healthier colonies) going into winter? I’ll let you decide for yourselves from the graphs below. Here’s the raw data of absolute change in strength for each colony (Fig. 10a).
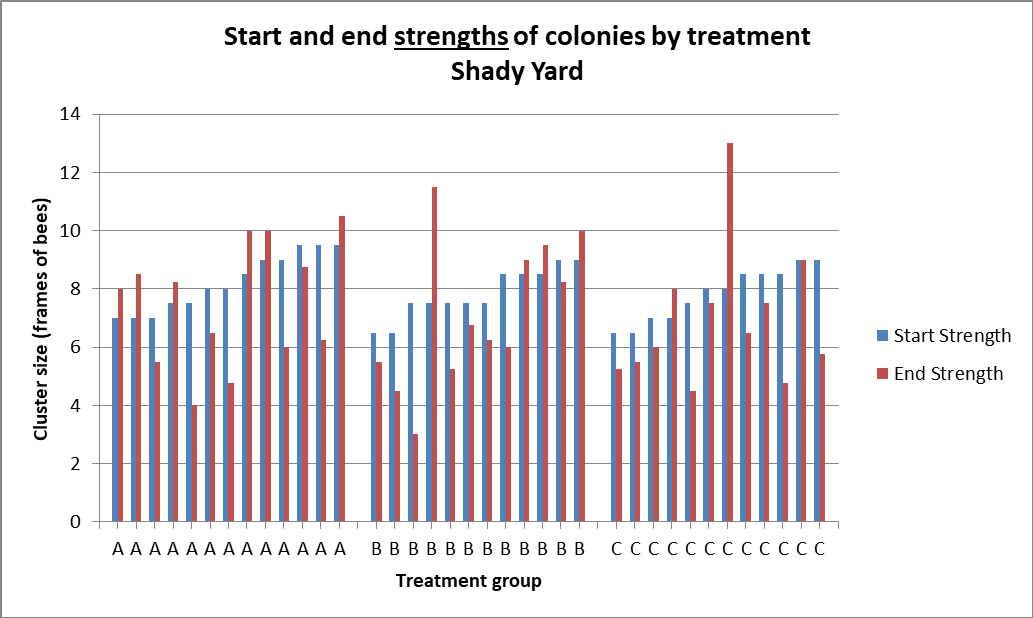
Fig. 10a. Starting strengths of each colony are in blue, ending strengths in red, hives sorted by starting strength. Compare the differences, by group, in the heights between the tops of each pair of columns, which indicates the change in strength. There was no statistical difference between treatment groups in change in colony strength in the shady yard (Kruskal – Wallace p = 0.89), or absolute strength (p = 0.67).
Since the colonies started at different strengths, the best way to compare changes might be to compare the distributions of relative changes in strength by dividing the ending strength by the starting strength (Fig. 10b).
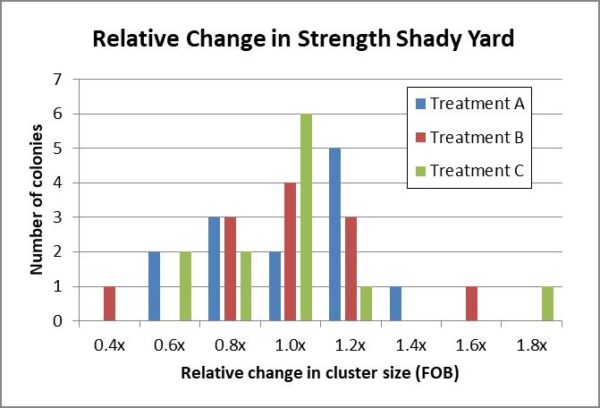
Added: Figure 10b. Histograms of the distributions of relative changes in strength by the colonies for all three test groups in the shady yard appeared to fall into similar normal curves.
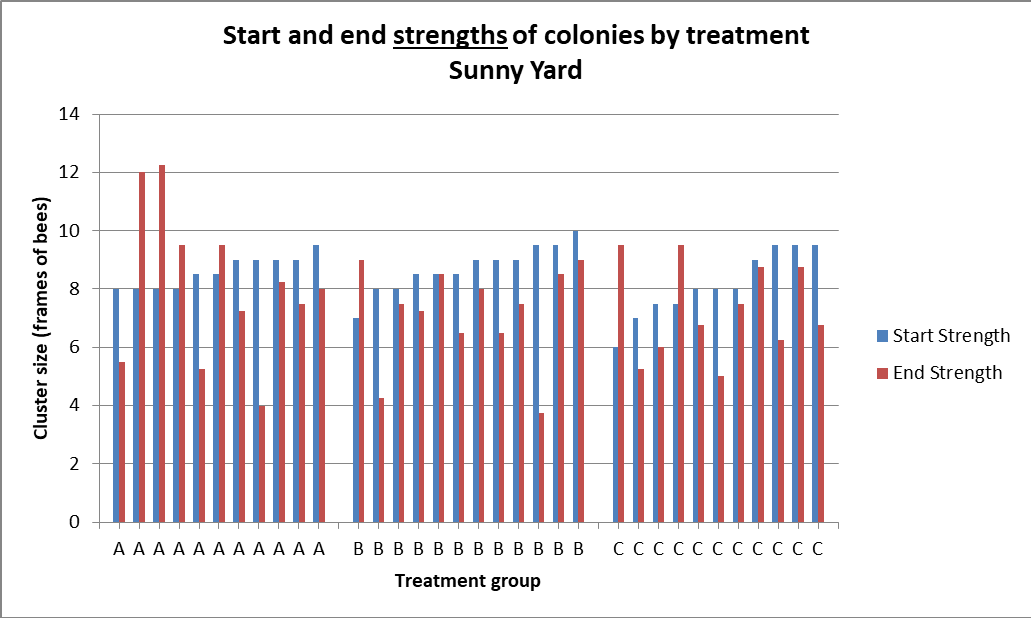
Fig. 11a. There was no statistical difference between treatment groups in change in colony strength in the sunny yard (Kruskal – Wallace p = 0.88) nor absolute strength (p = 0.66).
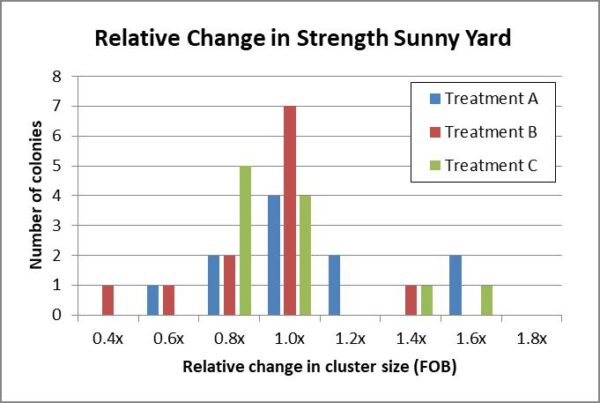
Added: Figure 11b. Historgrams of the relative changes in strength by the colonies in all three test groups in the sunny yard also appeared to fall into similar normal curves.
Practical application: The data from this trial unfortunately do not support the claim that the feeding of either of the probiotics resulted in stronger colonies.
Change in colony weight
Between the natural nectar and honeydew flows, plus some supplement feeding of equally-fed sugar syrup, every colony put on weight, with a median gain of nearly 27 lbs. Not surprisingly, the colonies with the largest ending strengths tended to put up more stores (Figure 12). But did the feeding of a probiotic increase weight gain?

Fig. 12. The colonies that were stronger at the end point tended to have put on more weight, but the correlation was slight.
But did the feeding of either of the probiotics result in greater weight gain? Again, see for yourself.

Fig. 13a. There was no statistical difference between treatment groups in weight gain in the shady yard (p = 0.73).
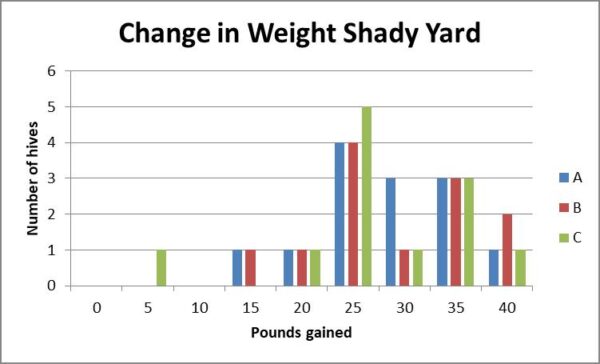
Fig. 13b. The number of pounds gained by hives in the shady yard appear to exhibit similar normal distributions.

Fig. 14a. There was no statistical difference between treatment groups in weight gain in the sunny yard (Kruskal – Wallace p = 0.35).
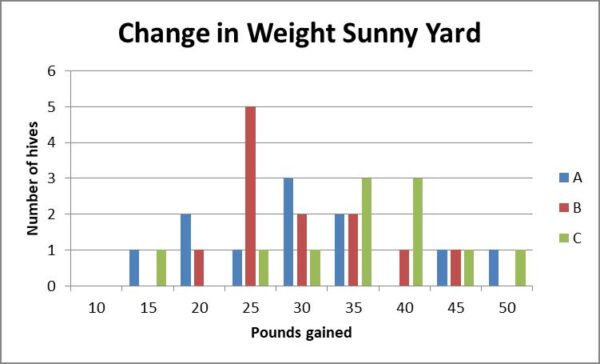
Fig. 14b. The distributions of weight gain by hives in the sunny yard, although not significantly different, suggest that Treatment C may have resulted in somewhat more weight gain in this yard.
Practical application: The data from this trial unfortunately do not support the claim that the feeding of either of the probiotics resulted in stronger colonies.
Discussion
The data collected unfortunately does not support the claim that monthly feeding of either tested probiotic resulted in a measureable benefit in either colony strength or weight gain, compared to the monthly application of the powdered sugar control.
That said, there is still the possibility that the probiotics caused other effects (beneficial or not), upon the gut microbiomes. Below are the remaining questions to be answered by my collaborator — the USDA-ARS Anderson Lab.
- Do any of the applied bacterial strains establish in the bee guts?
- Does feeding of either probiotic affect the microbial community structure of the gut?
- Does feeding of either probiotic affect pathogens?
- Does feeding a probiotic help to restore the gut microbiome after treatment of the hive with the antibiotics oxytetracycline or tylosin?
In order to answer the last question, at the end of the trial, I subdivided each of the treatment groups into three, and applied an antibiotic to two of them, then reapplied probiotics, and took bee samples at three time points to track the recovery of the gut microbiomes. I will publish the results once the samples are analyzed.
Funding
This research (by a beekeeper, for the benefit of beekeepers) was funded by donations from individual beekeepers and beekeeping associations. Feel free to contribute at http://scientificbeekeeping.com/
citations
[1] Raymann,K,et al (2017) Antibiotic exposure perturbs the gut microbiota and elevates mortality in honeybees. PloS 470 Biol 15:e2001861.
[2] https://en.wikipedia.org/wiki/Probiotic
[3] Martinson, VG, J Moy, N Moran (2012) Establishment of characteristic gut bacteria during development of the honeybee worker. Appl. Environ. Microbiol. 78: 2830 –2840.
[4] Powell, JE, et al (2014) Routes of acquisition of the gut microbiota of the honey bee Apis mellifera. Appl. Environ. Microbiol. 80: 7378–7387.


