
A Comparative Trial of the Pollen Subs 2020: Part 3

November 4, 2021
A COMPARATIVE TRIAL OF THE POLLEN SUBS 2020
Part 3
Beekeeper-Funded Research
First published in ABJ September 2021
Randy Oliver
ScientificBeekeeping.com
Some research institutions avoid the testing of name-brand products for obvious reasons, and some trade magazines won’t publish articles that might offend their advertisers. We beekeepers are fortunate that Dadant & Sons and the American Bee Journal allow me to objectively write about products that they may produce or advertise. I maintain complete impartiality in my trials, and let the data speak for itself. My sons and I, who depend upon beekeeping for our livelihood, are just as interested in the results as are you my readers.
MOVING ON FROM THE MIDPOINT ASSESSMENT
Pretty much any artificial diet can be of benefit to the bees in the short term, but the real test is how it performs over the long term. I happen to live in a landscape that provides an extended dearth period (August through mid-January), thus allowing me to really put diets to the test in free-flying colonies.
Unlike in areas that provide an autumn pollen flow — which allow colonies to store pollen as beebread to provide for winter maintenance or late-winter broodrearing — there was virtually no fall pollen flow in my test yards, so there was an absence of stored beebread going into the winter.
Practical application: My previous article left off at the midpoint assessment, which served as a status report as to how the artificial diets had prepared the colonies for winter. Since bees don’t store patty-fed pollen sub in the combs, that means that the test colonies were nearly totally dependent on the tested diets for the development of the all-important fat bodies of the “winter bees.” And then the late-winter resumption of brood rearing would also be dependent upon the fed diets until the first tree pollens became available.
REINITIATION OF FEEDING AFTER THE WINTER BREAK
Let’s review the timeline of the trial (Figure 1):
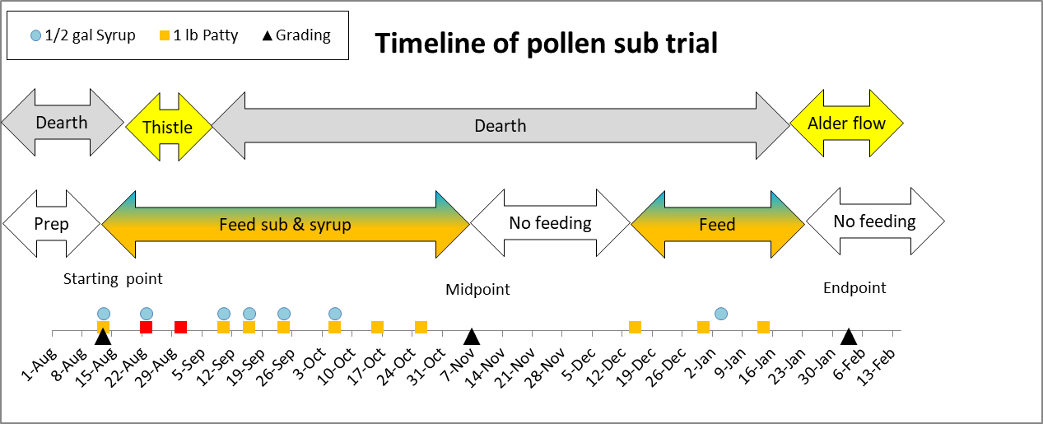
Fig. 1 The above chart shows the timings of feedings and gradings, as well as the occurrence of two natural pollen flows (the thistle flow occurred in only two of the yards; yard H received 2 feedings [red] during that time). We performed final grading prior to the emergence of any bees that could have developed during the alder flow.
Experimental design: This trial ran for 175 days (8 potential brood cycles), during which the predominant sources of food for each of the 144 colonies were the artificial diets (other than the surprise 10-day pollen flow from thistle in two of the three test yards).
RESUMPTION OF FEEDING
As the weather cooled in early November, the test colonies went into winter cluster and ceased rearing brood. They consumed the last of their fed sub the first week of November. After a month in winter cluster, temperatures warmed enough for the bees to start flying again, so we resumed feeding on December 15.
At that time there was considerable disparity in colony strength (largely correlated with diet type), with the stronger colonies (not unexpectedly) consuming their fed patties more rapidly.
Experimental decision: Since the colonies in some treatment groups were stronger in December, these larger colonies, not unexpectedly, consumed more food. So rather than feeding all hives equally — which would have limited the expansion of the stronger colonies — we checked weekly, and gave each colony as much patty as they could consume. Instead of removing and weighing any as-yet-unconsumed patty, we simply recorded how much they ate until final grading (Figure 2).
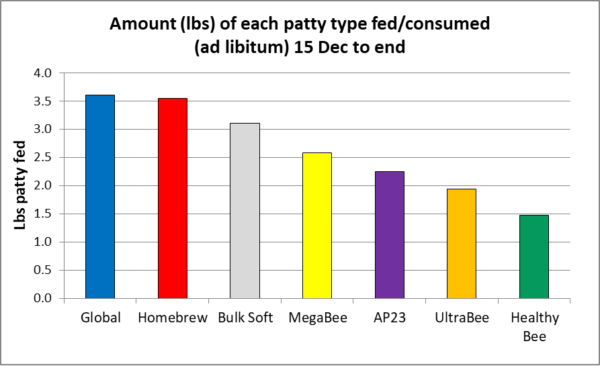
Fig. 2 The reason that I run feeding trials over the winter, is that you really see the results when the colonies start to grow again as the weather warms (in this case, starting in mid-December). Unlike patty consumption during summer, the amounts consumed during late-winter buildup appeared to be mostly a function of colony strength, with the larger, faster-growing colonies consuming greater amounts of the fed diets.
Practical application: Unlike the general lack of relationship between August colony strength and November strength (see Figure 2 in the accompanying article), there was a clear correlation (R2 = 0.38, not shown) between November cluster size and the February grading for colony strength.
RESULTS: LATE-WINTER BUILDUP PRIOR TO ALMOND POLLINATION
The interval between our reinitiation of feeding and the start of the alder bloom gave the diets three weeks to influence colony buildup before the first natural pollen became available. This is an important consideration with regard to field trials of pollen subs, as pointed out by Stanger and Laidlaw [[1]] back in 1974:
Therefore, this work indicated that there is value in feeding during October through January preceding the almond bloom in California to provide colonies with greater populations for more effective almond pollination, but that feeding of pollen, pollen supplements, or pollen substitute is not beneficial after the spring pollen flow begins.
Practical application: I found the same in my field trial of pollen subs in 2013 [[2]]. So by performing final grading at 20 days after the commencement of the alder pollen flow, we’re able to tease out the benefit of artificial feeding before it was affected by the occurrence of the pollen flow (since no workers that might have benefitted from the alder flow would have had time to emerge and affect the cluster size).
Comparison between November and February cluster sizes, by diet type
Every beekeeper notices that there is generally a large colony-to-colony variation in performance in any group of hives, and this field trial was no exception. But looking at average values for each test group does not tell the whole story. So rather than giving you a bunch of means and standard errors, allow me to present the raw data for all 133 hives still alive at the end of the trial, color-coded by diet type, comparing each colony’s February strength to that at the November grading. Take some time to look at the distribution of the colored data points for each diet type (Figure 3).
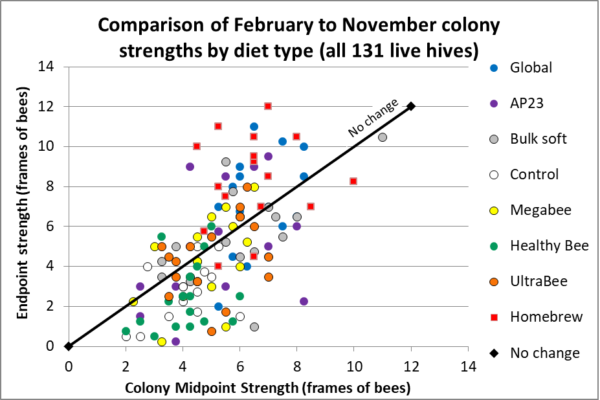
Fig. 3 Cluster size in February relative to that in November (many data points overlap); the trendline indicates no change in strength: colonies that grew are above the black trendline, those that shrunk lie below. In every diet group there were good and poor performers. Focus upon the vertical distances of the data points above or below the “No change” indicator line. On average, the Homebrew and Global colonies grew in strength — the rest of the diet groups had colonies scattered above and below the line during this expected buildup period.
Practical application: Colony growth prior to almonds had a lot to do with overwintering cluster size. Colonies to the left (indicating a smaller winter cluster size) were in general unable to increase in strength to any extent during the buildup period (as indicated by their data points being below the line). On the other hand, those that went into winter with slightly larger clusters (to the right) were often able to grow rapidly (their data points being well above the line), notably some individual hives from the Homebrew, Global, AP23, and Bulk Soft diet groups. I suspect that such vigorous growth also indicated a greater nutritional value of those diets.
Note that the above results may sound contrary to those of the widely-cited study of late-season pollen supplementation by Mattila and Otis [[3]]. That study was performed in an area in which there was a strong autumn pollen flow — a completely different situation than that in many areas of California. In this field trial, the colonies benefitted both from autumn feeding (which allowed them to go into winter with a larger cluster size), as well as from late-winter feeding (similar to the findings of Mattila and Otis in another study [[4]]).
Colony survival
No colonies suffered “Colony Collapse” due to inadequate varroa management. Fewer than 3% of these often-stressed hives exhibited “queen failure” over the course of a nearly 6-month trial. The total colony loss rate was 9% (Figure 4).
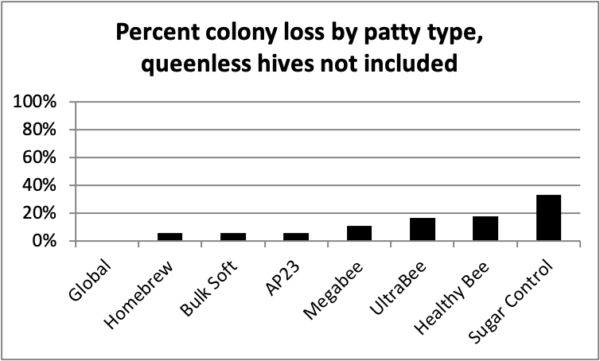
Fig. 4 Only one colony had perished by the midpoint. At the final February grading, I defined a “colony loss” asthose either having died other than due to going queenless, or still queenright but with less than one frame interspace filled with bees (3 colonies).
Practical application: Not surprisingly, colony loss correlated closely with overall colony performance by diet type.
RESULTS OF 1 FEBRUARY GRADING
Changes in colony strength over the long term
From our standpoint, what makes us money are the number of frames covered with bees (cluster size) when we rent the hives for almond pollination. So let’s see how the colony cluster sizes tracked for each diet type, in each of the three test yards, over the entire six-month course of the trial.
Practical application: This will allow us to see whether the results were consistent from yard to yard.
In order to avoid any bias in censoring colonies that went queenless or had other health issues, for each yard I simply censored out an identical number of the poorest-performing hives from each treatment group.
Yard E
This is the same yard in which we ran last year’s pollen sub trial, so we didn’t expect the brief nectar and pollen flow from star thistle in early August (Figure 5). In any case, we stocked this yard the most heavily (72 hives), so that the colonies would be strongly competing for the scant amount of natural pollen coming in from the landscape in late summer and fall.
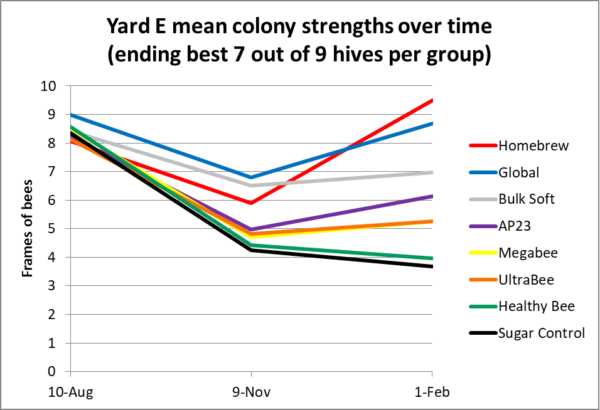
Fig. 5 As expected, the sugar-fed Control colonies went downhill, thus confirming the benefit of feeding pollen sub under these conditions. The benefit of November cluster size is apparent, allowing the larger clusters to grow more rapidly during late-winter buildup (compare the pitches of the upward slopes). Only the Healthy Bee and Sugar controls were unable to grow.
Yard T
The second replicate, Yard T, was a similar-elevation yard in which colonies had performed poorly the last two years. We placed 40 hives there (Figure 6). This yard also enjoyed the brief star thistle pollen flow.
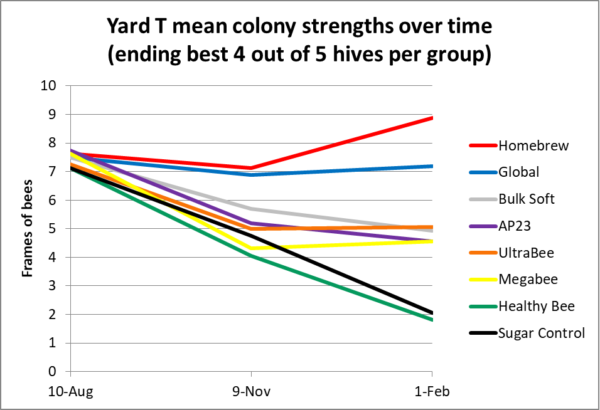
Fig. 6 Similar to Yard E, the importance of winter cluster size was apparent. Homebrew hives took off, with Global lagging a bit in this yard. Note how badly the Healthy Bee and Sugar Controls plummeted in strength.
Yard H
For the third replicate, I placed 32 hives in my higher-elevation home yard (Figure 7), competing with a bunch of other experimental colonies. Our home yard hives really benefit from the feeding of pollen sub, and did not have the benefit of an August pollen flow. This yard got fed when the other yards still had unconsumed sub on them.
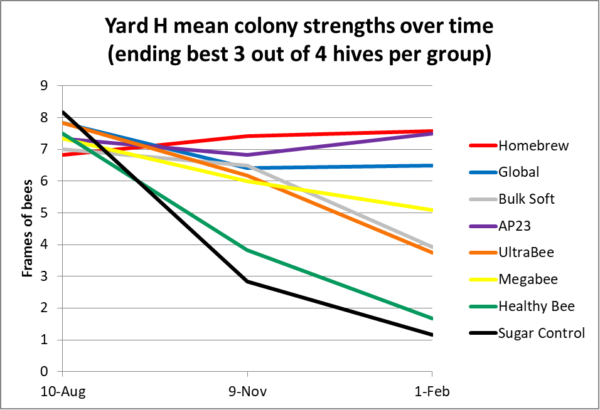
Fig. 7 Yard H was the most nutritionally stressed — the Sugar Controls and Healthy Bee colonies nosedived, with half of the Control colonies dwindling to death. The yard did not benefit from the August star thistle pollen flow, but was fed an additional 2 lbs. of pollen sub instead. Overall, there was less August-November loss of strength compared to the other yards, but conversely, less gain during late-winter buildup (Homebrew, AP23, and Global at least held their own). Despite the overall lack of colony growth, compare the striking difference in performance between the best diets and the poorest.
Practical application: The relative performances of the diets were remarkably consistent from yard to yard, indicating that we can draw conclusions from the data. The take home message appears to be that some diets consistently outperformed others. The better diets allowed some groups to go into winter with heavier bodies and larger winter clusters, thus setting them up with the ability to build up more rapidly upon recommencement of late-winter feeding, dependent again upon the nutritional value of the diet fed.
Additional graphs
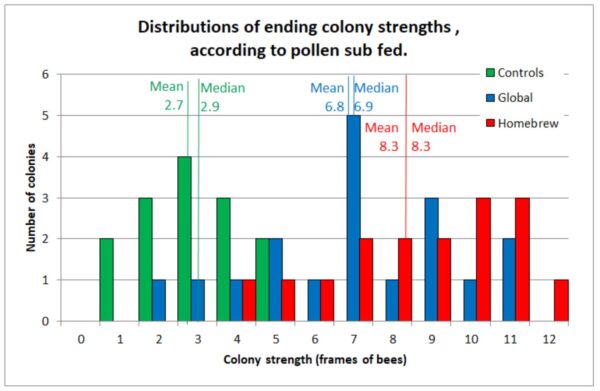
Histograms of ending colony strength distributions for Controls vs Global and Homebrew.
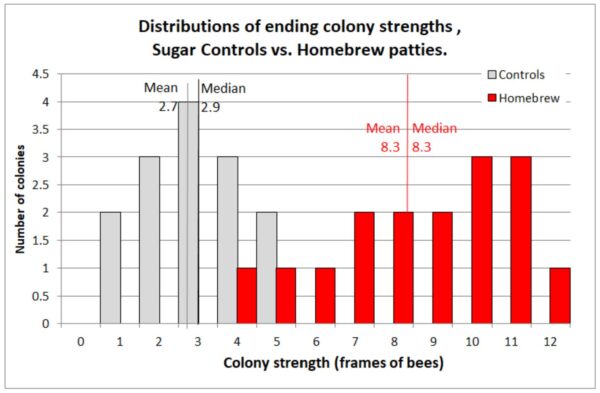
Histograms of ending colony strength distributions for Control vs Homebrew alone.
COLONIES MAKING GRADE FOR ALMONDS
I broke down the colony strength assessments to see how many hives in each test group of 18 made at least 4.5-frame strength on 1 February — assuming that since they had plenty of sealed brood after the alder bloom, that they’d grow to at least 6 frames by grading date in the orchards (Figure 8).
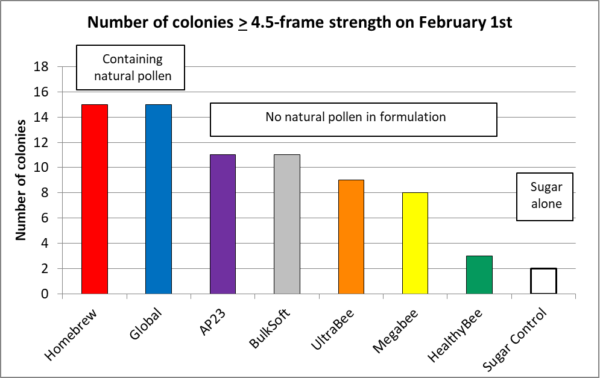
Fig. 8 This year our colonies across the board were weaker than normal; those in the pollen sub trial were no exception. From the above data, one might conclude that pollen sub performance is all about whether they contain natural pollen, but in my next installment I’ll show that that may be mere coincidence.
Practical application: After nearly six months on artificial diets, only 2 out of 18 colonies in the Control group made 5-frame strength come February, compared to 15 out of 18 in the best-performing diets. Although this trial was run in an environment having a short and relatively warm winter, it clearly shows the benefit of nutritional supplementation.
In a number of our almond pollination contracts, we get paid by colony strength, based upon the grading of 10% of the hives. Our minimum required cluster strength for any hive is 5 frames of bees. If the graders hit a hive weaker than that, we don’t get paid for 10 hives, so we generally don’t bother to take any weak hives down to the orchards. But, as with many Western beekeepers, we were tight on strong colonies this year, and hauled down anything that in early February looked as though it would grow to at least 6 frames by grading time. Prior to grading, we popped open all of our hives, and boosted any weak ones (Figure 9).
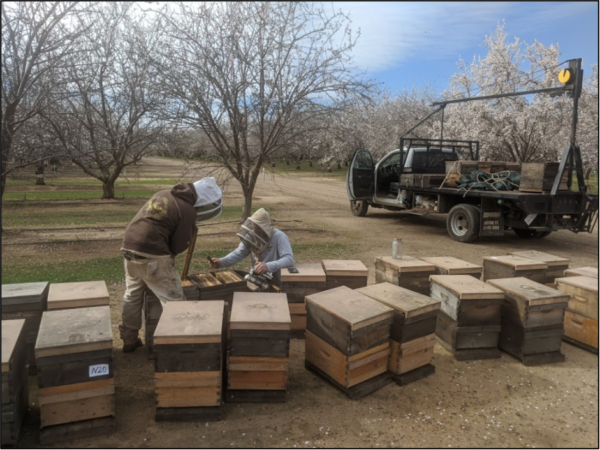
Fig. 9 Eric and Ian, in advance of grading, are boosting weak colonies with frames of bees from the strongest hives (which keeps them from swarming). When we’re getting over $200 per hive, we figure that it’s worth the labor.
OVERALL PERFORMANCE
In light of the above, perhaps the most straightforward way to evaluate the performance of the artificial diets would be to simply add up how many rentable frames of bees in total we got from the 18 hives in each test group (Figure 10).
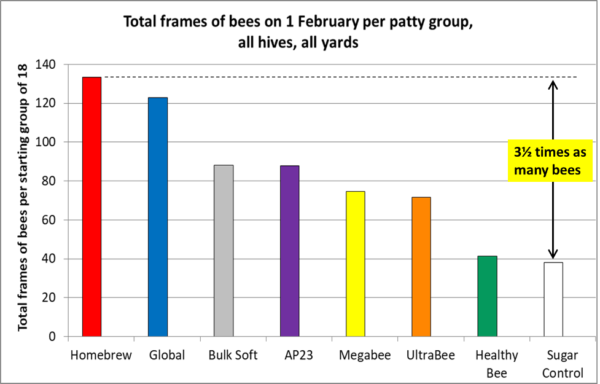
Fig. 10 Our income is based upon how many frames of bees (FOB) we can rent in almonds and then later sell as nucs. There were 133 rentable FOB in the 18 hives in Homebrew group, compared to only 38 frames in the Controls.
Practical application: The 133 FOB in the Homebrew group earned us $3,242 in almonds, whereas the 38 FOB in the Control group returned only $804. I did the math for a cost-benefit analysis; the better subs returned around $5 (above the Control group) in almonds for every dollar spent on the patties. But that was not counting labor, which in this case was excessive, due to the twelve feedings. In practice, we typically feed 2½-lb. patties two to three times.
THE TAKE-HOME
Many Western almond pollinators move their colonies to better pasture during summer (as did I for 20 years). But such pasture is getting harder to find (especially during our prolonged drought). So in order to build our colonies up for almond pollination, some of us depend upon feeding pollen subs (artificial diets). But I realize that not every beekeeper pollinates almonds, or experiences pollen dearths. It’s up to the beekeeper to decide whether it is cost-effective to feed pollen sub in their operation.
Anyway, this trial was not about trying to convince anyone to feed pollen sub, but rather to compare the nutritional values of the artificial diets on the market.
It’s not about “winners” vs. “losers”
I have trepidation about running this sort of “Consumer Report” trial of the products of different manufacturers, with whom I like to maintain friendly relationships (and who I respect for cooperating with me on this trial). During the course of the trial I lamented to my helpers that if it looked as though there was only one “winner,” then that might imply that the other seven products were “losers.”
Practical consideration: This trial was about the long-term feeding of artificial diets. For those who wish to feed only a round or two of pollen sub, any nutritional deficiencies may not be apparent in the short term.
I certainly wasn’t aiming to embarrass any manufacturer, and was surprised by the comparatively poor performances of two of the subs. In my previous testing (controlled and informal), Ultra Bee ranked very high (although in our own operation we prefer its sister product, Bulk Soft). One possibility for the change is that the manufacturer recently switched one of the ingredients (I asked, since we noticed the difference in appearance). As far as Healthy Bee, I strongly suspect that the high level of thyme oil in the formulation that I tested was a problem. Both manufacturers are addressing the issues.
As I’ve said, my sons and I spend a lot of money on pollen sub, and we just wanted to see whether there were appreciable differences in performance between the products on the market. To do so, we fed the test hives for nearly six months on the artificial diets, in order to see whether any nutrient deficiencies might become apparent. We weren’t rooting for any particular products, and our findings are hardly the last word. But what we did find is that the performances of the subs, relative to each other, were fairly consistent from yard to yard, and that some diets outperformed the others. So the Big Question is, why?
COMING NEXT
Next month I will delve into the nutritional analysis of the subs. The two top performers had something in common other than having natural pollen in their formulations. I’ll show how we perhaps might have predicted their performance from their analyses. But most importantly, for the benefit of manufacturers and beekeepers anywhere, I’ll provide a handy calculator in the hope that everyone can improve their pollen sub formulations.
ACKNOWLEDGEMENTS
This research was funded by donations by beekeepers, which allow me to perform these expensive field trials. And we should all thank the manufacturers for donating the patties for the trial. I thank all for their support! I also wish to thank beekeeper Peter Borst, who assisted me greatly in library research.
REFERENCES
[1] Stanger,W & H Laidlaw (1974) Supplemental feeding of honeybees (Apis mellifera Linnaeus). Am. Bee J. 114: 138 -141.
[2] http://scientificbeekeeping.com/a-comparative-test-of-the-pollen-sub/
[3] Mattila, HR & GW Otis (2007) Dwindling pollen resources trigger the transition to broodless populations of long-lived honeybees each autumn. Ecological Entomology 32: 496–505.
[4] Mattila, HR & GW Otis (2006) Influence of pollen diet in spring on development of honey bee (Hymenoptera: Apidae) colonies. J. Econ. Entomol. 99(3): 604-613.


