A Comparative Test Of The Pollen Subs (Part 1 & 2)
A Comparative Test Of The Pollen Subs (Part 1 & 2)
Part 1: Experimental Design And Execution
Randy Oliver
ScientificBeekeeping.com
This article was originally published in the July – Sept 2014 ABJs
Introduction
The growth and health of honey bee colonies is primarily dependent upon the availability of high-quality pollen. Pollen and its fermented form, beebread, is the colony’s primary source of protein, lipids, vitamins, minerals, and sterols [1].
When there is a dearth of quality pollen, colonies suffer [2]. Broodrearing comes to a halt and the nurses may cannibalize eggs and larvae. Colonies stop growing or go downhill. Protein-starved colonies are unable to hold their own against parasites and pathogens; diseases set in. Inadequate protein nutrition in late summer and fall leads to poor wintering and colonies unable to make grade for almonds.
To mitigate the above problems during times of pollen dearth, beekeepers have long fed protein supplements (commonly called “pollen subs,” although none to date are truly complete substitutes for quality natural pollen). In recent years, successful beekeepers are spending more on pollen subs than ever before (I could not run a successful operation in my area without them). Due to this demand, a number of (ostensibly) improved pollen supplement formulas have recently come onto the market, but the formal testing of such [3] has been limited (and often involved those with a proprietary interest). So I decided to perform a Consumer Reports type of test to find out how the various products compare.
It occurs to me that the reader may be interested in the sorts of actual details and problems encountered in the design and execution of field trials. So instead of presenting this as a typical dry scientific paper, I’m writing this article as an expanded version of my log book in order to show what sort of thought processes go into a trial, how things often don’t go as planned, how exciting seeing positive results can be, and the decisions that the researcher must make in presenting and interpreting the data. I’m then going to follow this article with additional recent studies that I’ve done related to bee nutrition (as I write this, I’ve already begun a follow up trial).
2013/14 Pollen Supplement Trial
Principal Investigator: Randy Oliver, assisted by Eric and Ian Oliver
Funding sources: Independently funded by beekeeper donations to ScientificBeekeeping.com. Special thanks to almond pollinators contracting with Joe Traynor of Scientific Ag Company, and beekeepers Jeff Becker and Ray Olivarez, Jr.
Experimental Objectives:
- To determine whether colonies can be built up for almonds in late summer and over the California winter on artificial diet (sugar and pollen sub) without substantial natural forage available; that is, can today’s formulations substitute for natural pollen?
- To rank the commercially-available pollen supplements by their ability to promote colony growth.
- To determine the overall cost of building 5-frame nucs on foundation to almond pollination strength.
- To compare the attractiveness and consumption rates of the various pollen supplement formulas.
- To determine the cost effectiveness of the various subs at growing colony populations.
Experimental Design and Considerations:
I designed this experiment as an “acid test” of pollen subs by forcing colonies to build up their populations during a time when natural sources of pollen are inadequate. Based upon my 35 years’ experience in the Sierra Foothills, that condition typically occurs from mid August through December, during which time colonies not given protein supplement go decidedly downhill.
Then I had to consider which size and strength of colonies to use for the trial. Full-size doubles, having already reached maximum strength, would be poor indicators of the nutritional utility of the pollen subs for “growing bees.” In addition, large hives might contain reserves of beebread that could add a variable, they are difficult to accurately grade for strength, and must be disturbed to put the patties in contact with the broodnest [4]. The Coloss BeeBook [5] suggests starting with colonies on the order of 5-frame nucs to allow for a robust comparison of the effects of the treatments on growth rates. This sounded good to me, and I thought that I’d add new combs of foundation in order to minimize the variables inherent in drawn combs, such as pesticide residues, pathogens, or existing beebread.
I’d start with well-established nucs headed by recently-mated queens (mated in the same nuc). I’d feed the colonies with pollen sub patties and sugar syrup [6] to encourage them to draw out and occupy the frames of foundation, aiming to grow them into double deep hives (the use of foundation would allow room for the storage of the necessary stimulative syrup over a long period of time).
I’d grade the colonies for strength (using standard “almond grading” of cluster size) at various time points to quantify colony strength, with the final grading at almond bloom in February.
In order to minimize variables, I’d feed all the pollen subs as 1-lb standard patties in waxed paper. Syrup would be fed via inverted half-gallon feeder jars.
I wanted to test a variety of pollen subs from various manufacturers and a wide range of formulations, and came up with the following list (in alphabetical order, with their abbreviated names; formulations in Appendix):
- BeePro: from Mann Lake, as an example of a typical soy/yeast formulation long used by beekeepers [7].
- Experimental yeast (Yeast): Suggested by Mann Lake to test a yeast-based formulation recommended by beekeepers in the Midwest.
- FeedBee: A Canadian formulation sold in the U.S. and worldwide.
- “Homebrew” formula: my “everything but the kitchen sink” formula which included ingredients not found in the others, such as dried egg yolk, plant phytochemical extracts, Latshaw vitamin/mineral formulation, and corn/canola and coconut oils.
- Mann Lake experimental bulk (Bulk): developed as a cost-effective bulk sub to be chopped into chunks in the field.
- MegaBee (Mega): developed by Dr. Gordon Wardell, and carried by Dadant.
- UltraBee (Ultra): Mann Lake’s flagship product.
- Positive control of natural Calif foothill bee-collected pollen (Natural): mixed trapped foothill pollen from California beekeeper Jeff Becker, blended with sucrose and HFCS, and made into patty form (compliments of Mann Lake Ltd.).
- Negative control without protein supplementation (Negative): no patty given, but the same amount of sugar syrup as given the other groups.
Experimental considerations: There were other formulations that I considered testing, but most were similar to ones above. An exception was the patty produced by California beekeeper (and good friend) Keith Jarrett; after deliberation, he opted to pass on this particular trial. In hindsight, I wish that I had included it. I also contacted the developers of each product, and asked them for comments on feeding their products for optimum effect, since some had been unhappy with the design of other published trials.
A trial of this sort should include both positive and negative control groups, i.e., one receiving a treatment that you already know will give a measurable effect (natural pollen), as well as a negative control that receives no treatment. Technically, the Negative Control group should be fed a sham patty of moistened sugar alone to account for the effect of the sugar (roughly 50%) in the protein patties. On the other hand, the treatment of feeding protein patties adds a hive disturbance and potential bee-crushing variable that an unsupplemented hive would not normally receive. In the case of this trial, since I would be feeding sugar in the syrup (at least 3.25 lbs fed per each patty fed) far in excess of that in the patties (about 0.5 lbs per patty), I felt that a compensatory sugar feeding was unnecessary for the Negative Controls (in all hives, sugar was fed in excess of nutritional requirements, as indicated by the weight gains (not shown) of the colonies).
I wanted enough colonies in each group to be able to detect statistical differences due to treatment (type of pollen sub), so set up 18 hives for each treatment (162 hives total). As a general rule, due to the natural variability of colonies, a minimum of 12 hives should be in each treatment group in order to detect statistically significant differences.
Description of the (First) Experimental Apiary Location
This yard was located in a grassy clearing in an oak/pine habitat at a ranch at 2700-ft elevation in the Sierra foothills. The yard was chosen mainly due to its easy access for the multiple required feedings and for its uniform flat terrain. Its drawback was that it is on the outskirts of town, so there was some opportunity for the bees to forage on natural pollen. This drawback was partially offset by competition between the large number of managed colonies in this and two nearby apiaries of my own.
Abbreviated Experimental Log
Advance preparation: Mann Lake Ltd. prepared their own formulations, and generously volunteered to mix and prepare the Homebrew and Natural patties to my specifications [8], using ingredients that I shipped to them. I purchased MegaBee patties directly from Dadant. FeedBee patties were custom prepared to the manufacturer’s specifications by Global Patty [9]. A minimum of 360 lbs of patties (20 lbs per hive) was obtained for each group, and stored in a cool room (Fig. 1).
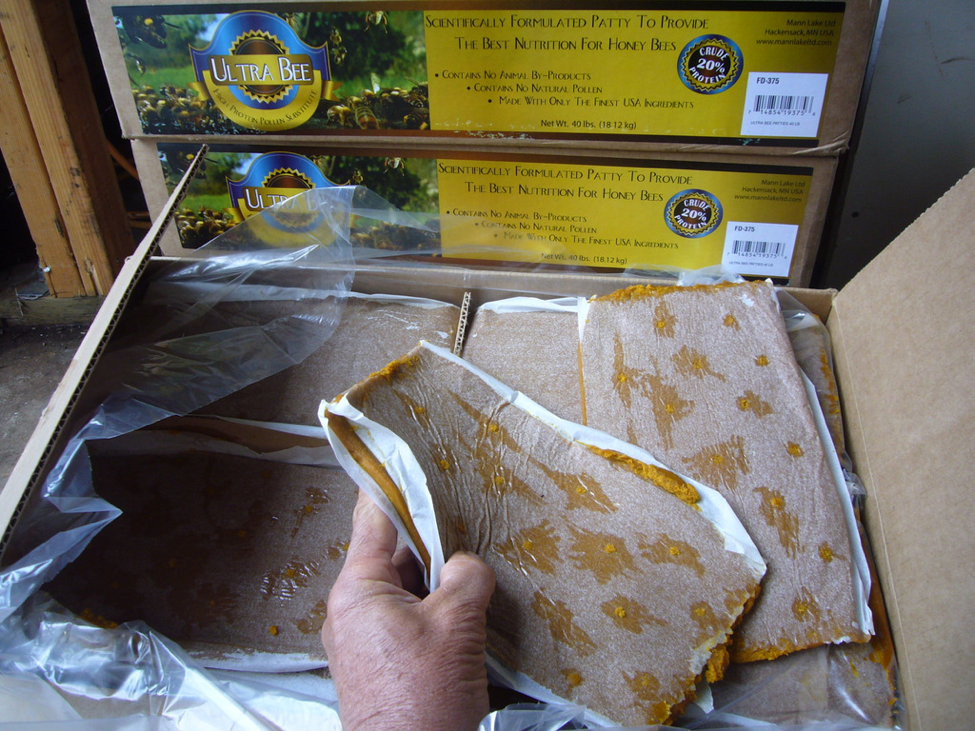 Figure 1. Typical product preparation of approx. 1-lb patties pressed between thin waxed paper.
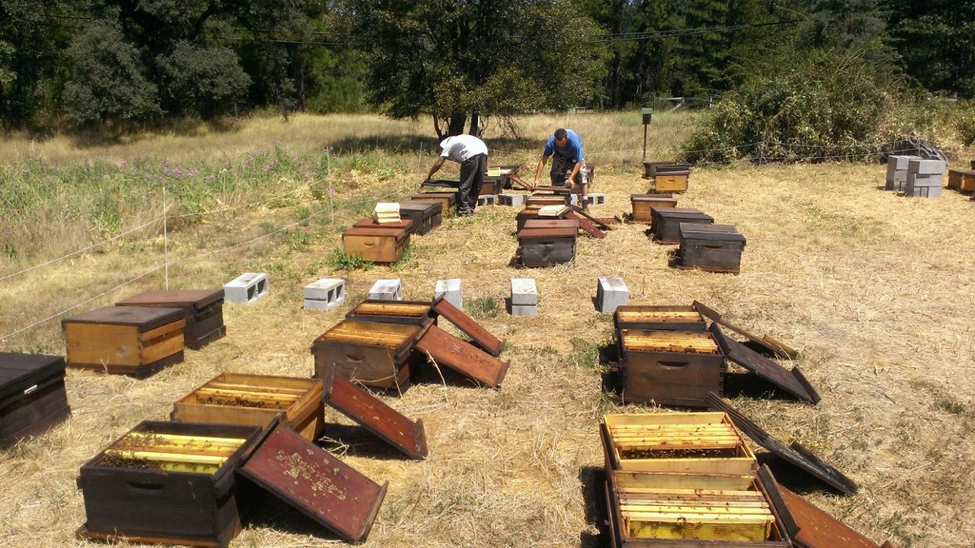
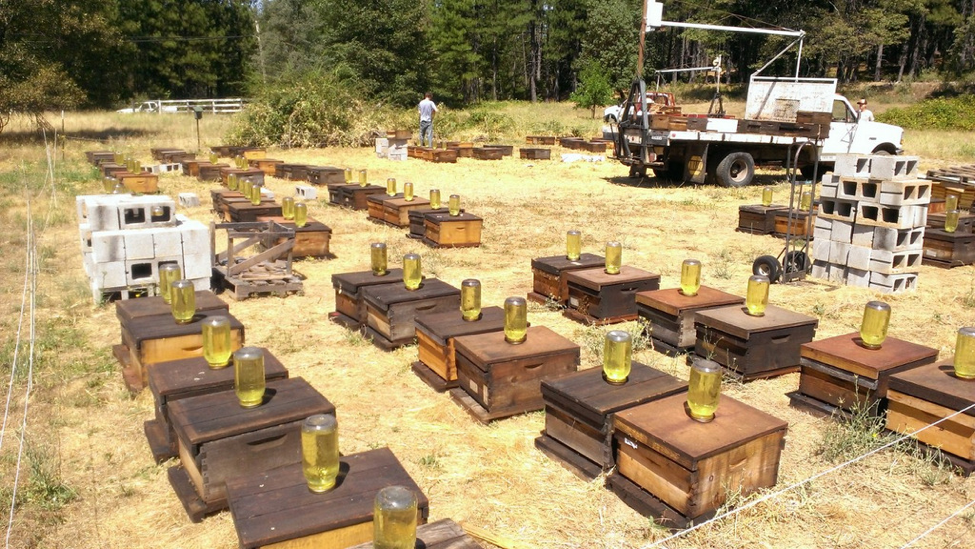
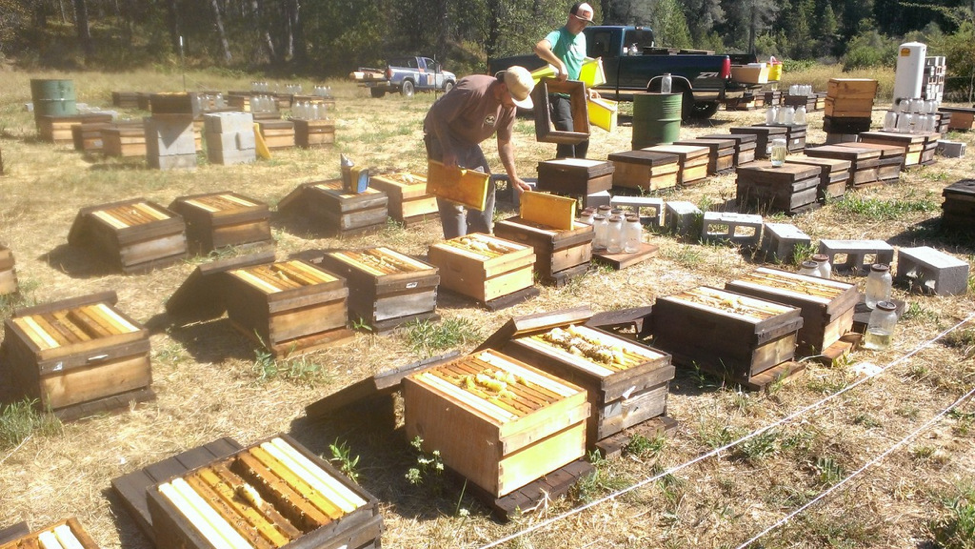
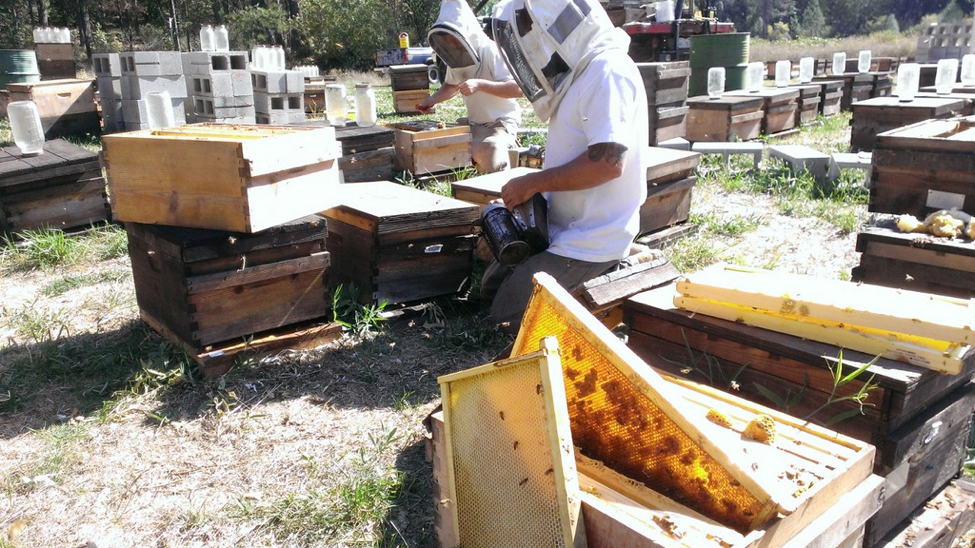
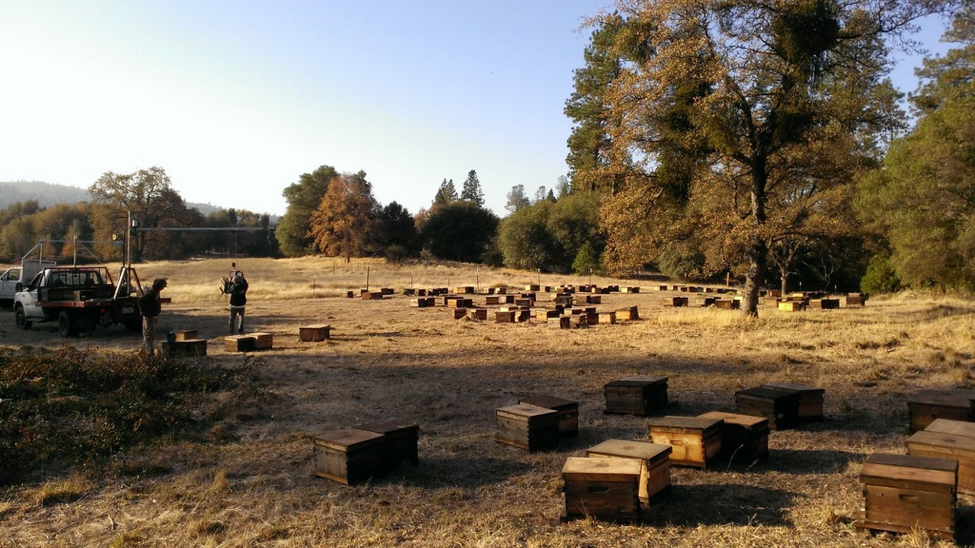
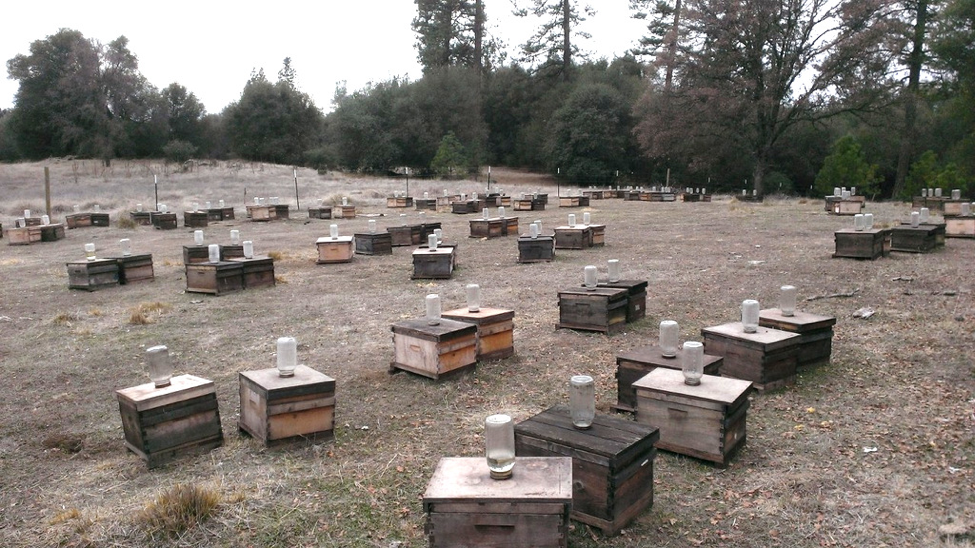
July 23-31, 2013 Set up 9 groups of 18 colonies in the test yard. Started with 5-frame nucs with new queens that had been laying for 2-5 weeks; nucs from various queen mothers distributed equally into all test groups. Laid out the 9 groups w/ all hives facing the same direction, each group separated by built landmarks (drums, cinder blocks, and pallets) (Fig. 2).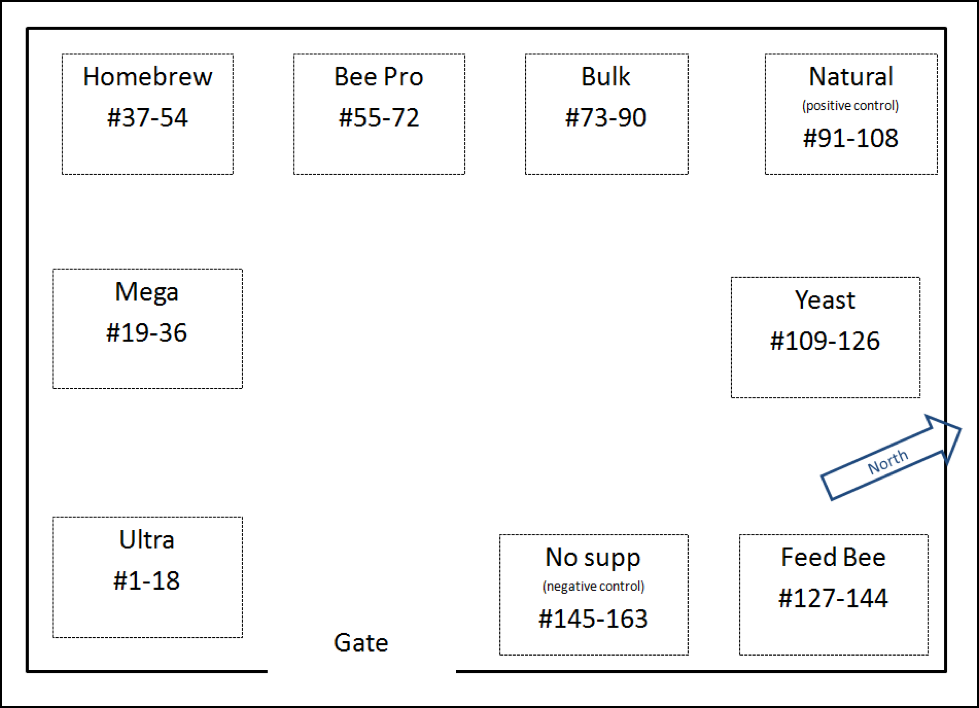
Figure 2. The layout of the hives in the initial test yard. Experimental consideration: The layout of the hives in a trial is a serious consideration, since one may inadvertently add a “location effect.” In this case, I was concerned about drifting from one hive to another (possibly due to the odor of the patties), and also with the logistical complication of getting all the repeated treatments applied without errors (feeding the wrong type of patty to a hive). So I decided to place each group of hives together (so that drift would likely remain within a group) and to add landmarks.
We checked all colonies for health and queenrightness, replacing any questionable ones. We worked all the nucs into singles containing only 5 frames, so as to be able to easily see the size of the starting cluster; we equalized all until the two visible sides of the outside frames were covered with a single layer of bees (Fig. 2). There was a light nectar flow on, and colonies started building small amounts of comb from the lids, so after equalization we added a frame of foundation to either side.
Figure 2. Equalizing colonies for starting strength. The outside combs of nearest colonies are lacking bee coverage, and would be boosted with additional bees until they were covered.
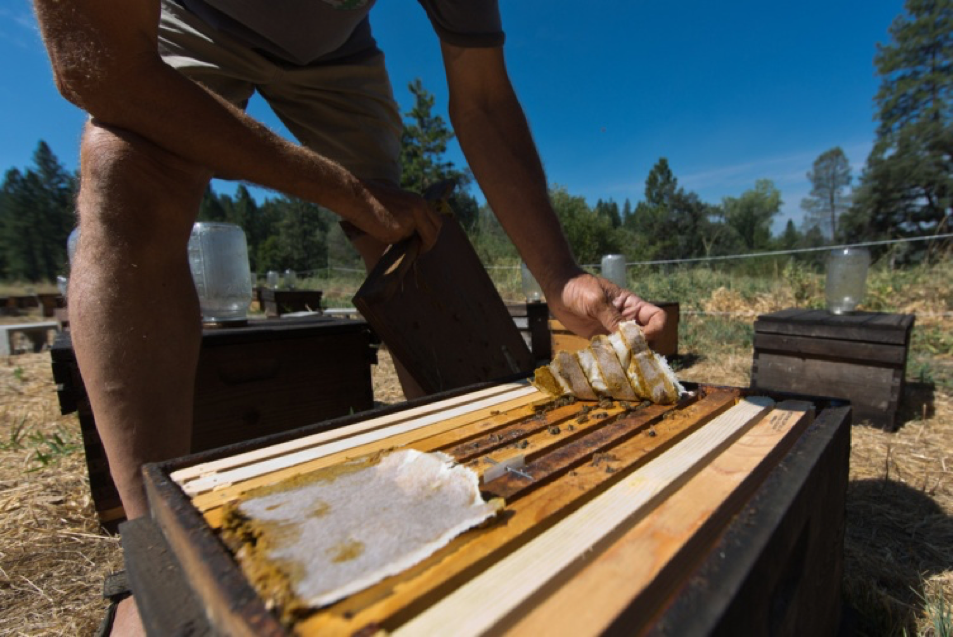
August 8—Time Point 0: Natural pollen flow nearly over, colonies slowing down broodrearing. No noticeable change in strengths. Assigned treatment groups by random number generator, and filled the boxes to 10 frames with additional foundation (Fig. 3). Feeding #1: fed each colony 1 patty plus ½ gal syrup (9:1 Pro-Sweet:water [10]).
Experimental considerations: Treatment groups should always be either randomly (not arbitrarily or haphazardly) or systematically assigned to avoid any inadvertent investigator effect.
I needed to control varroa infestation as a variable, but didn’t want to stress the nucs with my usual formic acid or thymol treatments. So I used (for my first time) 1 ApivarÒ amitraz strip hung in the center of each nuc, hoping to obtain a near complete mite kill by using this extended-release synthetic miticide. Since we’d also seen some EFB in the operation this spring, I also treated each colony with 1 Tbl Terra ProÒ OTC antibiotic (we observed no EFB during the course of the trial).
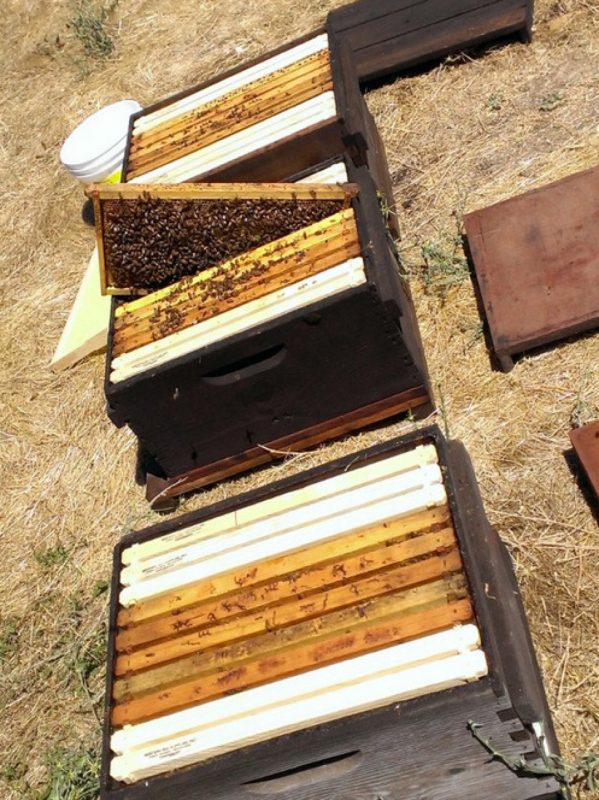 Figure 3. At Time Point 0, the colonies looked like this (the bees have been smoked off the top bars). I expected these nucs to quickly start growing, what with all the feeding. But that was not to be the case!
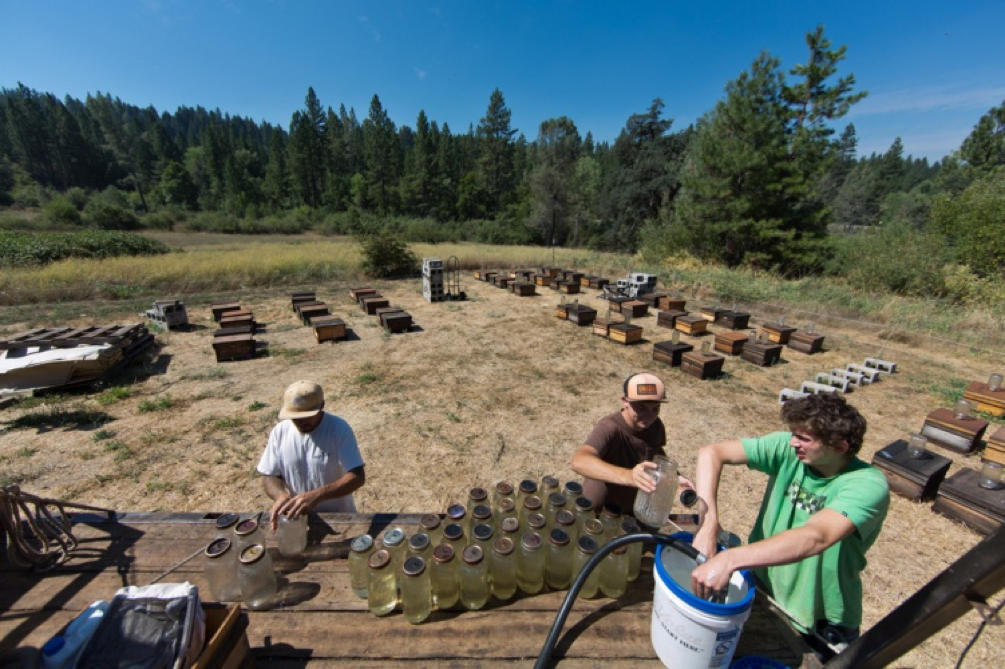
August 12-18: Four more feedings of ½ gal Pro-Sweet syrup diluted to 60% sugar. Queens laying well due to syrup stimulation, but little young brood. Still some natural pollen coming in. Initial feeding preference of patties was, in rough order, Natural, Feedbee, BeePro, and then the rest, with zero consumption of the Yeast patties (Figs. 4 – 7).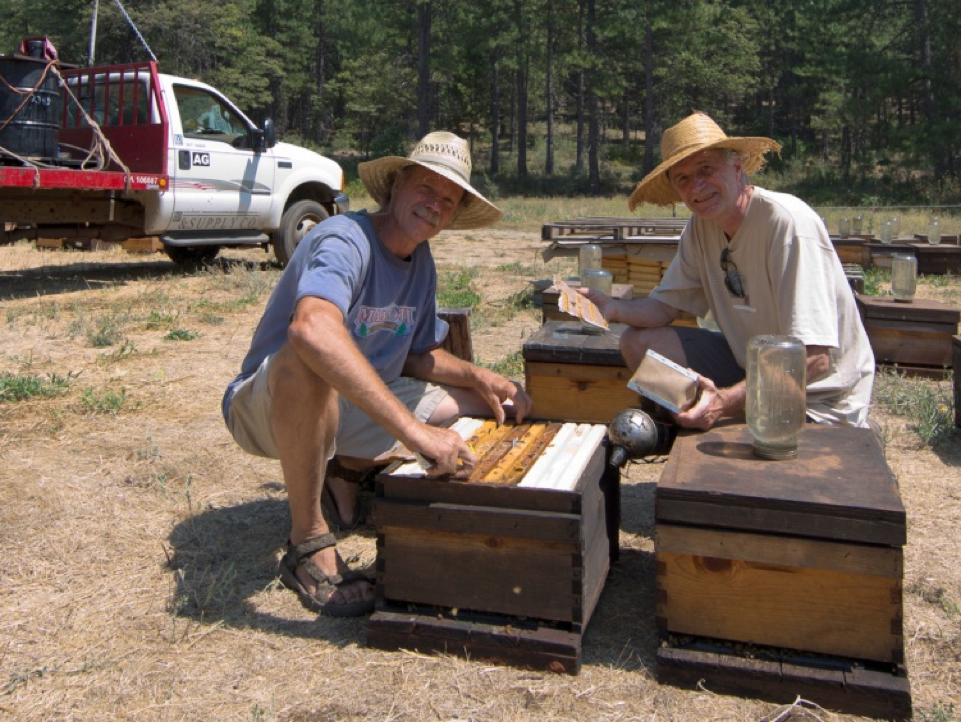
Figure 4. A visit by friend Gilles Ratia (on right), president of Apimondia (he borrowed the ratty hat from me).
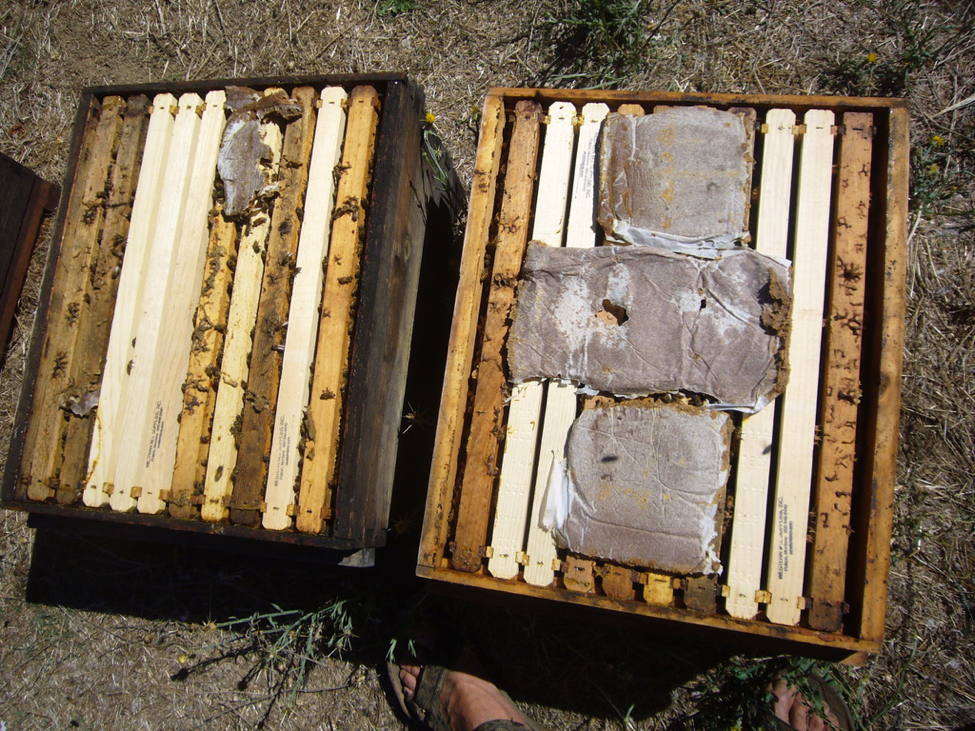
Figure 5. We split the patties in half to allow bees access to the center syrup feeders. This is prior to adding the 1½ inch rims. The Natural (shown) patties, to no surprise, were consumed most readily.
Figure 6. Thanks to Gilles Ratia for taking these three photos at the experimental yard. Note the landmarks of cinder blocks and pallets.
Figure 7. The trial was begun during our dry foothill late summer, in a drought year, with no rain expected for at least two months.
August 19: Syrup feeding #5. Added 1½ inch rims below cover to allow for better access to patties and to reduce the heat load to the nucs. Treatment #2 with oxytet. Natural nearly all consumed, followed by Ultra, FeedBee, BeePro; least taken were Homebrew, and no interest in Yeast.
Experimental issue: The colonies in the Natural group have nearly consumed their patties in 11 days. The lack of consumption of these two yeast-based patties concerned me. I’ve long used the yeast used in the Homebrew patties with great success (as have many Western beekeepers), so I’m quite surprised by the striking lack of consumption of the yeast-based formulations. As a side test, I placed samples of each into strong colonies in a nearby yard; the patties quickly disappeared. This raises the question as to whether the strong colonies were consuming the yeast patties for their nutritional value, or because they were simply removing them as perceived contaminants in the hive.
August 22-26 Despite the long presence of plenty of sealed brood, the clusters still hadn’t grown enough to draw additional combs; foundation was only being drawn on the two facing combs. Our last significant bloom, Yellow Star Thistle, was starting to seriously dry up. There was still some broodrearing in the negative controls. By syrup feeding #6, the colonies were starting to plug the broodnests slightly, so we cut back on syrup to allow the colonies to make room for additional egglaying. I expect the populations to soon expand as the existing sealed brood emerges.
September 4–Patty feeding #2: All colonies appeared healthy and queenright. A few colonies have grown enough to cover additional frames, but there is still little additional foundation being drawn, despite the fact that many have built comb up into the rim space above the frames. The weather has continued to be hot, but we got a very unusual inch of rain two days ago. Broodnests looked good, lots of eggs. In order to encourage broodrearing, we added 1 frame of freshly extracted comb adjacent to the brood (Fig. 8).
Figure 8. By this point in the trial, we were frustrated that the colonies had not yet expanded as much as we expected, so in the hope of increasing broodrearing we started to (equally in all hives) replace frames of foundation with freshly extracted drawn combs (placed adjacent to the outer brood frames).
Most all subs fully eaten except Homebrew and Yeast, which only a few colonies had eaten completely. There was large colony-to-colony variation in consumption of the two yeast-based patties—some nearly uneaten, some fully eaten. Uneaten Homebrew hardened up, but the bees kept a moist working edge. We added new sub patties over/adjacent to any uneaten remainders.
Experimental issue: I hadn’t expected such a vast difference in the rates of consumption of the various formulations. At this point, I didn’t want the groups which had consumed all their patties to go without additional supplemental protein, so we added new patties to all groups, even if they hadn’t consumed the last. This point needs to be taken into consideration in future protocols.
As yet, there is no obvious difference in buildup between the positive and negative controls, nor any sub group. Due to the unusual amount of late natural pollen this year, we may need to move the entire experimental group to a lower elevation yard to ensure protein stress, and continue to build the colonies over winter.
Sept 16– Patty feeding #3; syrup feeding #7: We are now feeding 2:1 Pro-Sweet:water, with ½ cup bleach per 50 gal to inhibit fungal growth in the feeder jars. Queens laying well, with most colonies containing a couple of large patches of sealed brood, so (again) I expect populations to grow. Hive-to-hive variation in colony strength is starting to become apparent—some hives with 3-4 frames of brood, a few with only 1. But there is as yet no obvious difference between treatments. Removed one colony in the Negative group that had gone queenless.
We removed and weighed the uneaten Yeast (19.0 lbs total) and Homebrew (17.0 lbs) patties. We rearranged the combs to place honey combs to the outsides, and the remaining combs of foundation next to the brood (Fig. 9).
Experimental issues: Unfortunately, the vegetation has responded to the early Sept rain and the ground has “greened up,” allowing the local flora to produce a minor pollen flow. The weather can be a problem with field trial design and execution—the September rain was completely unexpected.
Another issue was that we were short on drawn comb (I hadn’t expected needing any for the trial), and had to extract honey from other hives to make some available. This added the variable of whether the drawn comb was “light” or “dark” (we didn’t have enough at our disposal to put together 160 identical extracted combs). We noticed that there was more egglaying in the added dark combs. The best that we could do was to randomly distribute the combs from each extracted super between the groups (to avoid the influence of any one donor colony upon any particular group).
Note that at this time point, the two yeast-based formulations had been only half consumed, whereas all other formulations had been nearly completely eaten. This raised the unexpected question as to exactly how to determine when and how much patty to feed. We had three choices:
- To feed the entire trial when the first group (typically the Natural) had consumed all their patties. The consequence of this would be that we’d keep piling new patties on top of old in the yeast groups.
- To only feed when the patties were fully consumed in the least-consumed groups. But this would starve the other groups for protein while we waited for the yeast groups to catch up.
- To practice ad libitum (free access) feeding by replenishing patties to all groups whenever the Natural group was running short, and removing unconsumed patty from the yeast groups. I chose this approach, and weighed the uneaten patties for each group. I felt that this approach most closely mimicked what a beekeeper would do in practical management.
Figure 9. We rearranged the frames, putting honey to the outsides, and moving foundation next to the brood.
Experimental considerations:
At this point, some colonies in each group were consuming their patties at a noticeably greater rate than others (Figs. 10 and 11). Since what we were really interested in was the overall benefit of each formula to its entire test group, I decided to completely shift to ad libitum feeding. We began to “steal” unconsumed patty from those colonies not eating theirs, and give it to others in the same test group who had completely consumed theirs. This is an important consideration for the protocol of future trials—do you want to limit those colonies that really want to take off?
Figure 10. There was a notable hive-to-hive variation in consumption of patties of the same type. Here are two side-by-side hives in the Yeast group on Sept 16, showing the amount of the 2 lbs. of patties consumed.
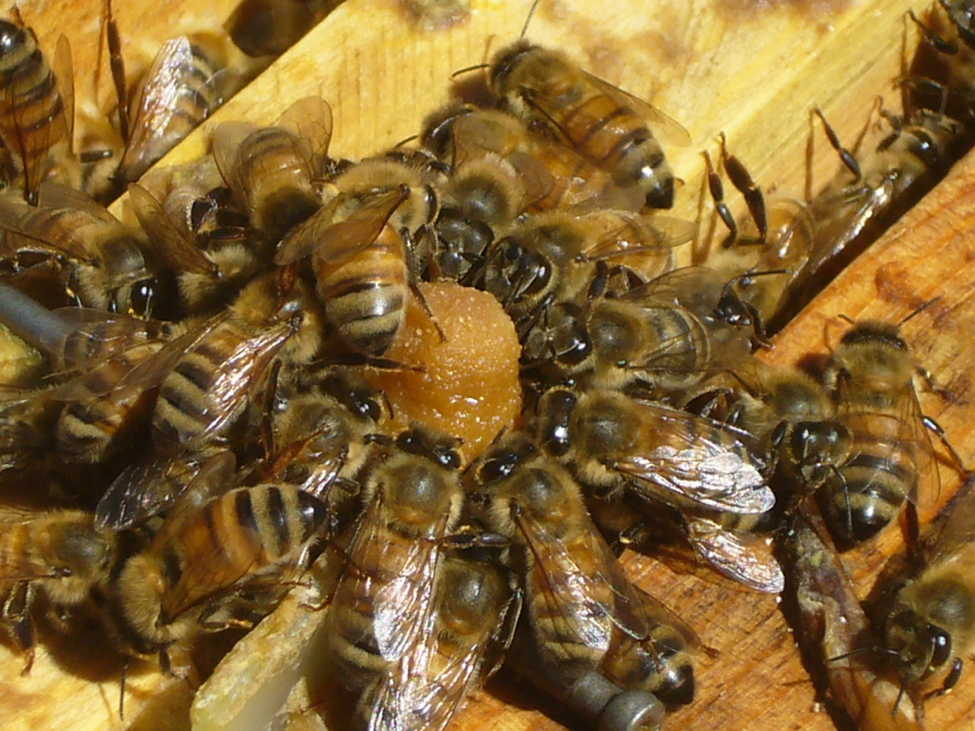
Figure 11. When I removed the lid of hives given other supps, I’d find bees eagerly consuming the last of their patty. This was all that remained in one of the Bulk patties, right over the Apivar strip.
September 26-30– Patty feeding #4 (2 lbs); syrup feedings #8 & 9: Most colonies had fully consumed the previous patties, with the exception of the Yeast and Homebrew, which were only partially consumed in several hives. This is the first time that those patties had been well consumed. The rough order of feed consumption preference was, from most consumed to least: Natural, Mega, Ultra and Bulk, BeePro and FeedBee, Homebrew and Yeast. Since many colonies had fully consumed the last patty in as little as 6 days, we fed 2 patties this time (Fig 12).
Figure 12: A colony eagerly consuming two supplement patties.
Colonies for the most part are finally expanding their populations, although a few now cover only 2 frames even though they appear to be healthy and with nice brood patterns. Most colonies show white wax and are building a small amount of comb into the rim space. Some are finally starting to draw foundation, but not yet for broodrearing. Most have large patches of sealed brood in the original drawn combs, so I hope for quick expansion (hope springs eternal).
Discussion point: at this point in the trial, the colonies seem to have at last become desperate for protein, as evidenced by their increased consumption rate, notably of the yeast-based formulations.
Experimental consideration: if I run a similar trial in the future, I’m thinking that I should set up the colonies as shook swarms, made from proven colonies, equalized for weight (say 5 lbs, which should cover 10 frames), and placed onto foundation alone. This would ensure tested queens, proven colony dynamics, no pollen or pathogens in the combs, force the bees to draw foundation, and create a critical and substantial requirement for protein as a necessity for the reestablishment of the broodnest and subsequent colony population growth. The downside would be that this would entail considerable additional set up labor (and the depopulation of 162 hives to provide the bees, since bulk bees are not available in California after spring).
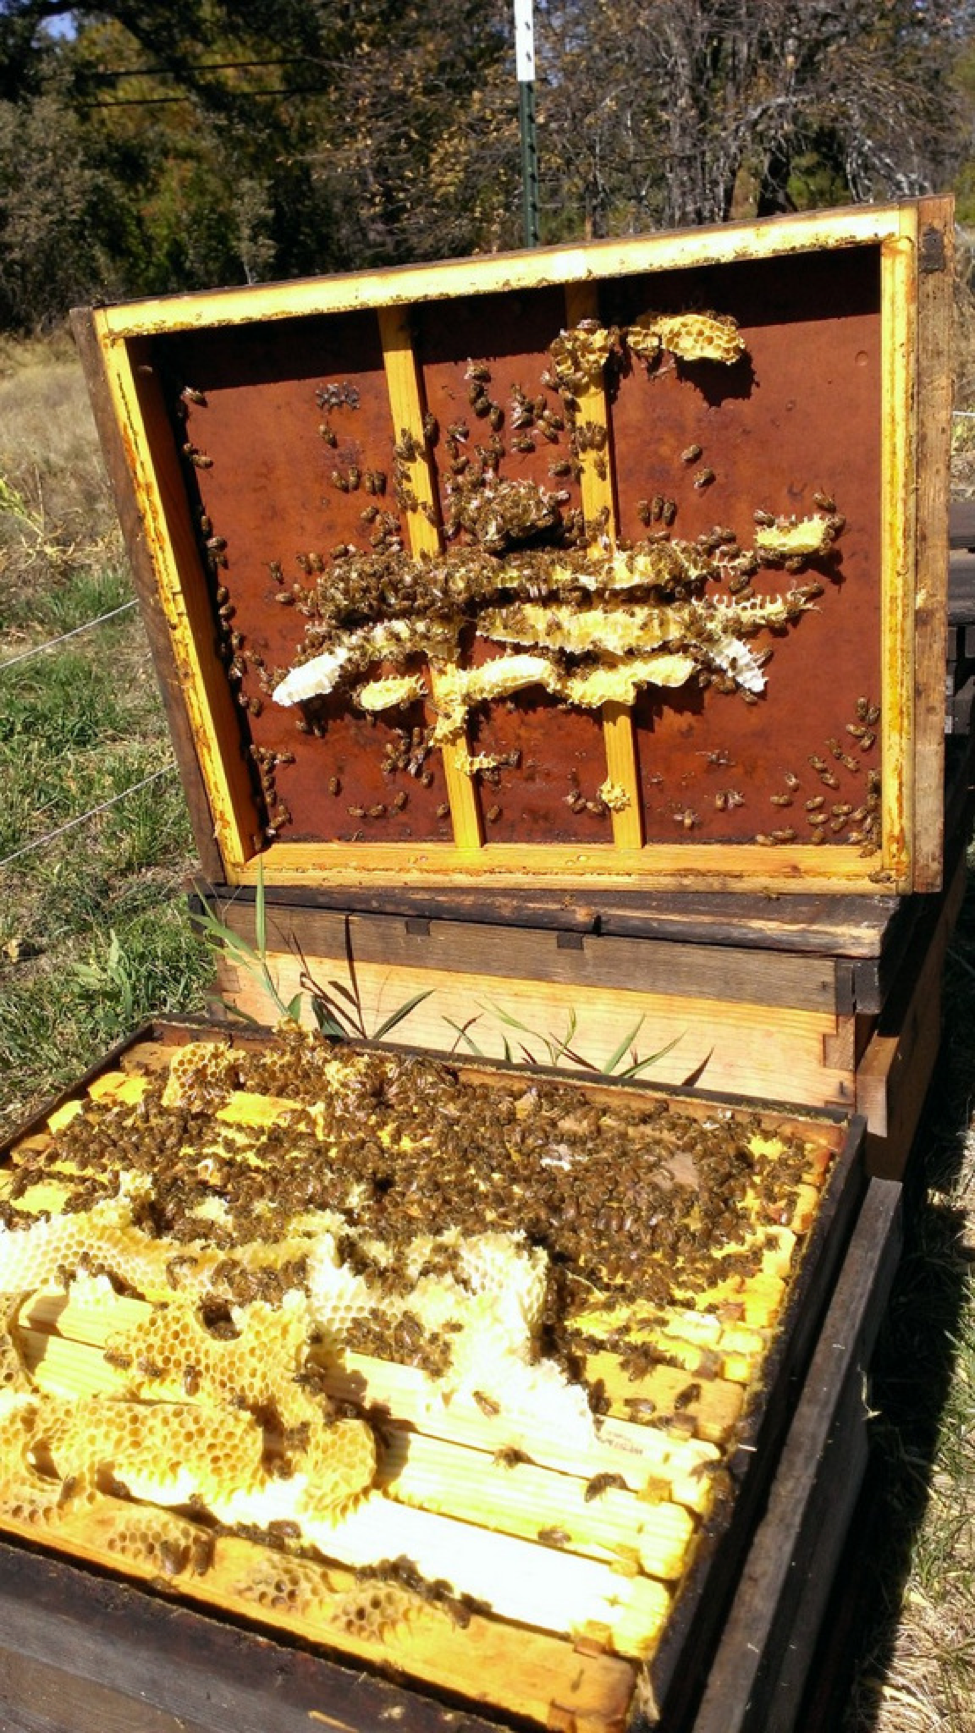
October—Syrup feedings through #12; patty feeding #5 (2 lbs) on Oct 21: OK, I give up! It appears that we will need to replace all remaining frames of foundation with drawn comb, since the bees are not drawing the foundation to any extent, preferring to build comb in the rims (Figs. 13 and 14).
Figure 13. Comb built in the rim space, filled with sugar honey. Most colonies built much less than this. This was a strong colony, as evidenced by its rapid consumption of 2 lbs of Natural pollen patty.
Figure 15. We finally bit the bullet and replaced the remaining frames of foundation with sticky drawn combs to enlarge the broodnest.
Most colonies had drawn some of the foundation, anywhere from zero to two frames mostly filled with sugar honey. A few colonies had drawn a frame and filled it with brood. The lack of interest in drawing the foundation despite the heavy feeding of syrup was a surprise to us, since most colonies had built comb in the rim space above the frames.
A few colonies had already consumed most of their last two patties, but most still had about half remaining. Colonies are now eagerly taking the Homebrew patties, despite their being much harder and drier than the other formulas.
To my great relief, the colonies are finally starting to grow! There has been enough natural pollen flow due to recent rains to allow for the storage of some beebread (Important note: bees do not rework patties into beebread [11]). In similar nearby yards, the amount of natural pollen has not been adequate to maintain full broodrearing unless supplemented with pollen sub—I suspect due to incomplete nutrition and/or lack of nectar flow. By the end of October, the colonies in the trial ranged from 6–9 frames covered with bees, with many colonies containing at least a full frame of sealed brood, plus open brood. We inspected all colonies for queenrightness, as evidenced by brood, and shifted all broodnests toward the center. One colony in the BeePro group was in the process of replacing their queen, so we removed it from the trial.
Experimental notes (at the “low point” of the trial): It has been extremely frustrating in our failure to get the colonies to grow and draw comb up ‘til now. The nucs always contained frames of sealed brood, so would have been expected to rapidly gain strength. This is not my first rodeo—we grow over a thousand nucs a year, although we don’t normally do it this late in the season; but we do normally build up our established colonies with pollen sub and syrup in late summer. And immediately prior to the trial I had tested the rate at which singles could draw out comb when I replaced 5 frames with foundation—they completely drew it out in a few days with similar syrup feeding. I’m going to try to figure out this summer (2014) what went wrong.
I’m also greatly disappointed that we are not yet seeing any great difference by treatment (and am hoping that we haven’t wasted a lot of time and money); we will wait a bit until the sealed brood emerges to grade these hives for frame strength.
Luckily, there is active broodrearing during this unseasonably warm fall weather. I am cautiously optimistic that we will actually be able to build these colonies to pollination strength by February, and to complete a valid trial of the pollen subs. There is only a few days’ supply of beebread in any hive, so the colonies will soon be entirely dependent upon pollen sub in order to grow.
I’ve arranged for a perfect winter yard to which to move the entire trial: at 1200 ft elevation (perfect for winter buildup), on a south-facing slope. We plan to move the hives as soon as the Coyote Bush (Baccharis) there finishes flowering, after which there should be no appreciable winter forage until the alders bloom in January. We are now feeding Pro-Sweet (diluted to 50% sugar) to stimulate them, hopefully without them plugging out the broodnests—we had good success with feeding 1:1 syrup last winter at locations close to the new yard.
To Be Continued
I’ll continue next month with the results of the first grading. Teaser: the trial starts to get really interesting at that point, as the effects of the different pollen subs really begin to show. I know that some of you will be eager to hear the results before the next installment is published, so I’ll post a brief summary to my website update page [12].
Appendix: Formulations of the Products
The specific ingredients in the commercial products are proprietary information. The trend of late is a shift away from soy or milk, and to use novel and inexpensive sources of protein, such as pea protein or corn gluten meal. The formulations of the three patties that I had custom mixed were:
FeedBee
| Ingredient | Weight lbs | Percent |
| FeedBee dry product (10% natural sugars) | 264 | 53 |
| Granulated sugar (sucrose) | 150 | 30 |
| Water (approx) | 80 | 16 |
| Approximate total | 494 | 100 |
Homebrew
| Ingredient | Weight lbs | Percent |
| Brewtech yeast—a popular protein source long used by commercial beekeepers in California and Hawaii. Thanks to Pat Heitkam, California supplier. | 145 | 36 |
| Granulated sugar (sucrose) | 145 | 36 |
| Type 55 HFCS (added to maintain a soft consistency) | 90 | 22 |
| Dried powdered egg yolk, food grade. From Honeyville.com | 8 | 2 |
| Corn/canola oil blend (3 32-oz bottles)(SaveMart) | 5.5 | 1 |
| Multivitamin/mineral supplement (Latshaw) | 4 | 1 |
| Coconut oil | 2 | 0 |
| Citric acid | 2 | 0 |
| Phytonutrient blend: NanoGreens10 (1 bottle) (www.biopharmasci.com/stylesheets/nanogreens_brochure.pdf) | 0.623 | 0 |
| ProHealth (~1 cup) Emulsified lemongrass & spearmint oils (Mann Lake) | 0.5 | 0 |
| Approximate total | 402 | 100 |
Natural
| Ingredient | Weight lbs | Percent |
| Natural California trapped pollen donated by beekeeper Jeff Becker. | 180 | 57 |
| Granulated sugar (sucrose) | 63 | 20 |
| Type 55 HFCS | 73 | 23 |
| Approximate total | 316 | 100 |
Protein and sugar percentages of the patties
The following figures are calculated values which include all sugars in the formulations. Note the low sugar content of FeedBee patties, and the extremely low protein content of the Natural Pollen patties (less than half that of UltraBee).
| Patty Type | % Protein | % Sugars |
| BeeProa | 13.8 | 57 |
| Exp. Bulka | 15.6 | 52 |
| Exp. Yeasta | 13.2 | 42 |
| FeedBeeb | 19.4 | 36 |
| Homebrewb | 17.1 | 51 |
| MegaBeeab | 13.5 | 47 |
| Natural Pollenabc | 9.1 | 63 |
| Ultra Bee | 20.2 | 48 |
| a Values from manufacturers | ||
| b My calculated values | ||
| c Based upon estimated values for natural pollen of 25% sugars, 20% protein (wet weight) | ||
A Comparative Test of the Pollen Subs
Part 2: Results and Discussion
Randy Oliver
ScientificBeekeeping.com
I’d been frustrated by the lack of buildup of the colonies to this point—we hadn’t observed any obvious difference differences between the treatment groups, but we hadn’t yet done a formal grading. I’ll begin this article at Time Point #1, at which we grade for strength.
November 4 —Time Point #1 grading: Cold morning, warming during grading, some flight, but colonies mostly in fairly tight cluster—good for consistent grading.
Experimental consideration: There are a number of methods for estimating the adult population of a hive. The “objective” method [13] involves closing the colony in the morning before any bees start flying, weighing the hive while still full of bees, then temporarily shaking all the bees off the combs and weighing the hive again to get the actual weight of bees. This method, while quite accurate (assuming that there is adequate drawn comb for nectar storage overnight, so that the bees in some colonies don’t have more nectar in their crops than others), is time consuming and extremely disruptive to the colony.
The “subjective” method [14] involves pulling the combs from the hive one at a time, and having at least two independent observers estimate the percentage of each frame side fully covered with bees [15]. This method is again quite disruptive to the colony, and can result in queen loss.
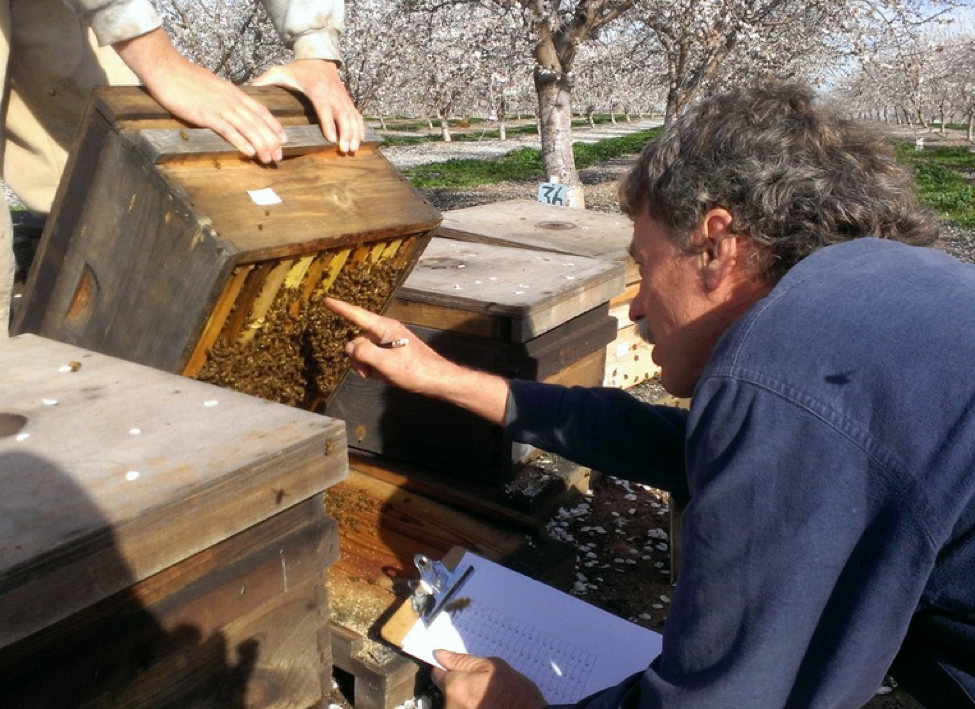
The method that I chose to use is a variation of the “cluster count” [16], typically used to grade colonies for almond pollination. In cool weather, the size of the unbroken cluster reflects the volume that the colony is able to thermoregulate. By removing the cover and then tipping the single brood chamber up to view from the bottom (as well as from the top), it is easy to count the number of frame interspaces filled (or partially filled) with bees. By adding these up (including fractions), one can quantify the total number of frames covered with bees [17]. For consistency, I personally graded every colony at each time point (and for all intents and purposes was blinded as to treatment).
We spot checked one or two hives in each group. Patty consumption has slowed down, other than in the Natural group; in general, in the patty-fed colonies, there were nice solid patches of sealed brood– typically about 4 hand-sized or better patches per hive, and some open brood.
Now It Starts To Get Really Interesting!
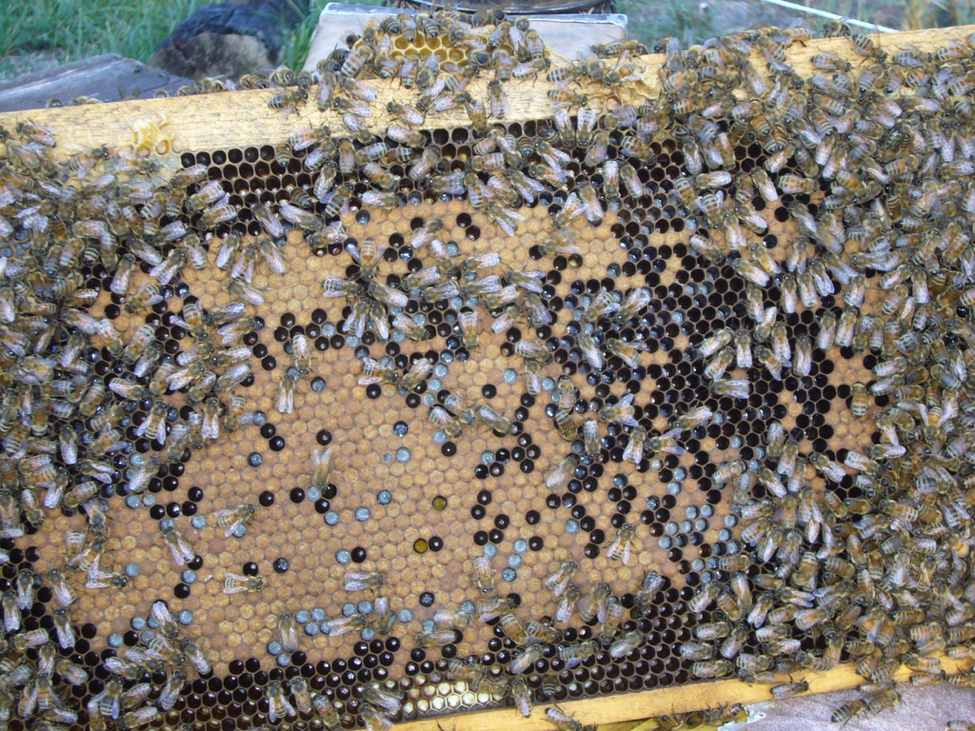
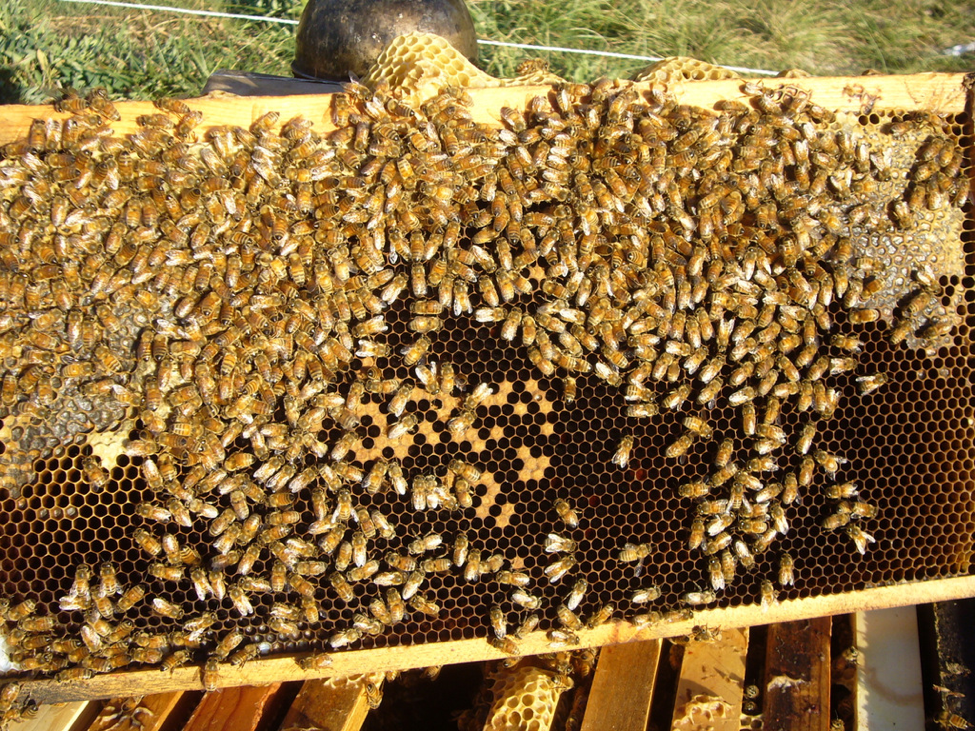
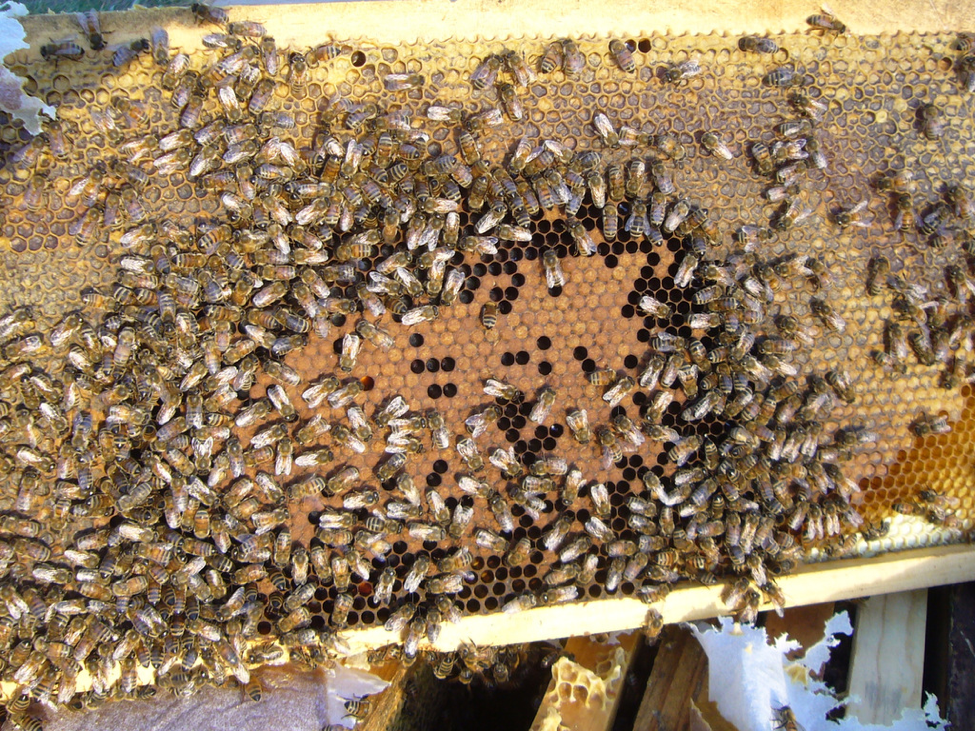
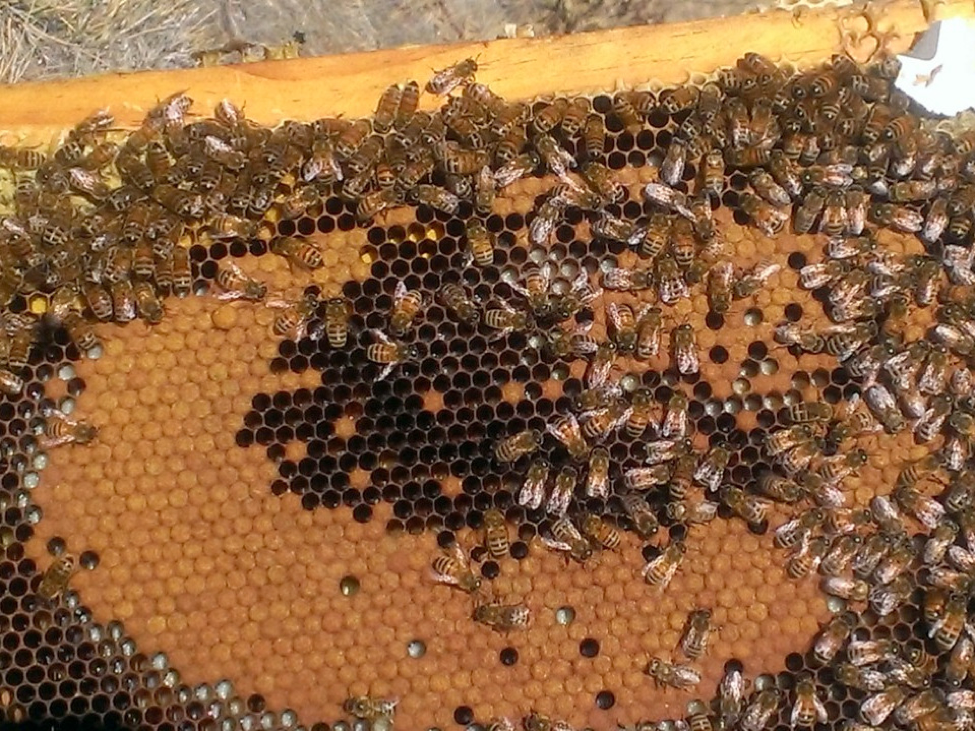
At this time point (early November), for the first time, a clear difference in strength between the groups was evident in the field (such differences are far more evident when hives are tipped up and viewed from the bottom). The Negative Control group was clearly weaker than any other. More telling, though, was the difference in the broodnests. The Negative Control group had by far the least amount of sealed brood, little open brood, and the sealed brood was typically spotty (see Figs. 1–4).
Figure 1. Typical brood in a 5-frame-strength Negative Control hive. Note the spottiness. In this hive the queen was laying well on the other side of the frame, but the bees did not appear to be rearing larvae anywhere in the broodnest, suggesting that they were cannibalizing the eggs.
Figure 2. By contrast, this is a typical brood frame from a 6-frame hive fed one of the better supplements. Note the greater amount of sealed brood, as well as larvae of all stages.
Figure 3. Another 5-frame Negative Control hive. There were only four tiny patches of sealed brood such as this. No open brood or eggs. Note the complete lack of beebread in these brood frames.
Figure 4. Another upper-tier supplement hive. This hive had less brood than some in its group, but the pattern was again more solid than in the Negative Controls, and there was open brood present.
Investigator prediction: With these colonies going into winter, the relative absence of brood in the Negative Control group certainly foretells that the lesser strength of that group would soon become more pronounced.
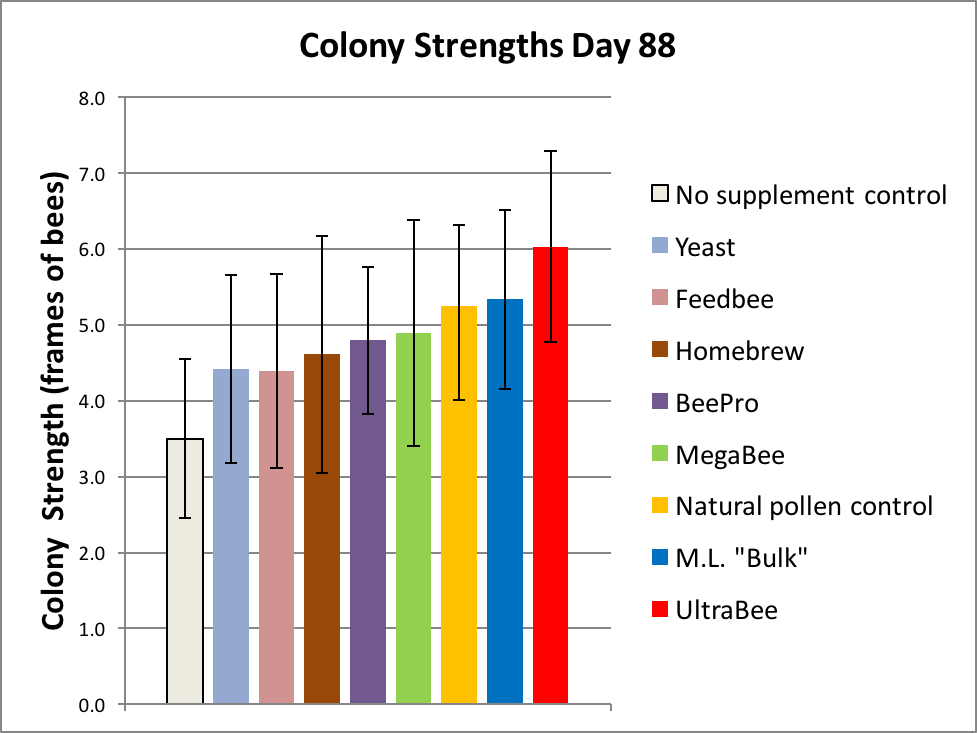
The results of the first grading are shown in Figure 5.
Figure 5. It really surprised us that two subs appeared to be outperforming natural pollen! But don’t get too excited yet—the overlapping error bars [[i]] suggest that we shouldn’t draw any conclusions as of yet. We can, however, confidently draw the conclusion that Natural Pollen was outperforming the Negative Control (p = 0.00002) [[ii]], thus validating the experimental design.
[i] The error bars shown are for the standard error of the mean (SEM). The SEM gives us an idea of the uncertainly of the calculated average value, based upon the sample size of the group (the “n”).
[ii] The Student’s t test p value of 0.00002 means that it is highly unlikely that the differences in the strengths of the groups occurred by chance alone—in this case, only 2 chances in 100,000.
Validation of the experimental design: this was the moment I was waiting for—a confirmation that this trial was a true and fair test of the nutritional quality of the treatments. Whew! Had there not been a strongly significant difference in strength between the positive control and negative control groups, I might have scrapped the trial at this point.
November 14 & 15—moving the trial: We moved the entire experiment to a lower elevation wintering yard at approximately 1400 ft elevation (Fig. 6), in hopes that we could stimulate the colonies to rear brood during the winter when scant natural pollen is available.
Figure 6. The new yard, in a Blue Oak savannah region. I’ve used this site for many years to over winter hives and know that colonies fare poorly unless supplemented. It’s just below the normal snow line, but winter foraging is usually constrained by lack of floral resources and frequent rainy weather. But in this drought year, that was not to be.
November 26/27 “Cleanup” day: Timing was perfect–the colonies were just finishing up the Natural patties. We removed all the accumulated unconsumed patties and weighed the total for each group (Table 1). The yeast-based patties again were by far the least consumed, perhaps because they were of harder texture (the FeedBee and Natural patties were the softest). However, of interest is that in the Homebrew group, there was no apparent correlation (by eye) between the degree of consumption and the strength of the colonies.
| Treatment Group | n | Lbs of unconsumed patty | Mean amt of patty consumed to date | % protein | Mean supplemental protein consumed to date (lbs) |
| UltraBee | 18 | 4.4 | 7.8 | 20.2 | 1.57 |
| FeedBee | 18 | 5.4 | 7.7 | 19.4 | 1.49 |
| Mann Lake Bulk | 18 | 6.4 | 7.6 | 15.6 | 1.19 |
| MegaBee | 18 | 2.0 | 7.9 | 13.5 | 1.07 |
| Soy/yeast (BeePro) | 17 | 13.2 | 7.2 | 13.8 | 1.00 |
| Homebrew (yeast) | 18 | 23.4 | 5.8 | 17.1 | 0.98 |
| Experimental Yeast | 18 | 26.0 | 5.5 | 13.2 | 0.73 |
| Natural | 18 | 1.6 | 7.9 | 9.1 | 0.72 |
| Negative control | 17 | n/a | 0.0 | 0.0 | 0.00 |
Table 1. On November 26 we removed all unconsumed patties from the hives and calculated the mean amount of patty consumed by each group per date. Note the differences in total protein consumed to date (right hand column).
Discussion: Even at this early stage of the trial it is evident that the value of a pollen sub is not necessarily a function of its protein content. The Natural patties were doing as much good as the best supplements, although they contained only half as much protein. Another note is that although there was little brood in the hives, most colonies continued to eagerly consume their patties.
We continued to replace foundation with freshly-extracted drawn comb, feed patties, plus feed dry Drivert sugar over paper on the top bars (in the hope of stimulating broodrearing without the problem with syrup plugging the broodnests)[20]. We also drenched each cluster with ½ cup of 1:1 sucrose syrup containing 25mg of fumagillin to inhibit nosema.
Conditions are still warm enough for daily flight; a few pollen foragers were bringing back loads—mostly of bright orange rust spores (Fig. 7), and some light-colored pollen.
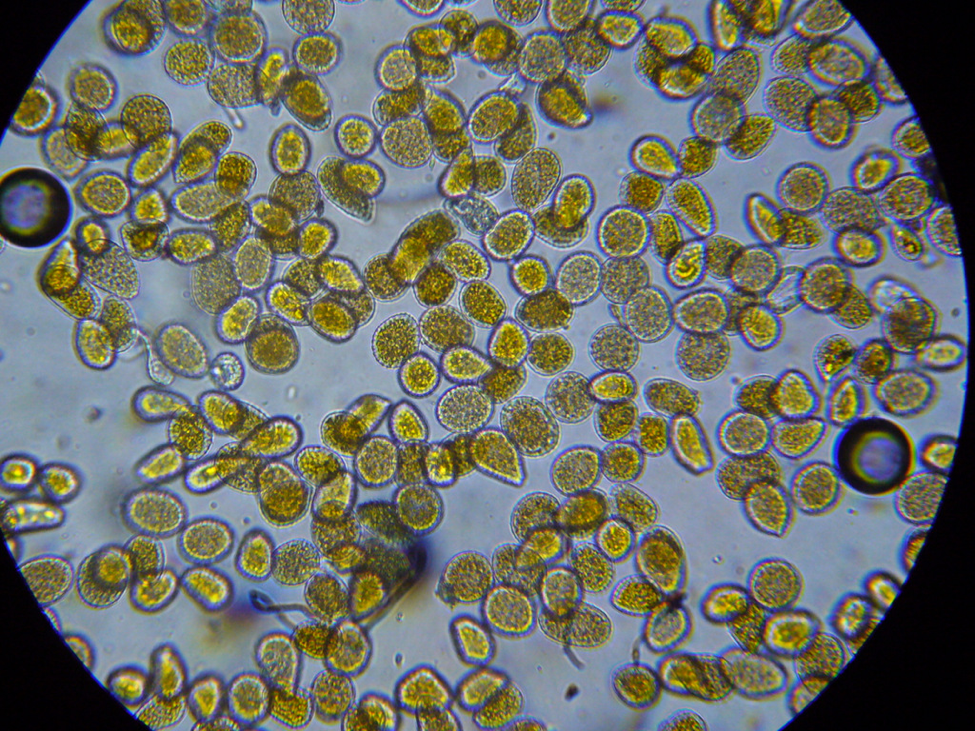 Figure 7. I confirmed that the bees were foraging upon rust fungus spores by viewing their corbicular [[i]] loads and beebread under the scope. These spores are apparently of poor nutritive value, and may even be toxic to bees [[ii]].
[i] Taken from their pollen baskets.
[ii] See Schmidt, JO, et al (1987) Survival of honey bees, Apis mellifera (Hymenoptera: Apidae), fed various pollen sources. Ann. Entomol. Soc. Am. 80: 176-183.
An aha! moment: I’ve long wondered why colonies in the foothills may go backwards in fall despite having bands of beebread around the broodnest. When I examined this beebread under the ‘scope, it often completely lacked any plant pollen spores whatsoever! This condition continued until about the first of January, when alders began producing pollen.
Note that when Dr. Eric Mussen and I first we started looking at the gut contents of bees from colonies doing poorly during the CCD epidemic, we often found their guts to be full of rust spores. Why would bees collect non nutritive spores? I discuss at [23].
Varroa monitoring: I took 4 composite alcohol washes of ½ cup (~320) bees from outside frames of a few colonies in arbitrary groups. The results were 3, 4, 4, and 10 mites, indicating mite infestation rates of about 1% for the first three, and over 3% for the last. The degree of infestation surprised me, since Apivar treatment had been optimally applied all through the month of August and well into September.
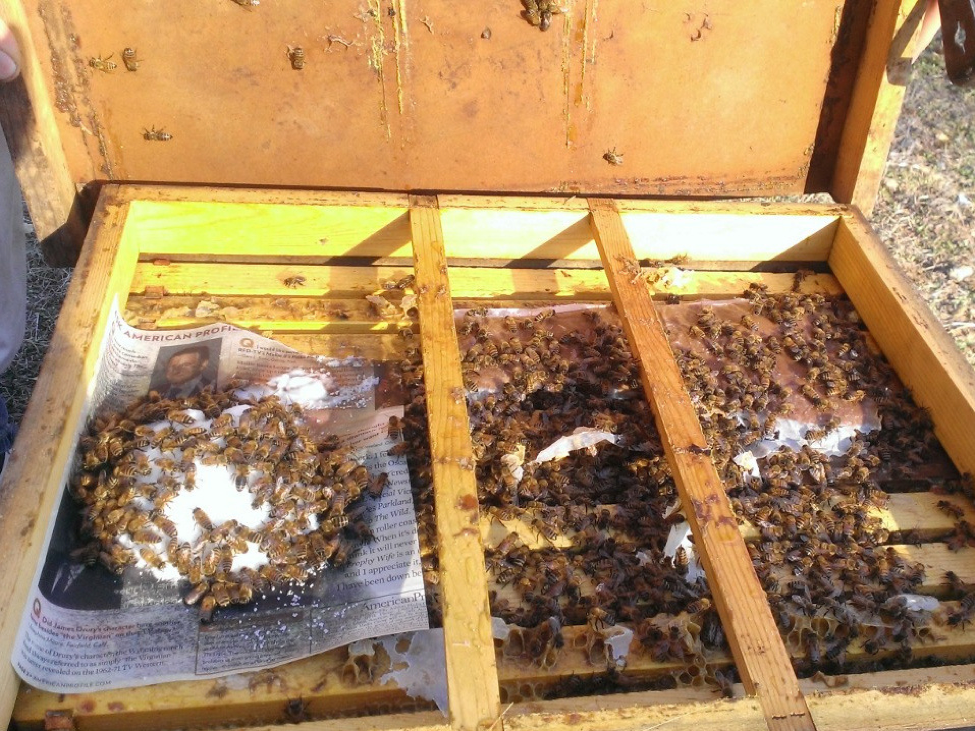
December 15 (following a cold snap of below freezing temperatures, and some snow): Weather is now clear and high 60’s. In Hive #3 there was a pile of dead bees in front and hundreds of trembling dying bees on the bottom board, apparently CBPV (I removed this colony from the trial). Put entrance reducers in all hives. Since broodrearing was at the minimum, we treated all colonies with oxalic dribble [24]. Continued to stimulate with Drivert (Fig. 8). Spot checked 3 hives—all had some sealed brood, one queen was laying well, but no larvae; one had some larvae; one with no egglaying or larvae.
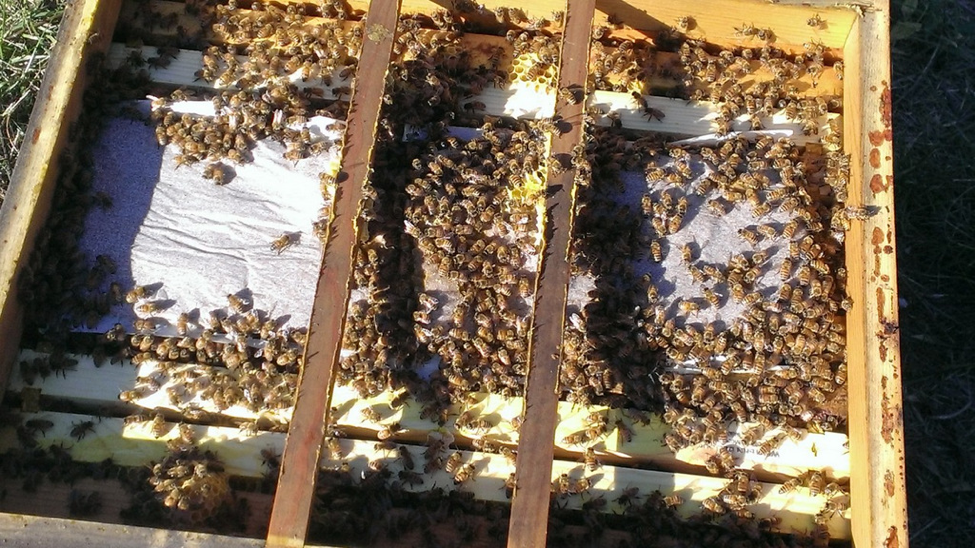
Figure 8. Typical colony condition at the winter solstice. Pollen sub patties to the right, Drivert sugar to the left. There were huge colony-to-colony differences in the consumption of Drivert. To our surprise, the consumption of Homebrew patties picked up at this point.
December 23: Weather has been dry and unseasonably warm; lots of flight hours. Colonies have virtually no pollen or beebread in the combs, and there is only a slight trickle of one yellow pollen coming in. The difference in strength between the Negative Controls and all other groups is becoming quite apparent. Spot checking of colonies found patches of young brood and vigorous egglaying in the stronger patty-fed colonies (Fig. 9); no sign of brood in the Negative Controls.
Figure 9. Eggs and larvae in one of the supplemented hives. Note the lack of any pollen or beebread.
The Best Laid Plans…
I planned this trial to be run during the foothill winter when there would be little opportunity for foraging, due to cool weather and rain. To our chagrin, we had no winter (Figs. 10 and 11).
Figure 10. In a normal winter, cool wet weather restricts foraging. But during the unusually warm and dry winter of the trial, on most days bees were able to fly to some extent. But it didn’t do them much good until about the first of January.
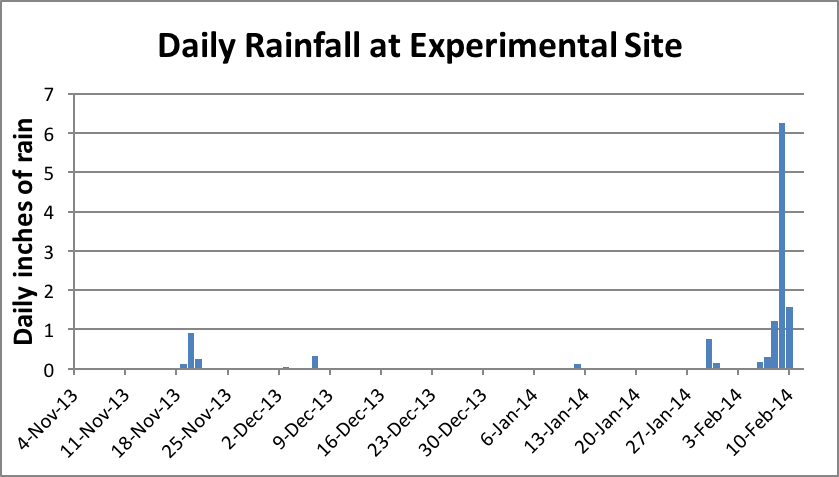
Figure 11. We normally get most of our rainfall in winter, which keeps the bees in the hive. The historical average for the period of Nov–Jan is about 17 inches; we received only 2 inches. This was not enough to germinate the seeds of early-flowering annuals, which restricted January/February foraging to alder pollen alone. We finally received rain in early February, shortly after moving the hives to a barren almond orchard.
The warm dry weather certainly allowed for “fruitless foraging,” which wears out the workers with little benefit to the colony. We continued to feed (Patty feeding #7, Syrup feeding #13) (Fig. 12). Due to fear of creating robbing situations, we did not feed 4 hives in the Negative Control group that had less than 2 frames of bees, and had not touched their Drivert.
Figure 12. A gray and dismal December 27, but the first few spring alder pollen loads had started coming in from a distant streambed. We spot checked a few hives–the best had two full frames of mostly open brood, apparently sustained to some extent by the pollen subs.
Another Unexpected Complication
The nearest creek with alder trees was nearly a mile away, and in normal winter weather bees at this location are generally unable to work it to any great extent. But not this winter—the trees started blooming about January 1st, and the bees packed alder pollen in through the entire month of January (Figs. 13 & 14).
Figure 13. I sampled pollen loads from returning foragers, as well as beebread. I’m no palynologist, but under the ‘scope the pollen consisted entirely of the distinctive 5-pored pollen grains of alder (I confirmed by also collecting grains directly from the catkins for comparison). It was clearly time to grade the colonies before any effect of alder pollen kicked in!
January 3, 2014–Time Point 2: Cold morning, clusters tight for quick and accurate grading. The availability of alder pollen is now allowing even the Negative Controls to rear brood in earnest. We inspected 2 strong hives each from the Negative and Ultra groups. Negatives each had one hand-sized patch of sealed brood, surrounded by open brood and fresh beebread (Fig. 14). By comparison, the Ultra hives had about 4 frames of brood of all ages. Patty feeding #8 (~2 lb)—40 lbs total per group plus 1 cup Drivert. Most colonies had roughly ½ lb patty remaining (Natural taken the best, Yeast and Homebrew the least), but broodrearing was in earnest, and I was to be away next week, so we fed. Although some colonies clearly lacked enough bees to consume 2 lbs of patty, we fed anyway so as not to add an additional variable—we will weigh any unconsumed patty at a later date.
Figure 14. Alder pollen stored around the brood on January 15. This photo was shot early in the morning, evidence that alder pollen was being gathered in excess of the consumption rate.
January 20—Changing feeding protocol to ad libitum; Patty feeding #9: Due to large variation in colony strength and consumption of patties, we inspected each hive and added one patty to any hive that had less than 1 lb of patty remaining (hive numbers recorded). A few colonies were light in weight, and many had completely consumed their feeding of Drivert, so gave Syrup feeding #14. Some colonies are approaching 10 frames in strength (afternoon spot grading).
January 25–Time Point 3 grading: Warm days, almonds budding early, so preparing to move hives to an orchard. Still plenty of alder pollen coming in. Checked one large typical (by color) beebread sample—still 100% alder pollen.
Experimental considerations: It is impossible to avoid bias! Investigators must go out of their way to blind themselves as to treatment group during data collection. In this trial, that was generally easy for me, since at my age I have trouble remembering which group (other than the Negatives) received which treatment. In any case, I tend to go into auto pilot as I rapidly grade, and intentionally avoid checking for treatment. With a large number of hives to grade, one must take into consideration that once colonies start breaking cluster, that you’ve added a time variable to the grading. To account for this effect, we rotated quickly through the groups systematically, grading only 6 hives in each group in rotation. At every time point, all grading was completed in less than 1½ hrs.
Pre Almond Buildup
Some colonies were down to half of frame of bees. Checked any less than or equal to 2 frames in strength for queenrightness (there were 8 of these in the Negative Control group). All were queenright, with nice brood, no sign of disease, and often fat queens (Figs. 15 & 16).
Figure 15. Photo of a tiny colony in the Yeast group (graded at 1 frame of bees). Note the yellow alder beebread, healthy brood, and fat queen below my finger.
Figure 16. Photo of a Negative Control colony that graded at only 1.5 frames of bees. This colony has reared this brood solely upon natural alder pollen this spring. Note fresh beebread in upper left corner. Note the solid brood pattern. Although this colony was worthless for almond pollination, it and nearly all the other Negative Controls were able to build up quickly once the alders started to bloom.
Practical application: Our first pollen in the foothills typically comes from alders, and I’ve long wondered how nutritionally complete it was. I wonder no more—colonies can build up spectacularly on alder pollen alone! Take homes: beebread from rust spores is poor bee food; alder pollen is good.
Experimental validation: since the Negative Control group had high survival (17 of 18 still alive on Feb.17) and built up quickly once they got some alder pollen (to 7 frames of bees by mid March), it was clear that the defining variable in this trial was the ability of a colony to rear brood, dependent upon the presence or lack of either pollen or artificial diet.
Experimental decision: At this time it was apparent that we’d already collected the most important data. So I decided to only move those hives that graded on Jan. 25 at 4.5 frames or better to a single almond orchard, leaving the rest behind in the foothill yard.
The weather turned cold and rainy, and the colonies in almonds sat there with no natural forage for over 15 days (the hives left in the foothills actually found better forage). On Feb. 7 and 9 we gave each group their final feedings. On Feb. 12, after a week of bloom, we graded the hives in the almonds (prior to their adult population being able to benefit from almond pollen). For this grading (Time Point 4) I only looked from the bottom up, so underestimated the strength of those that were covering volunteer comb in the rim space (Fig. 17).
Figure 17. Final grading of the hives in almonds. We added a second brood chamber immediately afterward.
Summary Of Trial
Duration of Trial: August 8, 2013 – February 12, 2014; 188 days.
Number of hives: started with 18 colonies in each of 9 treatment groups; 162 total. Ended with 156 still alive, healthy, and queenright.
Time points of grading: TP 0, Aug. 8; TP 1, Nov 4; TP 2, Jan 3; TP 3 Jan 25; TP 4, Feb 12.
Summary of sub feedings: 10 feedings, totaling an average of 14 lbs of patties to each colony (although some of the two yeast-based formulations were not completely consumed).
Summary of sugar feedings: 15 half-gallon feedings of syrup, plus nearly a pound of Drivert.
Results And Discussion
The results are best summarized in a graph of the colony strengths over time (Fig. 18):
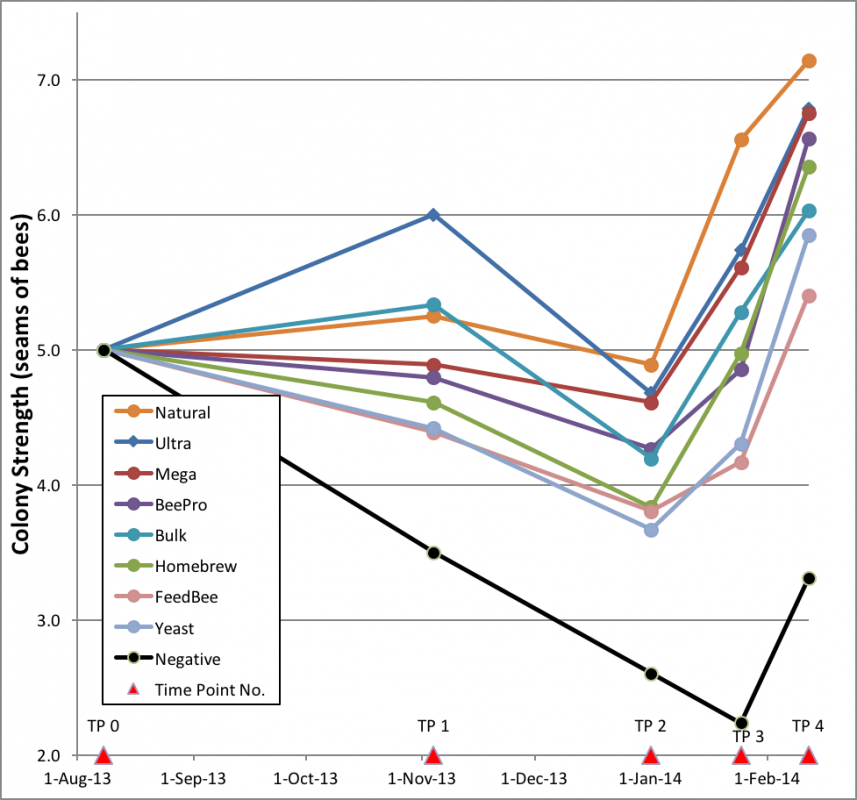
Figure 18. Plot of trends of colony strength over 188 days. Colonies fed natural pollen, to no surprise, performed best, and the unsupplemented negative controls fared worst (n = 18, except 17 for Home and Negative, 16 for Ultra and BeePro).
One can see that the Negative group went backwards from the start of the trial until they started their rapid recovery in late January [25]. The clear difference between the Negative controls and all the patty-fed groups confirmed the benefit of feeding of patties. Of interest is that two of the supplement groups took off like racehorses, and then choked—was there a delayed effect from something missing until natural pollen again became available?
What surprised me were the slopes of the “rebounds” from Time Point 3 on. The rates of colony growth in February (as indicated by the slopes of the lines) for all treatment groups appeared to be roughly the same, suggesting that once quality natural pollen became available, that there was little or no additional benefit from the feeding of pollen sub. However, for a truly fair test one would need to compare the growth rates of colonies of about the same strength. But due to the great differences in average strengths, there was little overlap of colony size between the groups. I could find only a single size range that all groups had in common. That was the 3.5–4.5 framers, whose rate of growth I compare in Fig. 19.
 Figure 19. When colonies of equal size are compared, it didn’t appear to make much difference whether they were fed pollen sub or not once natural alder pollen was available. Note that the above growth rates are not indicative of the value of any formulation as a whole. For example, Mega looks low, but that is because there were only a few Mega colonies that were weak enough to use for comparison.
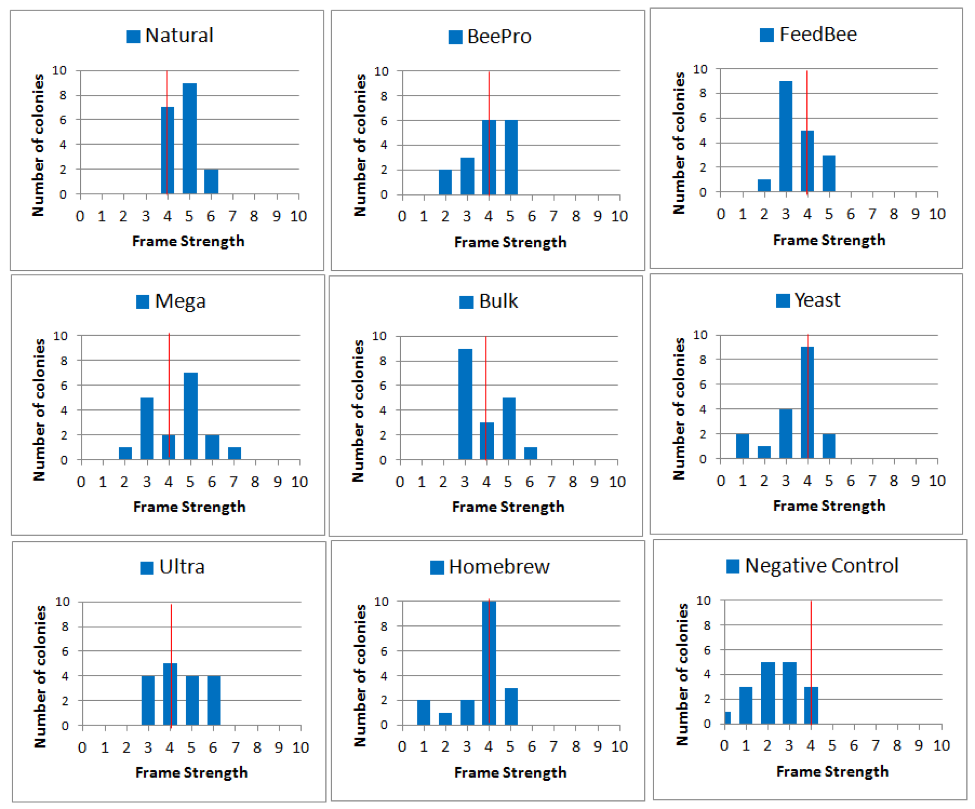
Since the mean growth rate for all treatment groups was similar from January on, I will focus my analysis upon the differences between the groups at the January 3 assessment (TP 2). First, since the arithmetical mean doesn’t tell us anything about the range of strengths, let’s look at their actual distributions (Fig. 20).
Figure 20. Histograms of colony strengths on January 3rd, showing the number of hives (height of column) of each frame strength. For reference, I added a red line to indicate the overall mean strength for all the colonies in the trial. The better the performance, the more blue to the right of the red line. Note how tightly the Natural group was distributed, and that none were below the average. Compare this to the Negative Controls, which all fell at average or below.
Your eye should easily be able to recognize that there were substantial differences in the distribution of colony strengths between groups at midwinter. But to be scientific about this, we must do a statistical analysis to determine whether the apparent differences were likely to have occurred simply by chance.
Scientific note: the problem with any field experiment involving the growth or productivity of bee colonies is their inherent variability. Even if you start a trial with equal sized colonies headed by sister queens and feed them all identically, there will invariably be large colony-to-colony differences, as can be seen in the individual histograms of each the nine groups above (all 17–18 colonies in each group received identical treatment, yet there was still a lot of “noise” due to natural variation). The problem for the investigator then is to separate the “signal” (the effect of treatment type) from the “noise.” To do so, we perform an analysis of variance (ANOVA) [26].
In this trial, the effect of treatment is best separated from the noise by comparing the mean changes in strength from Time Point 0 to Time Point 2 (midwinter; Day 148), as shown in Fig. 21.
Figure 21. All colonies started at 5 frames in August; most lost strength by early January. Note that although the means were all losses, some of the colonies in top tier patty groups had actually gained as much as 2 frames in strength. The n was 18 for all except Ultra, BeePro, and Negative, which had 17. Error bars are SEMs.
ANOVA found that there was a highly significant difference among treatments (F8, 151 = 6.922, p = 0.000000095) at the January 3rd assessment.
Investigator celebration: getting a very low p value is thrilling for an investigator. An experiment of this sort is run in order see whether the data allow us to reject the “null hypothesis” that there was no difference due to treatment (in which case the colony strengths would have been randomly distributed). The extremely low probability (p) value I got says that the observed differences would only be expected to occur by chance in about one case out of 10 million, so we can be pretty sure that at least some of the differences were indeed due to the effect of treatment (the type of patty fed). That means that I can safely “reject the null hypothesis.” This gives me, after all the hard field work, cause for celebration, since I can now say that yes, the experimental design was valid, and that some patties truly outperformed others.
The question then is which of the nine treatments were statistically different from each other? This is where the investigator must choose between ranking tests, based upon the “normality” of the data and how conservative one wishes to be in making an error [27]. I ran the liberal Duncan’s New Multiple Range test, which is favored in agronomy trials. The letters below the bars in the graph above indicate groups that were likely significantly different (or not).
Findings
Statistically, all that I can say is that the performance of the top four subs was similar to that of Natural pollen (all a’s), and that all subs (b’s) outperformed the Negative Control (c). Unfortunately, from this data set we cannot say that there was a clear statistical difference between any of the subs compared to one another (all b’s).
The Problem with STATISTICS
Statistical analysis keeps scientists from fooling themselves. No matter what your gut feeling or wishes, if you can’t show a statistically-significant difference between treatments, then you can’t say that there was one. The lack of statistical significance between the various subs means that there was simply too much variability within the groups to be sure that there was truly a difference between the groups.
Scientific consideration: This is an inherent problem with running an experiment with multiple treatments (the number of different subs). In order to detect a statistical difference, you need a large number of hives in each group. I’d hoped that 18 per group would be enough, but it wasn’t. Had I run 48 in each group, I strongly suspect that we could have statistically teased out an actual ranking of the subs.
Practical application: on the other hand, the consistent trend over time for each group (Fig. 18) suggests that there was indeed a difference between the subs. One might point out that the manufacturers aren’t stupid; Dadant and Mann Lake each sell a range of products in which the ranking by price matches their promise of performance. Speaking not as a statistician, but rather as a beekeeper who observed these colonies over the course of the trial, I preferred the top four subs (the ab’s in Fig. 21).
Colony Survival Rate
Despite the dire conditions in which these small colonies were forced to attempt to build their populations, very few failed. While many beekeepers lament winter loss rates of 30%, of the 162 nucs that I started with in August, 156 were still alive come mid February (3.7% winter loss) [28]. I had treated minimally for nosema and kept varroa to reasonable levels (with an oxalic dribble in early winter); even the several negative control colonies that had dwindled to only 1.5 frames of bees in January were able to fully recover in spring.
Where the Rubber Meets the Road
I undertook this trial in order to answer five specific questions. Let’s see what we found:
Question #1a: Can colonies be built up for almonds in late summer and over the California winter on artificial diet (sugar and pollen sub) without substantial natural forage available?
The bulk of pollen subs are likely fed by commercial beekeepers planning to go to almonds. My personal experience is that this is where you can clearly see a return on investment. I contracted to place the test hives at the end of the experiment into an orchard calling for a 6-frame average. Due to their explosive rate of growth in early February, I felt confident that filling the contract with hives grading at 4½ frames or better on Feb. 12 would result in an average above 6 frames by 10% bloom. The results of this sorting were telling (Fig. 22):
Of the colonies fed the top three subs, more than 70% made grade for almonds (I inspected the left behind hives at 10% bloom, and found that I had underestimated their growth rate; I could actually have taken a greater percentage to almonds). However, note that I’m not sure how many would have made almonds if it were not for the strong alder pollen flow in January.
Figure 22. Seventeen out of 18 in the Natural group made grade and rented for $140 in almonds; zero of the Negatives did, despite being fed plenty of syrup. The supplemental feeding of pollen patties made a big difference!
Question #1b: Can today’s formulations substitute for natural pollen?
Answer: I can give the qualified answer that the performance of the colonies consuming the best subs was nearly equal to that of those fed patties of natural pollen nearly continuously over the time period. The confounding factor was the unexpected abundance of alder pollen after January 1st. The data in Fig. 21 suggest that no product on the market can yet completely substitute for natural pollen.
A subtle but important point is that in the first part of the trial, we replenished patties to the entire experimental yard only after the Natural group had completely consumed theirs. This means that the Natural group was likely held back from their full potential had they been fed ad libitum from Day 0.
Question #2: To rank the commercially-available pollen supplements by their ability to promote colony growth.
Answer: We were, unfortunately, unable to confirm a statistical difference, likely because the colonies didn’t grow as much as expected. However, to the eye, the mean differences in loss of strength from August to midwinter were striking (Fig. 21 again; also study Figs. 20 and 22). From that point on, MegaBee and Ultra bee ranked neck at the last three time points as the best-performing supplements.
Question #3: To determine the overall cost of building 5-frame nucs on foundation to almond pollination strength.
Answer: OK, the drawing of foundation was disappointing, but 34 of the colonies did grow to 8-frame or better by Feb. 12 [29]. So let’s do the math. I fed each colony 14 lbs of sub [30], at a bulk cost of about $1.70/lb (for the two top-tier products), for a total of $23/hive. I also fed syrup, which could likely have been greatly reduced if I had started with “normal” colonies with some honey in the combs in August, so let’s say that I’d also feed 4 gallons of light syrup (20 lbs of sugar at 50¢/lb) costing $10. My total feed cost (not counting labor) for creating a 6-frame colony for almonds from a 5-frame nuc in August in the dry Sierra Foothills would be $33/hive (likely less had I initially given them all drawn comb).
Although there was a positive net return on investment, that $33 figure and the associated labor involved in feeding are substantial out-of-pocket expenses to be factored in when calculating what it costs to supply enough hives for almond pollination. As I’m typing these words, many of my drought-stricken California colonies have not made enough honey to make it through the winter, and feeding costs will weigh heavily on my bottom line.
Question #4: To compare the attractiveness and consumption rates of the various pollen supplement formulas.
Answer: The attractiveness of the various subs (as measured by consumption rate) varied from month to month. Natural was consistently the favorite. Since we switched to ad libitum feeding later in the trial, perhaps the best indicator of palatability would be the data from the cleanup of unconsumed patties on November 26 (Fig. 23).
 Figure 23. Despite the long-time successful use of yeast as a bee feed, in this trial the bees appeared to prefer other protein sources. Some of the left-hand columns would have been higher had we fed freely.
Question #5: To determine the cost effectiveness of the various subs at growing colony populations.
Answer: My initial thought was that one could feed a bit more of a second-tier sub such as a soy/yeast formulation to get the same results as from feeding a lesser amount of a more expensive sub. Then I realized that that logic was erroneous, since we had given the colonies free choice to consume as much as they wanted of the second-tier subs. The group fed the soy/yeast formulation (represented by BeePro) never lacked for having patty available at any point of the trial, yet those colonies may not have performed as well as the ones fed a first-tier diet. The practical application is that you might save money by feeding a second-tier product and get decent results, but they might not be as good as you’d get by feeding one of the best (or natural pollen).
But keep in mind that all the groups grew at roughly equal rates once alder pollen became available. That certainly didn’t stop the colonies from consuming supplement during that time—a number of colonies consumed another 6 lbs of patty between early January and February 12. Note that the consumption of the Homebrew patties picked up during that time, with some colonies in the group finally consuming them eagerly—was it the addition of natural pollen in their diets that made the difference?
Practical application: this raises a key consideration—are you feeding the patties as a supplement or as a substitute? As a supplement (when there is some natural pollen coming in), a less costly budget pollen sub may be adequate; but as a substitute, the top-tier products are likely closest to the performance of natural pollen.
Adding some amount of natural pollen from a trusted source (pesticide free and sterilized if possible) to the diet might make a huge difference (this has long been the practice of some beekeepers, but I suspect may also have introduced pathogens into our bees via unsterilized Chinese pollen). Even a small amount of natural pollen increases the palatability of patties and may supply enough of the critical Factor X.
Key Findings of This Trial
I learned a great deal by running of this experiment, and have already initiated two follow-up field trials to answer some questions. Allow me to summarize the findings and observations of interest to beekeepers, some of which run contrary to the common wisdom:
- I did not run this experiment to promote any brand of supplement, but rather to see where we stand as far as the state of the art of pollen subs. I feel that all the tested products were given a fair trial to prove their worth.
- In this particular trial, the supplemented colonies benefitted by going into winter stronger and with more brood, which then led to better buildup by the start of almond bloom.
- Since Natural pollen (the positive control) and all subs clearly outperformed the Negative control group, the experimental design was validated. Unfortunately, I did not use enough hives to tease out significant differences between the subs, plus I only ran one replicate, so one can’t assume that the ranking of the subs would necessarily be the same the next time.
- The performance of the top tier of subs was statistically on par with natural pollen. Hats off to the major suppliers for developing and selling such high performance pollen subs!
- Natural pollen still reigns supreme. There’s still some Factor X missing in artificial diets. But some of the top tier subs are getting close (and might have scored even better had there been a little natural pollen coming in to supply a bit of Factor X).
- I have no idea as to why Feedbee performed poorly in this trial. In other published trials it outperformed BeePro [31]. In this trial, the bees initially showed a preference for it, but it didn’t appear to hold up for the long run. Perhaps it would have performed better in another replicate.
- It’s not just about protein. Note that the Natural patties had by far the lowest protein content (9%, as opposed to an average of 16% for the tested subs), yet outperformed at least some or all of the subs. The Holy Grail in artificial bee diet development is to pin down the elusive Factor X in natural pollen, so that it can be incorporated into pollen subs [32].
- But a pollen supplement may be all that you need to help your colonies through a couple of brood cycles, or to stretch the benefit of a trickle of natural pollen. A pollen supplement may supply the macronutrients necessary to grow a colony, provided that a bit of natural pollen is available to supply the elusive Factor X.
- If you’ve got 10,000 hives in a holding yard, there won’t be much Factor X available. The limiting factor for feedlot beekeeping in the age of varroa may be the unavailability of a true pollen
- Best initial boost: Two products seemed to give an initial boost equal to or better than the natural pollen, and then slid a bit downhill. Since those two products had similar formulations, it may not be fluke, and perhaps we should pay this observation some attention.
- The equal growth rates of the supplemented and unsupplemented colonies when there was abundant alder pollen available suggests that it may be a waste of money to feed supplement when there is an ample natural pollen flow on.
- The costly magic ingredients in the Homebrew formulation didn’t seem to help. Neither the food grade egg yolk, the high lipid content, the coconut oil, the expensive phytonutrient extract, the lemongrass and spearmint oils, nor the fancy vitamin/mineral mix did the trick.
- In line with the above, note that only the top two formulations and natural pollen resulted in an overall increase in average colony strength in fall (Fig. 5; although the next two formulations were too close to call). This is surprising to me, since I consistently and immediately see the benefit of feeding patties of nearly any formulation to my strong colonies in August and September. I strongly suspect that the benefits of feeding sub is amplified in larger colonies. Likely the better the patty, the greater the benefit.
- The bees gotta like it enough to eat it. Of the tested patties, natural pollen was most readily consumed, but some of the subs were not far behind. The lack of palatability of the two tested yeast-based patties was glaringly evident. This really surprised me, since I and many others have long used Brewtech yeast with good results, and the other yeast was recommended by beekeepers.
- Don’t assume that all beebread is nutritious! California beekeepers pay attention—that late summer and fall beebread may be more harmful to your colonies than good. Check it under a scope to see whether it consists of rust spores.
- At least one tree pollen (alder) will completely support colony growth. I’ve often heard the assumption that the pollen of wind-pollinated trees may not be nutritious to bees [33]. The unusual weather during the trial serendipitously allowed for an unplanned test of the nutritional value of pure alder pollen. It was clearly nutritious!
- Some authors have suggested that bees need to ferment pollen into beebread in order to release its nutritional value. My findings suggest otherwise, since the pollen in the Natural patties had not been fermented. Since bees do not store patty as beebread, they must have consumed it raw [34]. Nor did the alder pollen brought in during January initially have time to ferment prior to it being consumed. Perhaps the nutritional value of pollen may be improved by fermentation, but it does not appear to be necessary to promote good colony growth.
- Amount to feed. Note the amount of supplement eaten by these small colonies (14 lbs over 6 ½ months). I suspect that those beekeepers who are tossing in only a patty or two per full-size hive may be merely serving the bees appetizers.
California is in a serious drought situation, and I suspect that many beekeepers will be feeding serious quantities of pollen subs to prepare their hives for almonds. I hope that the findings gleaned from this trial will be useful to you.
Update Oct 6, 2014 As luck would have it, the leftover patties from the trial sat in the cool shed for an entire year before we cleaned them out. Most by that time were insect-eaten, fermented, ill-smelling, or otherwise spoiled. The notable exception was Megabee, perhaps due to the preservatives. Those patties after a year looked almost as good as new, tasted and smelled fine, and were eagerly consumed by three hives that I gave them to as a test (I do not recommend feeding aged supplements).
Acknowledgments
The running of this trial was a major undertaking, and I thank my sons Eric and Ian for all the hard, meticulous, and tedious labor that they put into it. I thank those individual beekeepers and groups whose donations I used to fund the trial. I especially thank Stuart Volby for the use of Mann Lake’s equipment to mix and prepare the custom patties, and for donation of product.
Special thanks to Joe Traynor and the beekeepers contracting with Scientific Ag Company for financial support; beekeepers Jeff Becker and Ray Olivarez, Jr. for providing the natural pollen, Pat Heitkam and Dave Ellingson for help with product delivery, and to bee nutrition expert Dr. Gordon Wardell for his discussion regarding experimental design. I’m also indebted to Blair Christian and Christina Wahl for their help with the statistical analyses.
References and Footnotes
[1] Refer to my “Fat Bees” series at ScientificBeekeeping.com.
[2] Nicely reviewed by Collison, C (2014) Pollen substitutes. Bee Culture April 2014: 21-25.
[3] Reviewed by Collison, ibid.
[4] My previous research (unpublished) suggests that patties are best utilized when placed between the brood chambers.
[5] Delaplane, KS, et al (2013) Standard methods for estimating strength parameters of Apis mellifera colonies. Journal of Apicultural Research 52(1) Open access.
[6] I mainly used the locally-available product Pro-SweetÒ from Mann Lake, a 1:1 blend of sucrose and HFCS. In a recent (as yet unpublished) trial by Drs. Brian Johnson and Eric Mussen at UC Davis, it promoted better colony growth than did sucrose syrup.
[7] The history of pollen supplements is nicely reviewed by Herbert, EW, Jr. (1992) Protein Supplemental Feeding in The Hive and the Honey Bee, JM Graham, ed., Dadant & Sons, pp. 215-221.
[8] Much appreciation to Stuart Volby of Mann Lake Ltd. for the donation of the Mann Lake patties and for patty preparation at their factory. This greatly helped me in standardizing the application of treatments.
[9] Thanks to Dave Ellingson for arranging the preparation of the patties.
[10] In preparation for this trial, I ran a trial (in prep) to determine which concentration of syrup gave the best results for drawing foundation (it takes about 1/2 gal of undiluted Pro-Sweet to fully draw a comb of foundation). We began this trial feeding relatively heavy syrup in order to get the maximum amount of sugar into the hives.
[11] In previous experimentation, using fluorescent tracers, I’ve found that colonies do not move fed pollen sub patties into the combs, nor directly feed them to larvae.
[12] https://scientificbeekeeping.com/updates/
[13] http://www.coloss.org/beebook/I/colony-strength/4/1
[14] http://www.coloss.org/beebook/I/colony-strength/4/2
[15] A high-tech variation is to digitally photograph both sides of each frame , and then program a computer to “recognize” and count each bee in the photos. I’ve used this method myself in a recent trial, and observed as well a similar setup used by Drs. Cutler and Scott-Dupree (https://scientificbeekeeping.com/a-new-large-scale-trial-of-clothianidin/).
[16] Nasr, ME, et. al. (1990) Estimating honey bee (Hymenoptera: Apidae) colony strength by a simple method: Measuring cluster size. J. Econ. Entomol. 83(3): 748-754.
[17] One interstice (or “seam”) fully filled with bees equals 1 frame fully covered with bees. You can check the math: a hive body containing 10 frames has 9 interstices, plus two half interstices on the outsides, for a total of 10. In rare instances, we’ve scored a single-story hive, with bees packed to the outside and in the rim above, as high as 11.
However, the bees in the center brood frames are often not as tightly clustered as those around the periphery of the cluster, so the cluster grade will be higher than the frame-by-frame grade of bee population. The cluster grade scores the size of the thermoregulating superorganism; the frame-by-frame estimates number of bees.
I’ve compared the methods, using three independent graders at the same time on twenty different hives (in prep). Although cluster grading is not quite as consistent as the laborious and intrusive frame-by-frame estimation, in most of the 40 measurements my cluster grade was rarely more than a frame different than that independently recorded by either of my sons. The correlations (r2’s) between the mean frame-by-frame population estimation (by three other inspectors) and the mean cluster size (by the Olivers) were 0.67 for the bottom brood chamber, and 0.45 for the upper. To me, being able to perform 160 cluster grades in about an hour early in the morning makes up for the small sacrifice in accuracy. Since I graded at 5 different time points, I felt that detecting trends was more important than any single grade. The other consideration is that this experiment was designed around building colonies to strength for almond pollination, where the metric for payment is cluster size, not numerical bee population.
[18] The error bars shown are for the standard error of the mean (SEM). The SEM gives us an idea of the uncertainly of the calculated average value, based upon the sample size of the group (the “n”).
[19] The Student’s t test p value of 0.00002 means that it is highly unlikely that the differences in the strengths of the groups occurred by chance alone—in this case, only 2 chances in 100,000.
[20] Thanks to queen breeder Jackie Park-Burris for the suggestion.
[21] Taken from their pollen baskets.
[22] See Schmidt, JO, et al (1987) Survival of honey bees, Apis mellifera (Hymenoptera: Apidae), fed various pollen sources. Ann. Entomol. Soc. Am. 80: 176-183.
[23] https://scientificbeekeeping.com/fried-eggs-identified/
[24] 5mL of 3.2% w:v oxalic acid in 1:1 sucrose syrup per seam of bees, as per https://scientificbeekeeping.com/oxalic-acid-treatment-table/
[25] In early January their recovery was severely hampered by virtue of their having such tiny clusters at the time.
[26] I’m not going to pretend that I’m any sort of statistician, but I do wish to add a veneer of statistical legitimacy to my interpretation of the data. ANOVA compares the variation in each treatment group to the overall variation of all the colonies in the trial. Unfortunately, the distributions in Fig. 20 do not fully meet the normality assumptions for ANOVA, so I didn’t pursue more detailed analyses. However, ANOVA’s F test is not contingent upon normality, so would be considered to be robust in this case.
[27] Too conservative, and you may overlook an actual difference between the means, too liberal, and you would be claiming that a difference exists that really isn’t there. I ran a few different tests, and chose the most liberal, a decision that could be debated by a statistician or the seller of any of these subs. So I will try to be conservative in my interpretation.
[28] Two the queens failed in the first month, 1 colony went downhill with CBPV in January, and 3 were either queenless or superseding in February
[29] Indeed, some made an easy 10 frames by 10% bloom. For reference, 6 of the 18 in the positive control group (fed natural pollen) were 8-frame or stronger on Feb. 12.
[30] This may seem like a lot of pollen sub, but is actually not an unusual amount for migratory commercial beekeepers. See Keith Jarrett feeing his hives bulk pollen sub at http://www.youtube.com/watch?v=ETLi3Jquor4
[31] References available at http://feedbee.com/publications/
[32] To the best of my knowledge, no researcher has yet found an artificial diet upon which bees can rear more than two consecutive generations of brood. For two rounds, the nurse bees appear to be able to steal nutrients from their bodies in order to produce a nutritionally-complete jelly, but eventually the colony runs out of Factor X unless natural pollen is provided.
[33] For example, Ayers, GF (2014) Family Betulaceae—the birch family. ABJ June 2014 p. 695, citing Stanley, RG and MF Linskens (1974) Pollen: biology, biochemistry and management. Springer-Verlag, Berlin.
[34] Unless it somehow fermented in the patties. But we didn’t notice any such fermentation.


