
A Comparative Trial of the Pollen Subs 2020: Part 2

November 3, 2021
A COMPARATIVE TRIAL OF THE POLLEN SUBS 2020
Part 2
First published in ABJ August 2021
Vincent Riciglianoa and Randy Oliverb
aUSDA-ARS, bScientificBeekeeping.com
Last month I described how we set up our comparative trial of several pollen subs. Now it’s time to bring in my collaborator, Dr. Vincent Ricigliano, to show the results of some of his laboratory analyses of the bee samples taken at the midpoint of the trial, as the colonies went into winter cluster.
A note from the authors: Since Randy started writing this series in the first person, we’re going to continue along that vein, although much of this article will be about Vince’s findings. Since beekeepers are becoming more and more dependent upon supplemental feeding of their colonies, for the benefit of the beekeeping industry we’re doing a deep dive into extracting as much usable information as we can from the data gathered during this field trial of artificial diets.
That said, this article presents a lot of information from the midpoint of the trial — both field measurements and molecular analyses. The midpoint findings presented in this article help us to understand artificial diets in general, and will likely be of special interest to those interested in developing better diets for honey bees. Next month we’ll present the endpoint results, which will really get down to the nitty-gritty of dollars and cents, practical application to beekeepers curious about the pollen subs on the market.
EFFECT OF DIET TYPE UPON COLONY STRENGTH AT THE MIDPOINT ASSESSMENT
After a feeding period of 84 days — during which the colonies depended upon the tested pollen subs and sugar syrup as their main sources of nutrition — the hives went broodless in November as the weather cooled. We graded them for strength on a cold morning, when the clusters were very tight (but which allowed for accurate and consistent grading).
The first question to answer was whether midpoint colony strengths reflected their starting strengths, since I’d intentionally begun the trial with an equal range of starting cluster sizes for each diet type. A scattergram (Figure 1, in which many of the 144 data points overlap) indicates that there was no benefit from starting with a larger cluster size.
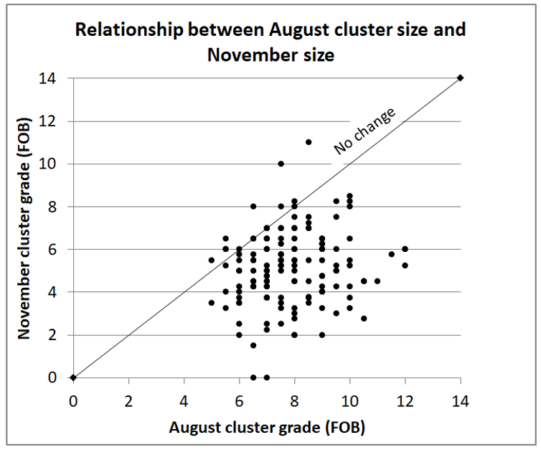
Fig. 1 Change in cluster size from August to November; colonies below the No Change line shrunk in size. The median starting cluster size (in hot-weather grading) was 7.5 frames of bees (FOB), by November (with cold-weather grading); most colonies had shrunk in size (to a median 5.3 FOB). The data above indicate that there was no benefit to starting with a larger cluster size in August, since the larger colonies tended to lose more strength than the smaller ones (as evidenced by the greater vertical drop of the data points from the No Change line from left to right).
Practical application: Being stronger in August did not mean that a colony would be stronger in November. This may have been an artifact of the clusters of the strong colonies being more expanded during hot-weather grading, more than actual bee count.
Since starting cluster size was not that predictive of midpoint size, and since all diet groups started with an equal range of cluster sizes, this means that we can compare the average colony strengths in November by diet type without taking into account starting colony strengths (Figure 2).
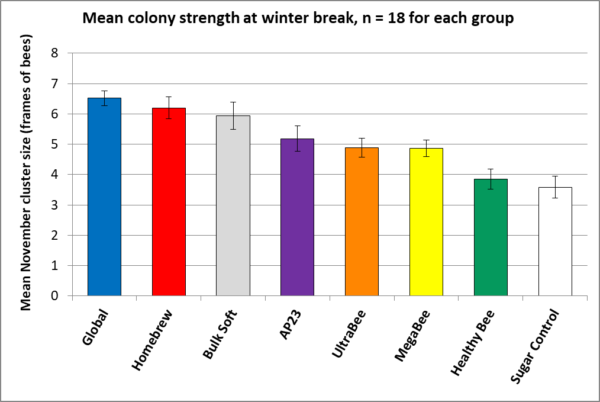
Fig. 2 The larger cluster sizes of the colonies fed the better subs, relative to the Sugar Controls, indicates the positive benefit from feeding pollen sub (a t-test p-value < 0.00001 for Global vs. Control, thus validating the experimental design). The relatively small standard errors indicate that the differences in performance relative to diet type are meaningful. The above data matched our field observations as far as colony preference for (consumption wise), and performance in response to, diet type — with the blue, red, and silver treatment groups being standouts (note that only two of those three diets contained natural pollen).
Practical application: As we’ll see next month, the cluster size of a colony going into winter made a big difference on how they build up for almond pollination. Keep the above ranking of performance of the subs in mind.
OK, now that you’ve got the ranking of how the diet type affected colony performance as far as cluster size at the midpoint, let’s see how diet affected the biology of the bees.
VINCE’S LABORATORY ANALYSES AT THE MIDPOINT
We put a lot of field work into this comparative trial of the diets. But this wasn’t just a test to see which subs were “best,” but rather an opportunity to learn why some diets perform better than others. At the grading in early November, I froze samples of workers vacuumed from the top bars of the broodnests. Vince and his technician Steven Tyler Williams performed weight and molecular analyses on the sampled bees, as well as sending samples of the patties out for nutritional analysis.
At the USDA lab, they removed and dried the heads and thoraces of 15 bees from each sample, and weighed them as a group. This allows us to compare individual bee glandular and muscular development to colony cluster size as a result of being fed each diet (Figure 3).
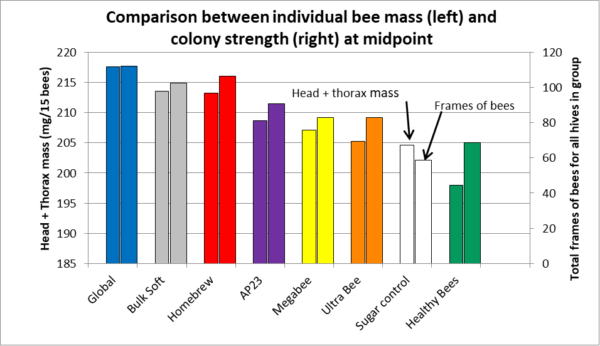
Fig. 3 Average individual bee mass (weight) closely correlated with colony strength (R2 = 0.80 [[1]]), indicating that what’s nutritionally good for the individual bee is good for the colony as a whole.
Practical application: Head and thorax weights are often used as the metric for laboratory studies on bee diet quality; the data above support that assumption. I’ll discuss this in greater depth in a subsequent article.
PATTY CONSUMPTION
Since an artificial diet is of little value if the bees aren’t stimulated to consume it, a question to answer is whether the bees treated the offered patties as food, or as junk to be removed from the hive. The only diet type that we saw being discarded to any extent was the Healthy Bee with thyme oil. Conversely, it was no surprise that the two patty types containing natural pollen were consumed quickly and completely. However, note that the other diets were not far behind (Figure 4).
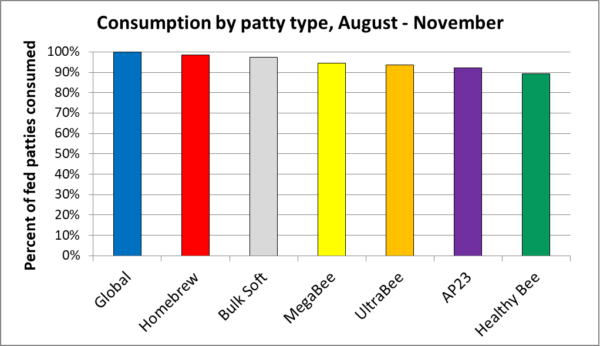
Fig. 4 The bees preferred some formulations over others, but at least 90% of all patty types were consumed during this feeding period. Global and Homebrew, likely due to being 15-20% natural pollen, were the most quickly and completely consumed, but the others were not far behind. There were no appreciable yard-to-yard differences in overall patty consumption — 95% and 96% at the E and T yards; and 97% at the H yard (which was fed 2 lbs. more).
Practical application: Although the bees consumed some subs more eagerly than others, it doesn’t appear that there was a big enough difference in consumption between diet types to account for the differences in colony performance at the midpoint, and reduced consumption may have partially been a function of colony size.
WHY WERE SOME SUBS MORE (OR LESS) PHAGOSTIMULATORY?
The scientific term for stimulating an organism to eat is “phagostimulation” — “phago” meaning “to eat.” So what makes an artificial diet phagostimulatory to the nurse bees (the workers that actually consume the patties)?
BACKGROUND
Although some researchers have proposed that nurse bees can differentiate diets by nutritional quality, I find their arguments unconvincing. On the other hand, in a highly-informative study, Vanessa Corby-Harris [[2]] performed a series of choice assays of natural and nutritionally-supplemented pollens, and came to the conclusion:
… that nutritional value plays a minimal role in nurse bee diet choice … although certain pollens provide a greater benefit per unit of consumption, honey bee nurses either cannot or do not discriminate among pollens based on nutrition.
Practical application: I’m not convinced that bees can tell whether a diet is nutritious or not by taste or smell. But you must make any artificial diet smell or taste “good” to the patty-consuming nurse bees, in order to encourage them to eat it.
Side note: Having recently lost all sense of taste for some months due to radiation treatment of my tongue, I can attest to the importance of sensory phagostimulation to induce what we’d call “the desire to consume” any particular food choice.
I and others have observed that bees clearly have preferences for some natural pollens over others. Each of the patty types smelled different to my human nose, so I don’t doubt that odor was a factor in nurse feeding preference for the tested subs.
NATURAL POLLEN AS A COMPONENT
Back in 1973, USDA researcher Lonnie Standifer found, not surprisingly, that the addition of 5% natural pollen to their tested artificial diet improved consumption and the amount of brood reared, but that there was not much gain from increasing the proportion to 20% [[3]]. Standifer concluded that:
The better performance of colonies fed rations containing pollen may occur because of feeding stimulants present in the pollen rather than because the rations containing no pollen lack nutrients.
Schmidt and Hanna [[4]] later determined that there are a suite of phagostimulatory compounds in pollen. Not surprisingly, in this trial the bees eagerly consumed the two products containing natural pollen, but some of the completely artificial diets were also quickly consumed by the bees. The Global patties are advertised as containing 15% natural pollen (irradiated against pathogens); the Homebrew patties contained 20% pollen by dry weight. The addition of natural pollen to those products means that they were technically “pollen supplement” or “pollen extender” formulations, rather than pollen substitutes (completely “artificial diets”).
It’s well-known that colonies respond well to patties of trapped pollen moistened with sugar syrup. But natural pollen is expensive, may contain agricultural chemicals, can vary greatly in nutritional and phagostimulatory value, and if not sterilized, can transmit the full spectrum of bee pathogens.
Practical application: I’ve got nothing against using trapped pollen for feeding bees, but true “pollen substitutes” are artificial diets that do not contain bee-collected pollen as an ingredient, which allows them to be more standardized and less expensive. Some of the tested artificial diets performed nearly as well as products containing natural pollen, which is very encouraging.
FEEDING ATTRACTANTS OR DETERRENTS
Some of the subs contained lemongrass oil, which contains one of the components of honey bee orientation pheromone (citral). I’m not clear as to whether lemongrass oil is phagostimulatory or merely attracts the nurses to the proximity of the patty. At least one sub also contained spearmint oil and thymol.
One must be careful with essential oils in diets, since bees are strongly repelled by some aromatic essential oils. The Healthy Bee patties that I tested were quite aromatic with thyme oil, which may have unfortunately acted as a feeding deterrent to the bees (and also to Small Hive Beetle). I showed a photo in my previous article of how the bees dragged Healthy Bee patty out of the hive.
MOISTURE AND TEXTURE
The bees seemed to prefer moist patties over drier patties. The tested subs varied widely in texture and moisture content. (I strongly suggest to the manufacturers that they wrap their subs in plastic bags, so that they don’t dry out during storage.)
Vince also had a commercial lab analyze the patties for protein, amino acids, lipids, and sugars. Let’s see whether the amounts of those elements affected how well the bees “liked” the patties.
SUGAR CONTENT
We all know that bees like sugar. And if there is either a natural pollen flow occurring, or if the bees don’t like something about an artificial diet, they will often just suck the sugar out of a patty, and remove the remainder as trash. So how much sugar was in the tested subs (Figure 5)?
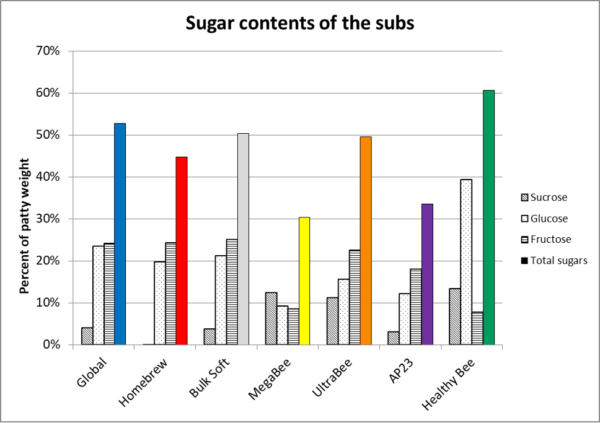
Fig. 5 I ordered the subs from left to right by consumption preference as in the previous graph. The patties ranged from 30% to 60% sugar content. Note that the sugar content did not correlate with consumption preference. Despite AP23 and MegaBee both having low sugar contents, they were still well consumed. Apparently, a high sugar content is not necessary for an artificial diet, nor does it guarantee rapid consumption.
The breakdown of the sugars indicates that most formulations used high-fructose corn syrup (consisting of fructose and glucose) as the main sweetener, likely not only due to its low cost, but because it makes for a patty that maintains its soft texture. Most also contained a lesser amount of sucrose.
PROTEIN CONTENT
The main purpose for feeding pollen sub is to provide protein to the nurse bees. But protein content did not correlate with how well the patties were consumed or performed (Figure 6).
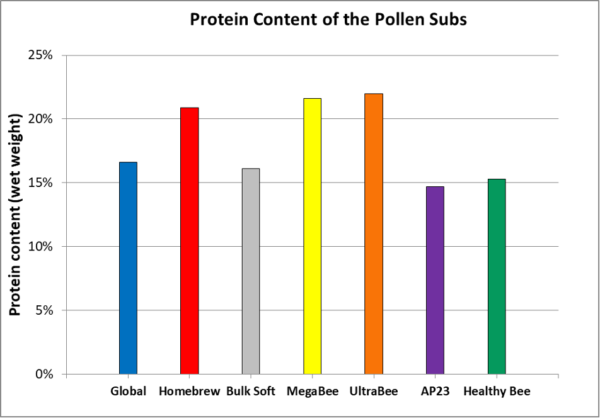
Fig. 6 The diets are ranked from left to right by consumption (from Figure 4). The protein concentration did not correlate with consumption, nor (as we’ll see further along) with performance.
Practical application: The colonies clearly didn’t consume patties according to their protein contents. A strong shot of protein may allow a burst of colony growth [[5]], but as we’ll see, over the long term patties with only 15% protein can perform as well as those with over 20%. This is important to know, since protein is typically the most expensive component of pollen subs. But as I’ll elaborate upon in a subsequent installment, our results suggest that more important than total protein is the balance of the essential amino acids.
LIPID CONTENT (INCLUDING ESSENTIAL FATTY ACIDS AND STEROLS)
Natural pollens vary in their lipid contents, but generally fall within the 3-10% total lipid content range, with the pollen of the bee-attractive and nutritionally complete clovers and mustards falling into the 6-10% range [[6], [7]]. So how important was lipid content as far as consumption? See Figure 7.
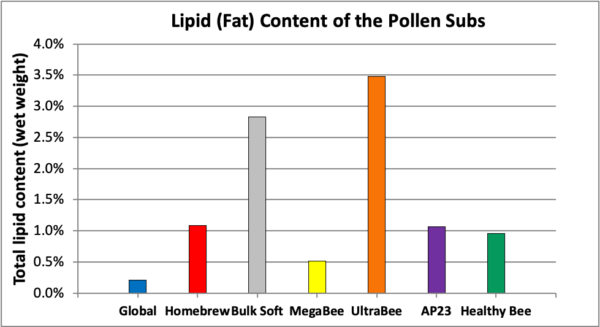
Fig. 7 Again shown in order of consumption. Cleary lipid content did not define how phagostimulatory the subs were. Most surprising to us was that Global, which was one of the most quickly consumed patties, had by far the lowest lipid content.
Australian researcher Rob Manning tested a number of vegetable oils as phagostimulants [[8]], and my own observations are that canola and corn oil appear to be attractive to bees. Vegetable oil may also be added to improve the texture of a sub. The chart above indicates that the manufacturers don’t agree upon how much oil in a diet is optimum.
Practical application of the above findings: Well, it sure didn’t appear to be the sugar, lipid, or protein proportions of the patties that defined how phagostimulatory the formulations were. So based upon these results, it would be hard to come up with any rules of thumb for how to formulate an artificial diet in order to stimulate consumption, other than having enough sugar, and some scent or taste components that are phagostimulatory to the nurses.
MOLECULAR ANALYSIS OF THE GUT MICROBIOME
We’ve heard a lot about how important the gut microbiome is to our health and that of our bees. Vince focused on the “core” microbiome bacterial types since these constitute 90+% of all bacteria in the gut and have functional significances linked to physiology and health (Figure 8).
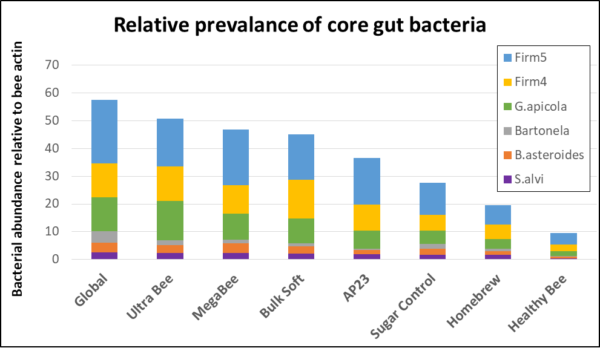
Fig. 8 Of interest is that one might expect to see the greatest amount of core gut bacteria in the two groups fed patties containing natural pollen, but that was only the case with Global. Surprisingly, bees fed Homebrew, with even a greater proportion of pollen, had only a third the amount of bacteria present in Global — and even less than the sugar controls. The thyme oil in Healthy Bee may not have been friendly to the gut microbiome — a result that Vince is currently following up on with laboratory experiments.
The last observation is of interest, since Vince has previously shown that spirulina has great potential as a component of artificial diets [[9]]:
Spirulina diets produced biomarker profiles (thorax weight, head protein content, and beneficial gut bacteria abundance) that were indicative of elevated nutritional states, meeting or exceeding the other diets in some metrics despite reduced consumption.
Practical application: We strongly suspect that it was the added thyme oil in Healthy Bee that negatively affected consumption, head and thorax weight, the gut microbiome, as well as overall colony performance. The last thing that we want to do is to trash spirulina as a potential bee feed component. I’ve been in regular contact with the manufacturer of Healthy Bee, who informed me as I was typing these words that they now offer a Healthy Bee formulation free of thyme oil [[10]].
Although the two extremes in the above graph correlate with colony performance, that’s hardly the case for those diets lying between. Note, however, no matter what the diet type or whether it contained natural pollen, the relative proportions of the core bacterial groups remained consistent.
Practical application: The core microbial gut community appears to be able to maintain proportional homeostasis despite the diet formulation or the presence of natural pollen. That’s good news for the development of artificial diets. Why the bees consuming Homebrew had only a third as many core bacteria as did Global remains an open question, but since it did not hamper Homebrew’s performance, perhaps the amount of bacteria in the gut is not that critical. It is important to keep in mind that gut microbiome dynamics are complex, with their relationship to foraging environment and food sources still poorly understood.
NOSEMA CERANAE
The bee midgut (where pollen sub is actually digested) is also where Nosema ceranae reproduces. In the sampled bees, there was great yard-to-yard and sample-to-sample variation, which prevents us from drawing firm conclusions as to diet type and nosema. However, it occurred to me that since nosema infection intensity generally reflects the amount of pollen that the bees are consuming [[11], [12]], that the amount of nosema in the sampled bees might correlate with the protein concentration of the diet that they had been consuming. That appears to indeed be the case (Figure 9).
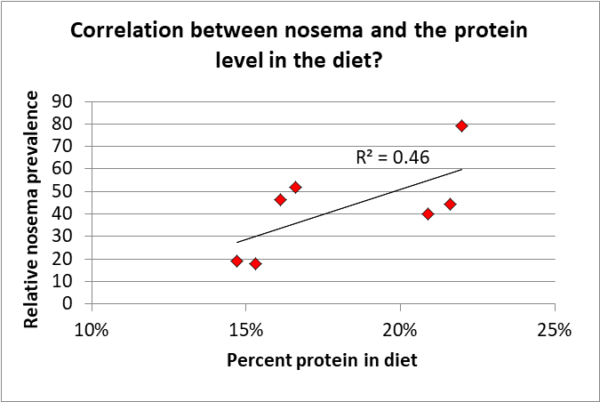
Fig. 9. The trial was not set up to specifically answer this question, but the data certainly suggests that the infection intensity of Nosema ceranae correlated with the amount of protein in the diet.
Practical note: Beekeepers freak out about nosema spore counts, not understanding that spore counts go up relative to the amount of pollen that the bees are consuming. At the same time, the increased nutrition from the pollen largely offsets the negative effects of nosema infection in the bees. This likely also applies to the feeding of pollen sub — spore count will go up, but the bees will still benefit from the supplemental diet.
THE EFFECT OF OXALIC ACID TREATMENT
Not being one to miss an opportunity to squeeze some extra information out of a data set, it occurred to me that all the colonies in the trial had been treated continually with extended-release oxalic acid at a low level [[13]] — that is, except for eight potential breeder colonies spread throughout the yards and fed the same diets, but never having received an oxalic treatment. Aha, I thought, perhaps we can gain some insight into the question of whether extended exposure to oxalic acid affects the gut microbiome (Figure 10).
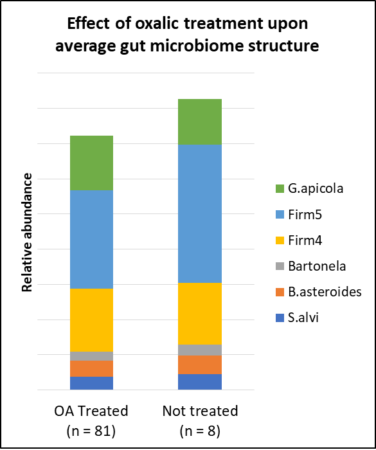
Fig. 10 The trial was not set up to answer this question, and there were not enough samples in the untreated group to draw a firm conclusion, but the above data suggest that extended exposure to a low level of oxalic acid does not adversely affect the gut microbiome of the treated bees.
Practical application: Good news!
OK, since I’m on a roll, Vince also performed qPCR to determine the relative abundance of DWV-A in the same bee samples (low-dose OA-treated vs. untreated near-zero-mite breeders). We frequently monitored the OA-treated hives for varroa, and mite wash counts rarely exceeded a 2% infestation rate. Despite those low infestation rates, the differences in their relative levels of DWV-A in November is striking (Figure 11).
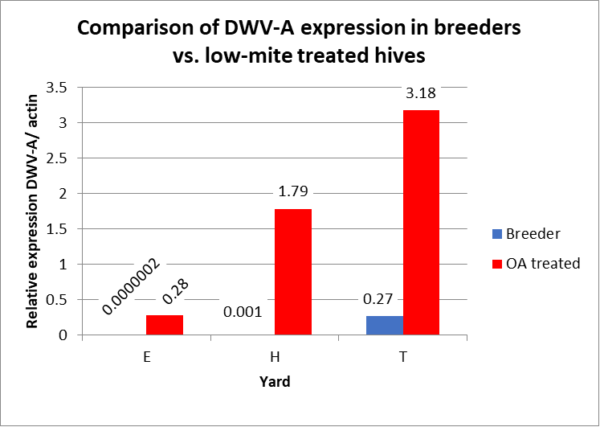
Fig. 11 We were surprised by the huge differences in DWV-A level between the low-mite OA-treated hives, and the few potential breeders that kept mite counts to zero by themselves. Since the DWV levels of the E- and H-yard breeders are too low to show in this non-logarithmic graph, I just put the relative expression numbers above where their blue columns would be. Qualifier: Again, there were only 8 mite-resistant colonies, but their average virus expression levels were anywhere from eleven to over a million times lower than the averages of the analyzed other hives in the same yards.
Practical application: The workers in the varroa-resistant colonies had strikingly lower Deformed Wing Virus levels than did those in the low-mite treated hives. We gotta get serious about selecting for varroa-resistant bee stock!
Molecular analyses such as those above may help us to understand why and how different diets might affect worker physiology and their microbiomes, and how that relates to colony performance.
TAKE HOMES AT THE MIDPOINT
So what have we learned so far?
- The bees consumed most of the diets well, although some were a bit more phagostimulatory than others. Although the bees clearly “liked” natural pollen, it wasn’t a necessary component of a successful diet.
- Total protein in the 15-20% range appears to be adequate, but note that researchers at the Tucson lab found that a 23-30% protein diet worked better than 10% or 50% [[14]].
- Most diets contained sugars in the 50% range (wet weight), but colonies consumed MegaBee well despite it containing only 30% sugars.
- One thing that comes to mind is the necessary protein to carbohydrate (P:C) ratio in a bee diet, the carbohydrate portion consisting of sugars. Royal jelly, the sole diet of young larvae or the queen, has a P:C ratio between 1:1 and 1:2 [[15], [16]]. For newly-emerged workers or nurse bees producing jelly (critical for colony buildup), it’s likely in the range of 1:2 – 1:5. But for foragers (which only require tiny amount of protein for body maintenance), it jumps to something in the vicinity of 1:250. So if one is feeding pollen sub for colony buildup or preparation for winter, the P:C ratios of current pollen subs appears to be in the right ballpark (18% protein and 50% sugar is a 1:2.8 ratio), with the bees able to balance any additional need for sugar by consuming honey or fed sugar syrup.
- HFCS is typically used as the main sugar source, since it maintains patty texture. The optimal amount of sucrose is not clear (if it is necessary at all). So I consider the ideal sugar formulation of a sub to remain an open question.
- It was extremely surprising to us how eagerly the colonies consumed, and how well they performed, on Global, despite it containing only 2% lipids.
- One important question was whether there is a need for pollen exines as a prebiotic for the core bacterial gut microbiome — or do the fiber and complex carbohydrates of the soy meal, corn gluten meal, or brewer’s yeast typically used as protein sources of a diet serve the purpose? Our analysis indicates that the core bacterial microbiome structure remained consistent despite the presence or absence of pollen, or even with the different artificial diet formulations, which is likely good news. In addition, bacterial abundance did not correlate with colony performance, thus making us question whether the amount of bacteria is that important.
- Going into winter, the colonies fed the better subs had clusters half again larger than the Controls, consisting of workers with better-developed heads and thoraces (regrettably, we didn’t measure fat body development). As we’ll see, this gave them an important head start when they began late-winter broodrearing for spring buildup.
TO BE CONTINUED…
OK, you’ve seen the results up to the midpoint, but don’t draw any conclusions yet! After winter break, the “winter bees” reared on these artificial diets then had to build up when we resumed feeding the same diets, prior to going to almonds. This is when the rubber hit the road, and the true performance of the diets became apparent. I’ll also perform a cost-benefit analysis, and then in a following installment suggest why some subs were able to outperform others.
NOTES AND CITATIONS
[1] Not shown is that I ran a linear regression of the data.
[2] Corby-Harris, V, et al (2018) Honey bee (Apis mellifera) nurses do not consume pollens based on their nutritional quality. PLoS ONE 13(1): e0191050.
[3] Standifer, L, et al (1973) Influence of pollen in artificial diets on food consumption and brood production in honey bee colonies. Am. Bee J. 113: 94-95.
[4] Schmidt,J & A Hanna (2006) Chemical nature of phagostimulants in pollen attractive to honeybees. J Insect Behav 19: 521–532.
[5] http://scientificbeekeeping.com/a-comparative-test-of-the-pollen-sub/
[6] Dong, J, et al (2015) Fatty acid profiles of 20 species of monofloral bee pollen from China. Journal of Apicultural Research 54(5): 503-511.
[7] Manning, R (2001) Fatty acids in pollen: a review of their importance for honey bees, Bee World, 82(2): 60-75.
[8] Manning, R, et al (20100 Added vegetable and fish oils to low-fat pollen diets: effect on honey bee (Apis mellifera L.) consumption. Australian Journal of Entomology 49: 182–189.
[9] Ricigliano, V & M Simone-Finstrom (2020) Nutritional and prebiotic efficacy of the microalga Arthrospira platensis (spirulina) in honey bees. Apidologie 51: 898–910.
[10] https://www.healthybeesllc.com/post/back-to-the-roots-of-nutrition-our-new-formula
Field testing of our product without essential oils began around a year ago with commercial beekeepers. So far, the feedback has been great. Even greater royal jelly production than the original, better consumption and “fluffier bees”. Which I normally correlate to good individual physiology due to nutrition…So now we are proud to offer a strictly nutritional version of our product, formulated to provide superior gut health along with nutrition.
[11] Zheng, H, et al (2014) Spore loads may not be used alone as a direct indicator of the severity of Nosema ceranae infection in honey bees Apis mellifera (Hymenoptera:Apidae). J. Econ. Entomol. 107(6): 2037-2044.
[12] Jack, C, et al (2016) Effects of pollen dilution on infection of Nosema ceranae in honey bees. Journal of Insect Physiology 87:12-19.
[13] I had a Pesticide Research Authorization to do so.
[14] Herbert E, H Shimanuki, D Caron (1977) Optimum protein levels required by honeybees (Hymenoptera, Apidae) to initiate and maintain brood rearing, Apidologie 8, 141–146.
[15] Garcia-Amoedo L & L de Almeida-Muradian (2007) Physicochemical composition of pure and adulterated royal jelly. Quim Nova 30(2):257–259
[16] Helm, BR, et al (2017) The geometric framework for nutrition reveals interactions between protein and carbohydrate during larval growth in honey bees. Biol Open 6(6): 872–880.


