
A Study on Bee Drift and Mite Immigration: Part 5

August 6, 2023
Contents
A Deeper Look into our Data. 1
Was Robbing Involved with Mite Immigration?. 6
A Study on Bee Drift and Mite Immigration
Part 5
Randy Oliver
ScientificBeekeeping.com
First published in ABJ June 2023
There was clearly drifting of bees from the collapsing colonies, with them presumably carrying hitchhiking mites. But averages and statistics are not nearly as informative as looking at the data from each individual hive.
A Deeper Look into Our Data
Question: Is mite immigration steady or episodic?
Let’s look at the semi-weekly mite drop counts over time for the Receiver hives, again broken down by distance from the Donors (Figure 1).
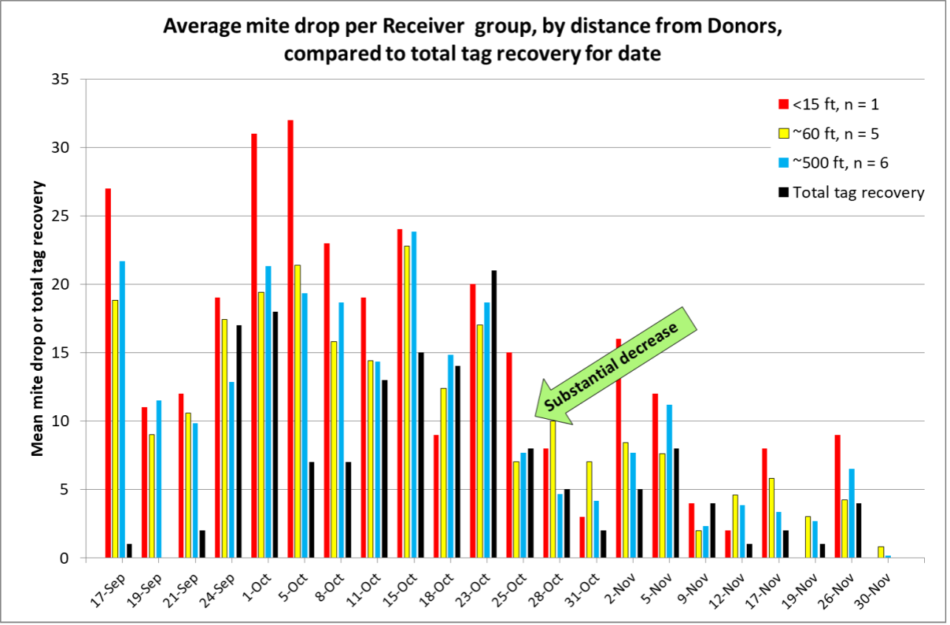
Fig. 1. Mite immigration followed a remarkably smooth and consistent curve, peaking in October (coinciding not only with Donors collapsing, but also when their mite levels peaked). The colored columns indicate the average semi-weekly per-hive mite drop for each distance group of Receiver hives; the black columns are the total number of drifted bee tags recovered on each date. The low initial rate of tag recovery is likely an artifact of us not beginning our tagging of young bees until 17 September, from which we wouldn’t expect any flight or drift until at least several days later.
The tall red columns indicate higher mite drops in the single Receiver at 15 feet, but surprisingly, there wasn’t much difference in average mite drops between the 60- and 500-foot groups of Receivers.
Also note the substantial decrease in mite immigration beginning on 25 October. It didn’t appear to be any change in the weather (Figure 2).
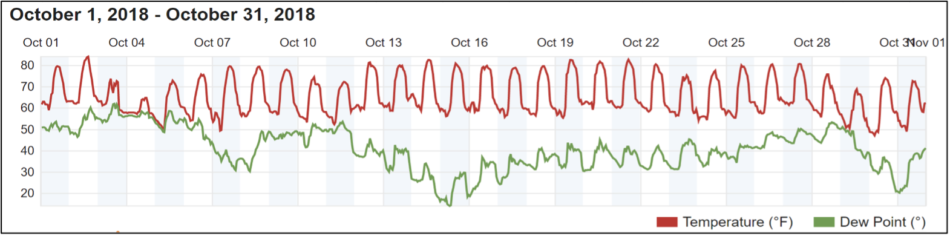
Fig. 2. Days were warm and sunny throughout the duration of this study.
One thing that had changed was that the high-mite Donors had largely collapsed by that time, so the amount of apparent mite immigration did appear to coincide with the two episodes of Donor colonies collapsing.
Question: How closely did mite immigration correlate with the drifting of tagged bees?
The black columns in Figure 1 indicate that there was often a correlation between the drifting of tagged bees and mite immigration. But since we were intentionally tagging bees during the process of each Donor colony collapsing, it’s not surprising that there would be a correlation. So let’s break the data down by hive (Figure 3). (Reminder on hive numbering: D1 means Donor #1; R1 means Receiver #1).
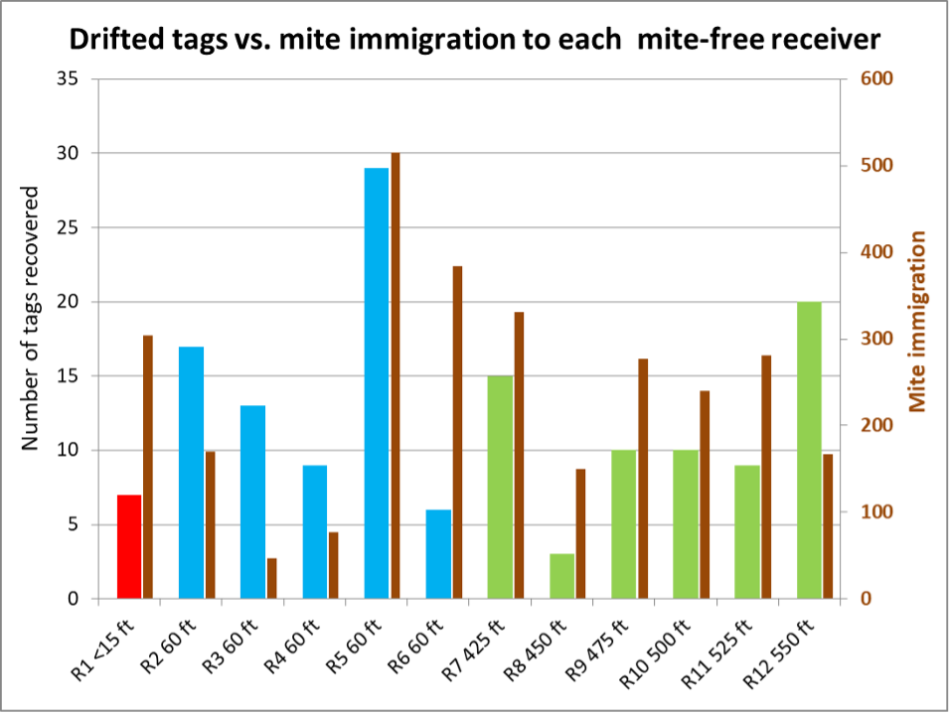
Fig. 3. For some Receivers, the correlation between mite drop and incoming drifted tagged bees was strong; for others it was weak. So it’s difficult to draw conclusions (especially since the chance of a drifted bee carrying one or more mites is likely random). Again, since we tagged such a low percentage of bees per Donor, it’s not clear whether the immigrated mites came mainly from the Donors, or from unknown colonies (managed or feral) in the neighborhood.
An important qualifier as far as considering this as a longitudinal study: This study was set up to determine whether the relatively-sudden increases in mite infestation rates in our colonies was due to mite immigration, and from colonies at what distance. For that reason, we intentionally tagged bees in the Donor hives when we observed that their mite levels were peaking and they were undergoing the process of collapse. Thus the overall correlation between tagged bee recovery and mite immigration is likely at least partially an artifact of the timing of when we tagged bees. So although the mite drop counts qualify as a longitudinal study, our tag recovery data are skewed by our uneven tagging of bees week by week. Thus the emigration of our tagged bees may not reflect the actual timing and rates of emigration of the number of untagged mite-carrying bees that drifted to the Receivers (and their associated transfer of mites).
Interpretation: It’s not clear whether the drifting of tagged bees (and mites) was the result of simple diffusion of bees drifting in both directions (Donor-to-Receiver and Receiver-to-Donor), or rather due to there being an increased exodus of bees from colonies as they collapsed. Nonetheless, despite the wide hive-to-hive variations in the total drifted tag recoveries and total apparent mite immigration over the course of the entire study, it may help to break that data down further.
Another way of looking at our data is to use a scattergram (starting on 1 October when we started to recover tags). This allows us to determine, for each hive check, the degree of correlation between the number of drifted tags, relative to the corresponding mite drop count for that specific time period, independent of calendar date (Figure 4).
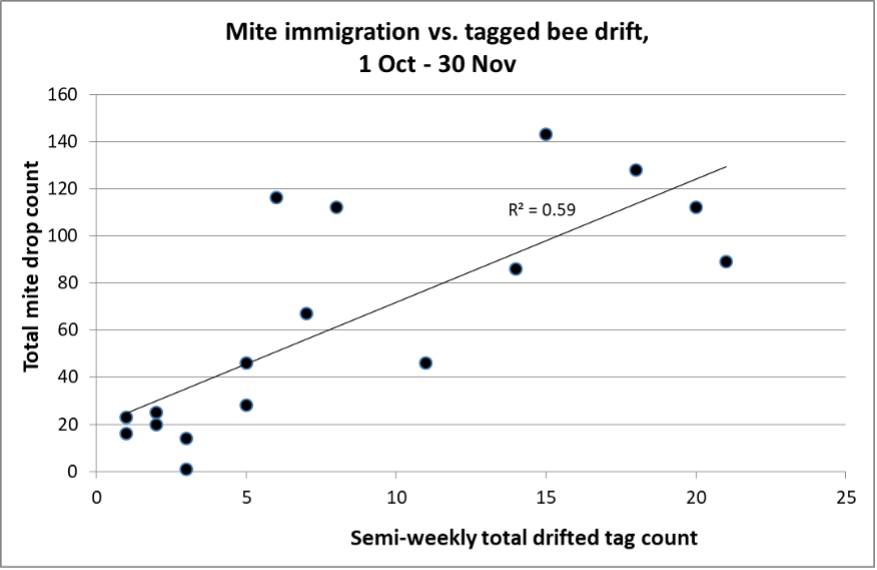
Fig. 4. Viewed this way, there was a remarkably strong correlation between the number of drifted tags from the Donor hives, relative to the number of apparently immigrated mites on the stickyboards (the counts are not ordered by date).
Since we don’t know for sure the source colonies for all the immigrated mites (and since the tagged bees represented such a small proportion of the Donor hive workers), it’s impossible to draw firm conclusions from this chart ― the correlation may well have been even higher if there had been no other colonies within flight range, or if we had tagged a larger proportion of the workers in the Donor hives.
Interpretation: Although tagged bee drift and mite immigration both coincided with the collapses of the Donor colonies, we didn’t begin tagging bees early enough, or consistently enough, to tell whether the process of collapse caused an exodus of drifting mite-ridden bees (Mite Bombs), or whether it was simply due to normal drifting. One would need to repeat the study ― tagging the same number of bees each week — to find out. In any case, it certainly appears that there was a strong correlation between the drifting of tagged bees and mite immigration. That fact suggests that the immigrated mites did at least largely come from the Donors, rather than from unknown hives, since those unknown colonies would have needed to have been shedding mites on the same days that our Donor hives were dispersing drifting tagged bees.
We can take even a closer look at our data, which I’ve broken it down in two charts — one for the close Receivers, the other for those in the 500-foot group (Figures 5 & 6). Remember that some Donors collapsed in mid-to-late September, the rest in mid-to-late October, which is reflected in the stickyboard counts (in this case ordered by date).
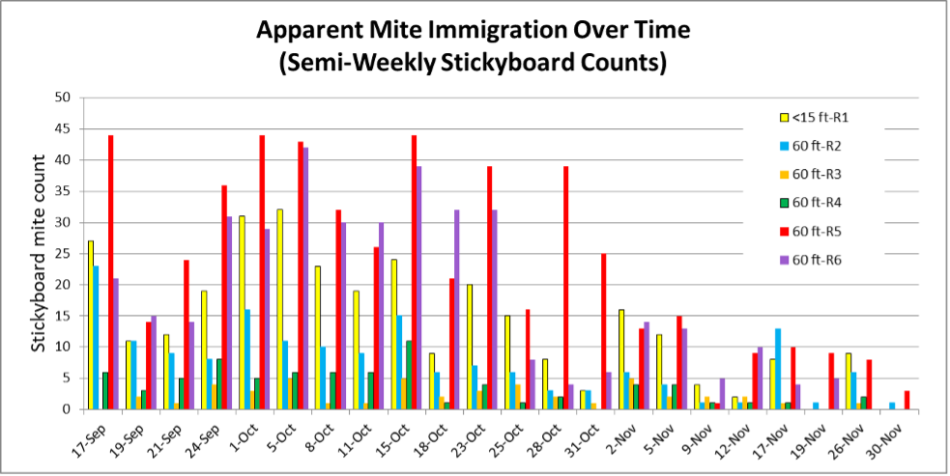
Fig. 5. For the Receivers located near the Donors, it appears that some were “mite magnets” (red and purple), whereas others suffered from little mite immigration.
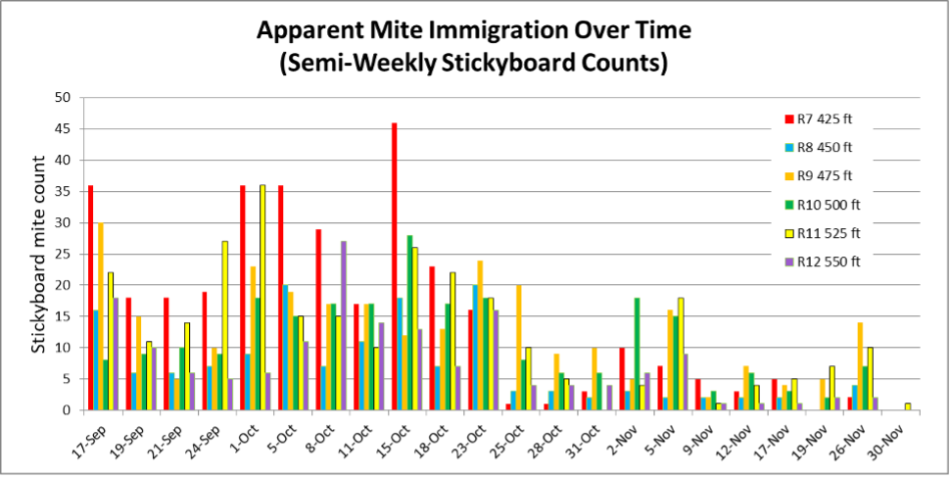
Fig. 6. Similar to the close Receivers, some of these more-distant Receivers consistently dropped more mites than others, independent of their distance from the Donors.
Interpretation: What surprises me is the consistency of the apparent mite immigration into some of the hives, whereas in others it would go up and down (as I would expect from random drift). And as far as my nagging question about whether the high-count receivers were generating their own mites, take a look at the sky-high stickyboard counts of R5 and R7 (red columns), which I inspected on 17 October, and confirmed that they were essentially mite free.
Note that by early November, the stickyboard counts dropped to very low numbers, despite there still being plenty of bee flight due to the weather remaining warm.
We have only one last question to go:
Was Robbing Involved with Mite Immigration?
Question: Did mite immigration Correlate with Robbing at My Location?
Earlier in this series I pointed out that although healthy colonies may rob mite-infested colonies if they contain ripening nectar at the time of their collapse, that didn’t happen here. We had placed scales under both our Donor and Receiver hives in order to see whether the Donors lost weight during collapse (which would indicate that they were being robbed), or whether the Receivers gained weight during our dearth (indicating that they had robbed a collapsing colony) (Figures 7-9).
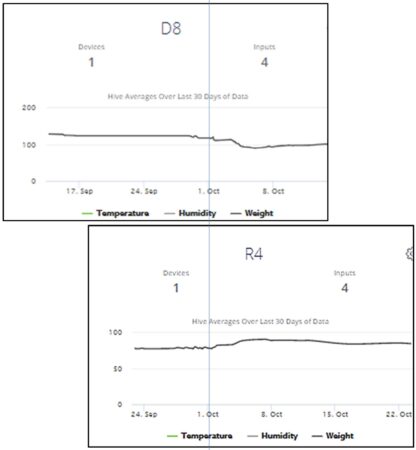
Fig. 7. An example of what I looked for ― a Donor losing weight at the same time that a Receiver was gaining it. I’ve aligned these two snips by date, to show D8 losing weight while R4 gained it. But looking back to Figure 5, one can see that R4 exhibited minimal mite immigration during that time period. So even if it was robbing, it wasn’t bringing back mites.
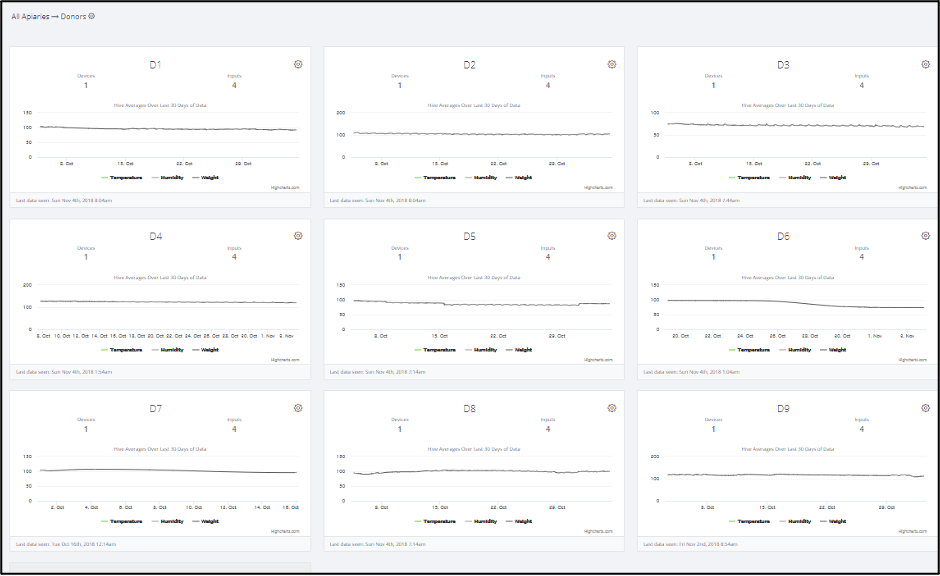
Fig. 8. A screenshot of scale data for the Donors [[1]].The only sudden weight losses that we observed were for Donor D6 and D8 (not shown in this chart) ― the rest of the Donors showed no indication of getting robbed during their collapse. But the bulk of those weight reductions may well have simply represented the body mass of the workers that abandoned the hive (the bees covering 8 combs weigh roughly 4 pounds).
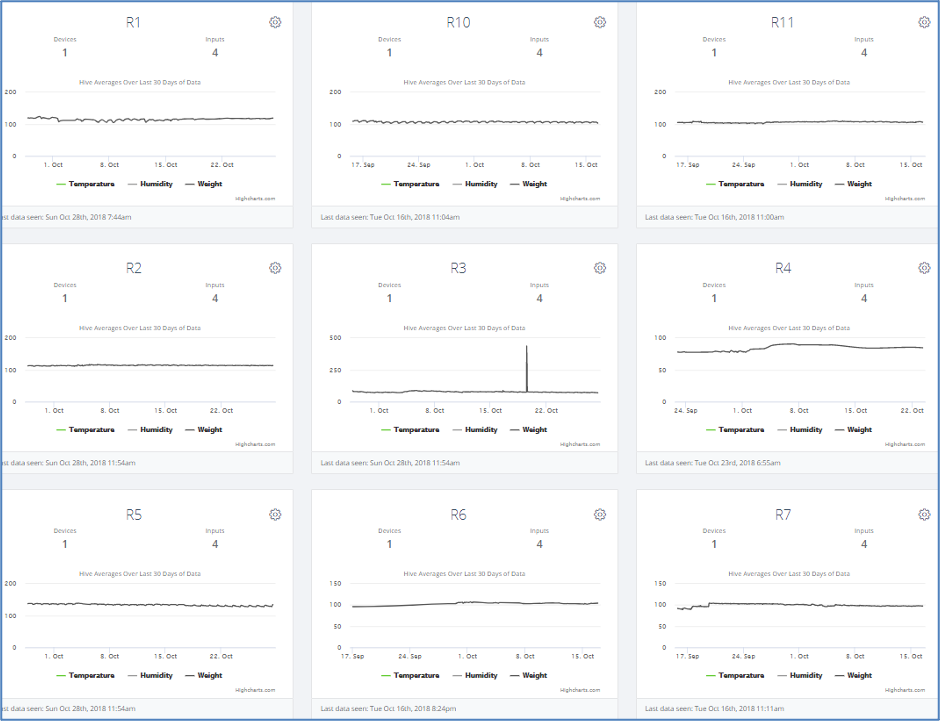
Fig. 9. A screenshot of typical scale data for the Receivers, with weight gains by R4 and R7.
Discussion on Robbing
In my arid climate ― in which there is no appreciable nectar flow in late summer — we saw no indication of weight loss due to robbing taking place as the Donors collapsed, nor any appreciable weight gains to suggest that the Receivers were robbing other colonies.
This is not to say that mite immigration can’t also be associated with robbing in areas in which robbing does take place as colonies collapse, such as where nectar is ripening in the hive at time of collapse.
Even in those areas, actual field data indicating that robbing is more of a factor than is drifting, is (to date) largely circumstantial. Although it “makes sense” that mites would exhibit a behavior to hop on robbing bees for a ride to a new host colony, one thing that I’ve found out over the years is that just because something “makes sense” to the human mind, that doesn’t necessarily mean that it actually takes place with honey bees. So let’s take a look at the evidence.
Ever since Del Piccolo [[2]] reported that mites “preferred” nurse bees over pollen foragers, apparently due to differences in their cuticular hydrocarbons, it’s been pretty well established that there is benefit for a mite to find a nurse bee to feed upon (reviewed by Xie [[3]]). My own testing [[4]] confirmed that non-flying (presumably young) workers typically exhibit higher infestation rates than do flying workers sampled from the same comb.
But Cervo [[5]], discovered (via GC-MS) that as the varroa infestation rate of a colony increased, the difference in odor between nurse bees and foragers disappeared, as did the preference of mites for nurses over foragers (as determined by host-preference tests in petri dishes). That finding would suggest that the mite infestation rate of foragers, relative to that of the nurse bees, would increase as the infestation rate grew — thus resulting in a larger number of mites on the older workers drifting from highly-infested colonies.
But what happens in the case of foragers from low-mite colonies robbing out high-mite colonies? Peck and Seeley [[6]] observed a circumstantial connection, leading us to wonder whether the mites in dying colonies recognize the robbers as being “foreign,” and then hop onto them in order to catch a ride out of their sinking ship (this would make “total sense” since it would aid in horizontal transmission). But alas, Cervo’s findings do not support that hypothesis — they found that mites “did not show any preference between homocolonial and heterocolonial foragers at any mite abundance of the colony.”
And in perhaps the only study in which mite levels on returning foragers were quantified, DeGrandi-Hoffman [[7]] found that:
We did not detect high proportions of [foragers with mites] during any sampling period as would be expected if foragers were robbing heavily infested collapsing colonies. Though increases in mite numbers due to robbing probably occur, our data suggest other possible explanations for unexpected growth in mite populations. [Foragers with mites] comprised at most 2–3 % of all the foragers we captured in a sampling interval.
DeGrandi-Hoffman’s study took place in Tucson, Arizona, where there are late-season nectar flows [[8]], so it’s not clear whether robbing was taking place. I encourage further research to explore the actual amount of mite transfer that takes place due to robbing!
Field Study Wrap Up
The weather finally turned cold in late November (Figure 10).
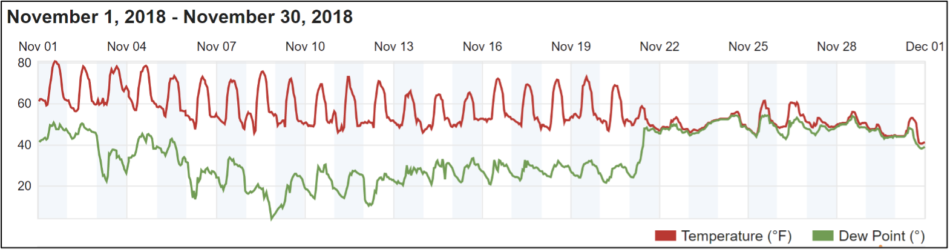
Fig. 10. Ambient temperatures remained high well into November
This gave me a chance to confirm that our Receivers were still mite free. We took our last two stickyboard counts on 26 and 30 November, during the interim in which it finally got cold (and rainy) enough to prevent bee flight (and thus mite immigration due to robbing or drifting bees). The stickyboard counts on the 26th were 9,,6,1,2,8,5,2,4,14,7,10,2. By the 30th they had dropped to 0,1,0,0,3,0,0,0,0,0,1,0. Again, strong evidence that the Receivers were not producing their own mites.
I also checked the Donors—all were devoid of bees, other than D4, D5, D7, and D8, which had tiny clusters just under the lid. And I only observed a single remaining tagged bee (in D8). With that, I wrapped up the study.
Review
So what are the take-homes from our study?
- I set up this trial to determine whether the late-season increase in mite infestation rates in our hives could be due from the drifting of bees from infested colonies outside our apiary. We found that there can be substantial bee drift into hives a ½ mile distant, and some drift to colonies a full mile away. Thus we now have hard evidence to support just how important it is to encourage your neighbors to manage varroa in their colonies!
- We counted nearly 3000 apparently-immigrated mites from our Receiver hives ― an average of 245 mites per hive. Those immigrated mites were not evenly distributed, but even in the hives receiving the most mites, those immigrated mites would only have increased the infestation rates of those colonies by about 1% (3 mites per half cup of bees). So even with 9 colonies collapsing in this apiary, we could hardly blame any large increases in mite wash counts in the surrounding colonies solely upon mite immigration from other hives.
- Other research has shown that a substantial percentage of workers may drift between hives in closely-spaced apiaries. In this trial we know from recovered tags that at least 4% of the bees we tagged drifted into the 21 hives that we monitored, but since there were also unmonitored hives in the area, that 4% figure is clearly an underestimate of the total amount of out-drifting that actually took place. Based upon the strong correlation between tag recovery and mite drop, there is reason to suspect that our sporadic tagging of bees (in an attempt to coincide with collapse), likely underestimated the true degree of drifting of mite-infested bees that actually occurred.
- There was far more drift to distant colonies than would be expected by chance. This finding is completely contrary to “common sense,” and shows how little we understand how and why bees drift. It also brings into question recommendations regarding the spacing of hives in an apiary to reduce drifting.
- There was a consistently large variation in mite immigration between hives that were side-by-side at various distances from the Donors, indicating that some colonies appear to be more (or less) attractive to (or willing to accept) drifting bees than others (although the amount of mite immigration did not necessarily correlate with the amount of entered drifted tagged bees).
- We observed that the most intense mite immigration into the Receivers took place when the Donor colonies were at their highest infestation rates (and also collapsing). It’s not clear whether mite immigration was mainly the result of infested workers abandoning colonies and seeking out other hives as they collapse (the “Mite Bomb” hypothesis), or simply due to the continual mite diffusion associated with “normal” bidirectional bee drifting.
- In our environment, without a substantial nectar flow occurring during the study, the collapsing colonies did not get immediately robbed, and there was no correlation between weight gain (indicating robbing) and mite immigration.
Update August 2023: I brought a number of colonies with very high mite counts (30-70 mites per half cup of bees) to my home yard in order to harvest live mites from them for my studies. To my dismay, a number of them got robbed out as their populations were collapsing. Since I was inspecting the colonies on a regular basis, I was able to closely watch the process of collapse and then robbing.
Once a colony reaches the DWV “tip point” (mite counts around 50 or above), its amount of brood starts to decrease, and the worker population begins to collapse rapidly (by up to two frames of bees per day). And once the cluster can barely cover three frames, in a crowded yard, robbing pressure can become too much (isolated colonies with only a handful of workers are able to defend themselves in my area). Once robbing starts, it explodes! No noticeable robbing in the morning, but within an hour of when it begins, the hive is mobbed by robbers. Although the colony’s workers valiantly attempt to repel the robbers, they get overwhelmed, and a double-deep hive is typically “cleaned out” of honey within a day or two.
The Aftermath
When I inspect the hive immediately after robbing ceases, the combs are devoid of honey, and much of the brood has disappeared. There are dead bees on the bottom board, but I do not know whether they were defenders or robbers. But there is often a remaining reformed cluster of live, hungry bees – they do not necessarily die or drift away. That cluster may represent a substantial proportion of the workers present prior to the initiation of robbing.
I was curious this morning when I inspected a colony that had been robbed out over the past two days, whether the remaining bees had given up their mites to the robbers. As much as I hated to sacrifice those poor survivors, I took a sample of a half cup of them and washed the mites off them.
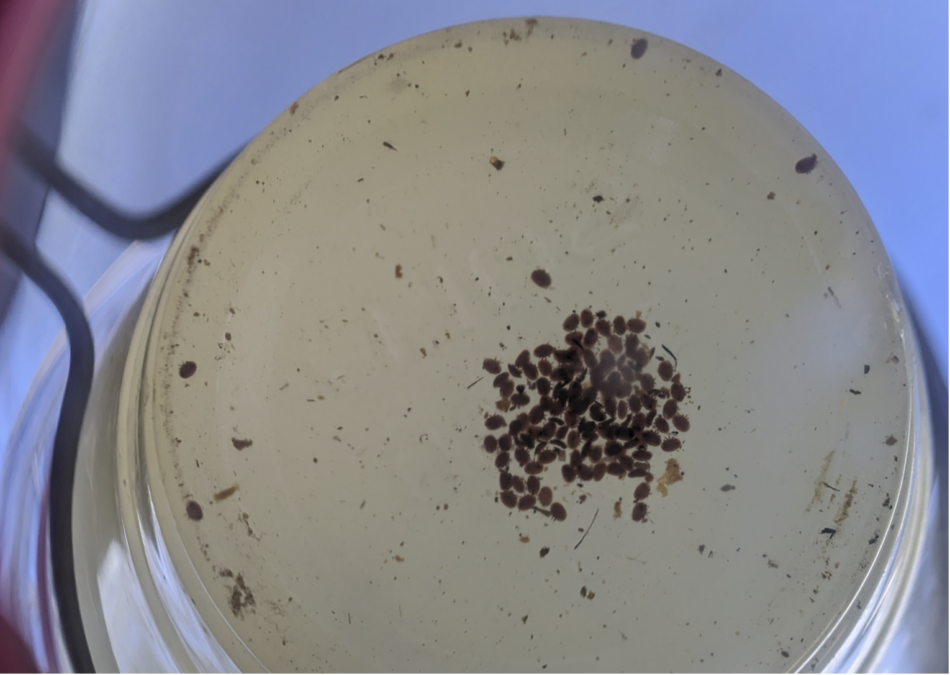
There were too many to count in a pile, so I divided them up and counted them twice. There were 117 mites on those approximately 315 bees! It appears that their mites had not hopped off on the robbers to any extent, since my mite wash count from the same colony a few days earlier had been only 44.
Next Month
My purpose for undertaking this study was to answer my question “Are the seemingly-rapid spikes in our mite wash counts in late summer mainly due to the immigration of mites from other hives?” That explanatory hypothesis is extremely attractive, since it puts the blame on someone else, rather than on one’s own inadequate varroa management. But I’m not sure that it holds water. Next month we’ll look at additional hard data, and run some simulations.
Acknowledgements
Thanks again to my helpers Brion and Alice Dunbar, Sandy Honigsberg, Anna Mudd, and Brooke Molina. And to Dr. David Peck for reviewing my data.
Citations and Notes
[1] Due to unfamiliarity with data preservation for the scale hives, we lost all our raw data when we removed the batteries from the scales at the end of the trial. Luckily, I had been following the weight data during the course of the trial, and had taken a few screenshots. I fully expected to see evidence of robbing correlating with mite immigration, but did not.
[2] Del Piccolo, F, et al (2010) Selection of Apis mellifera workers by the parasitic mite Varroa destructor using host cuticular hydrocarbons. Parasitology 137(6): 967-973.
[3] Xie, X, Z Huang, & Z Zeng (2016). Why do Varroa mites prefer nurse bees? Scientific Reports 6(1): 1-6.
[4] https://scientificbeekeeping.com/re-evaluating-varroa-monitoring-part-4/
[5] Cervo, R, et al (2014). High Varroa mite abundance influences chemical profiles of worker bees and mite–host preferences. Journal of Experimental Biology 217(17): 2998-3001.
[6] Peck, D & T Seeley (2019). Mite bombs or robber lures? The roles of drifting and robbing in Varroa destructor transmission from collapsing honey bee colonies to their neighbors. PloS one, 14(6), e0218392.
[7] DeGrandi-Hoffman, G, et al (2016) Population growth of Varroa destructor (Acari: Varroidae) in honey bee colonies is affected by the number of foragers with mites. Experimental and Applied Acarology 69(1): 21-34.
[8] Nightingale, J, et al (2008) Assessing honey bee equilibrium range and forage supply using satelite-derived phenology. In IGARSS 2008-2008 IEEE International Geoscience and Remote Sensing Symposium (Vol. 3, pp. III-763). IEEE.


