
A Study on Bee Drift and Mite Immigration: Part 6

October 16, 2023
A Study on Bee Drift and Mite Immigration
Part 6
Randy Oliver
ScientificBeekeeping.com
First published in ABJ July 2023
In our 2018 study in the California foothills, we confirmed that bees indeed drift from collapsing colonies to other hives, even to those at considerable distance. And that drifting can result in a substantial amount of mite immigration into those hives. But there’s surprisingly little hard data on how much mite immigration takes place in other settings.
It’s easy for beekeepers to blame rapidly-increasing mite wash counts in late summer or autumn on immigration of varroa due to drifting or robbing. But other than in the case of the robbing of a high-mite colony (which could result in mites catching a ride back on a robber), the normal hive-to-hive drifting of bees would be expected to have an overall effect of averaging the infestation levels of all colonies within flight range, rather than concentrating mites into only the well-managed hives. Although some colonies appear to be more attractive to drifting bees than others, the overall resulting mite drift would likely reflect the process of diffusion ― “the net movement of anything generally from a region of higher concentration to a region of lower concentration.”
The data from my home apiary that I showed in Part 4 of this series indicated an average immigration of only 245 mites per hive over a two-month period, despite having nine colonies collapsing from varroa in the same yard).
Practical application: That amount of immigration would barely be noticeable in a mite wash, since in a colony of 40,000 adult bees, assuming that half the immigrated mites wound up in the brood, those 245 mites, even if they had immigrated all at once, would have only increased the number of mites in a sample of a half cup of bees by a count of 1. So much for a “mite bombing” having taken place.
So although I’m suspecting that my sons and I can’t blame our August varroa spikes on bee drift, could it be plausible elsewhere? Something that really surprises me is the paucity of studies to quantify the actual amount of mite immigration typically taking place in different regions of the U.S. So in 2019 I put out a call for Citizen Science volunteers to collect mite immigration counts. I was disappointed that surprisingly few beekeepers responded. But those who did provided us with some valuable hard data ― thank you!
THE PROJECT
I provided the volunteers a protocol to follow [[1]], and my helper Brooke and I sent them packages of miticide strips and instructions, along with sample data sheets. As is usual with beekeepers unaccustomed to the amount of work involved in the setting up a field trial and collecting data, only a few were able to complete the necessary preparation and work. But I did receive good data from a range of localities.
VALIDATING THE METHODOLOGY
In order to quantify mite immigration, the protocol for this study involved proactively eliminating the reproducing varroa population from the hives — starting at least six weeks before data collection. This is done by simultaneously treating with Apivar and Apistan strips, which have two different modes of action (I’m currently also adding OAE sponges), and perhaps brood removal. As I pointed out in Part 4 of this series, one must then validate that the colonies to be monitored are actually free of mites. Such validation is not necessarily as easily confirmed as you might think!
The easiest and best way to confirm that a colony is free of mites is to monitor the sticky boards, but on days in which bees are flying, you can’t tell whether the dropped mites came from outside or inside of the hive. So for confirmation you need to check mite drop counts on rainy or cold days which prevent bee flight, thus eliminating the chance for mite immigration via drifting or robbing bees (as shown in Figure 8 in Part 4). But where I live, it doesn’t normally rain or get cold in the August-October time period during which we are concerned about mite immigration.
Another validation is that the mite counts drop to zero in November, which would certainly suggest that the hive is free of mites at that time, but doesn’t necessarily mean that the colony started free of mites at the beginning of data collection (since the extended-release miticides may cause a residual breeding population of mites in the colony at the start of monitoring to dwindle over time).
It occurred to me as I was writing this article that I should compare our mite drop counts to those of untreated Control hives in the same yard. Lacking those, I spent a couple of hours searching the internet for typical mite drop curves over the course of a season — I was surprised at how little data is actually published! (Please let me know if you know of any good data sets of natural mite falls in untreated hives over the course of a season).
One could perform sealed brood dissection, but that is tedious, and takes some practice, good lighting, and magnification.
So why not simple confirmation by a mite wash of a half cup of bees? To my surprise, a treated colony may exhibit mite wash counts of zero, but still be apparently producing substantial quantities of mites on its own (I’ll show an example next month). I highlighted “apparently” since out of a group of treated hives in the same apiary, one may continue to exhibit far higher daily (and consistent) mite drop counts than the rest — despite showing mite wash counts of zero day after day ― strongly suggesting that the colony is producing its own mites. One thing that I’ve noticed is that the location of the dropped mites on the sticky board may be an important clue (Figures 1 & 2).
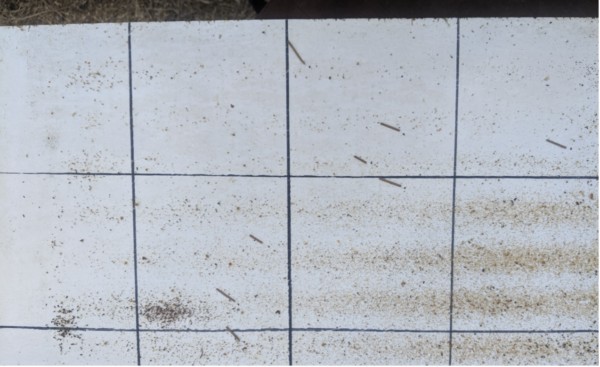
Fig. 1 In this photo of a sticky board, I placed pieces of grass stem pointing to each mite on the board. What we observe is that in a mite-free colony, mites that have come in via immigration (and are then rapidly killed by the miticides) tend to fall outside of the area directly beneath the broodnest, which is indicated by the rows of uncapping debris that fell between the brood frames.
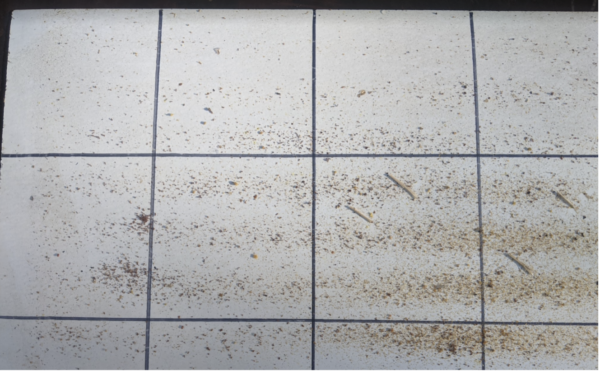
Fig. 2 On the other hand, on this sticky board the fallen mites are all directly beneath the brood area, leading me to suspect that mite reproduction was taking place in the hive.
I am greatly appreciative of the efforts put in by the volunteers involved with this study, and most of the data sent to me indicated that the monitored hives were indeed mite free (or nearly so). I censored the few mite count records that suggested that a colony was producing its own mites.
THE RESULTS
Let’s first take a look at the mite counts by Dr. Cahit Ozturk from the hot, dry, and sparse landscape of the Arizona State University Bee Lab (Figure 3).
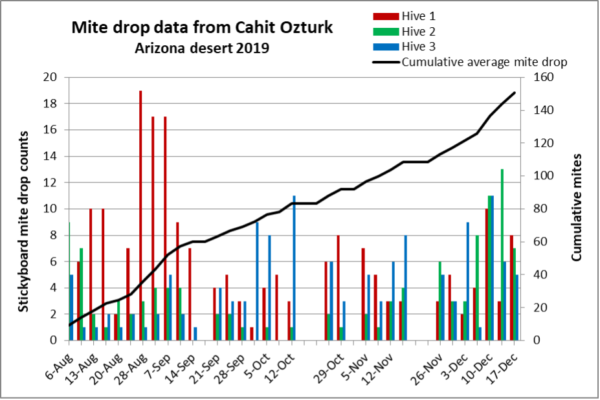
Fig. 3 Similar to my observations, there was large colony-to-colony variation in mite drops in Dr. Ozturk’s hives, as well as different curves for drop intensity. I checked the weather history for the time period, which indicated that temperatures were plenty warm for bee flight in November and December, but there was no precipitation. The average cumulative drop per hive was 151 mites — not a lot, but nearly continuous.
I asked Dr. Ozturk about the likely sources of the drifted mites; the university maintains around 100 European (and some captured feral) colonies under misted shade structures nearby. Now let’s move from dry Arizona to the moist coast of Maryland (Figure 4).
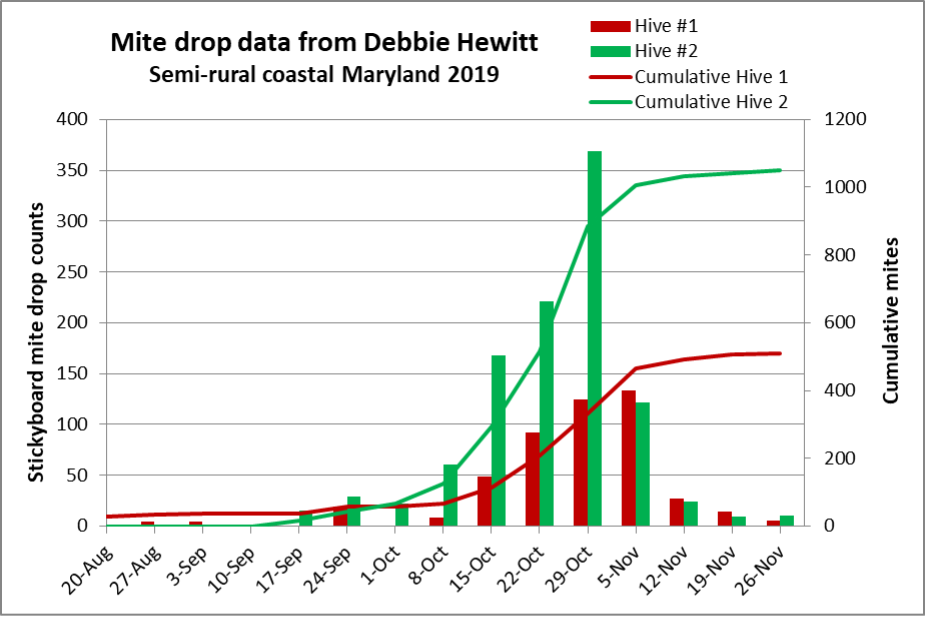
Fig. 4 Debbie Hewitt’s drop counts in moist, green coastal Maryland suggest that her hives were indeed mite-free prior to late-season immigration. One hive clearly took in more mites, so I broke down the cumulative count curves. Hive #1 got hammered with 1050 mites; Hive #2 with a bit over 500.
Practical application: In this case, Debbie could indeed say that her Hive #1 got mite bombed. A colony can generally tolerate a total mite population of 1000 going into winter. In Debbie’s location, it appears that even if her varroa management program involves a pre-winter treatment in early October, that a colony could get reinfested via mite immigration to a damaging level by the end of November. This is a perfect illustration of why ― once a colony goes broodless — the application of an early-winter treatment can be so important.
And now let’s move up to New York (Figure 5).

Fig. 5 Elwin Stillman monitored a single hive, starting with mite drop counts of zero until the end of June (great prep Elwin!). His mite immigration curve peaked earlier than did Debbie’s, as we would expect from his higher latitude. Although his hive clearly took in mites, it was not enough to make a big difference for varroa management.
There was another volunteer not far away in New York (Figure 6).

Fig. 6 Kyle Mulligan’s hives were not far from Elwin’s, and his counts also appear to reflect only immigration. Although the counts for the two hives did not peak at the same time, they both received nearly the same cumulative totals approaching 500 — maybe not enough to say that they were “bombed,” but clearly enough to indicate that he should include a “clean-up” treatment going into winter.
Let’s now return to California (Figures 7 & 8).
![]()
Fig. 7 I’ve visited Hal Liske’s well-managed apiary at his wonderful El Sol winery, and wouldn’t expect there to be much mite drift pressure.
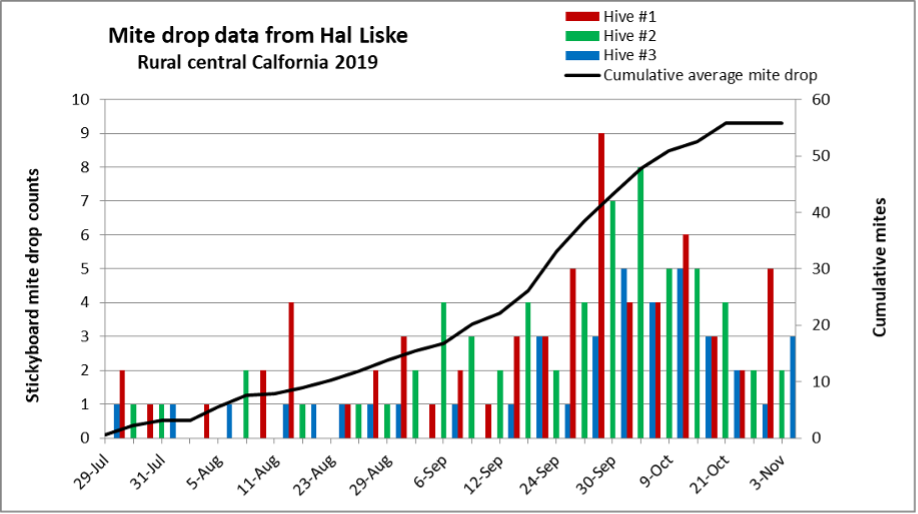
Fig. 8 Hal’s three monitored hives exhibited remarkably similar mite counts, and as expected, not much mite immigration.
Farther south of Hal is my longtime supporter Madeleine Mead (thanks Madeleine!), whose apiary is in a hot, arid, and sparse landscape with likely few surrounding colonies (Figure 9).
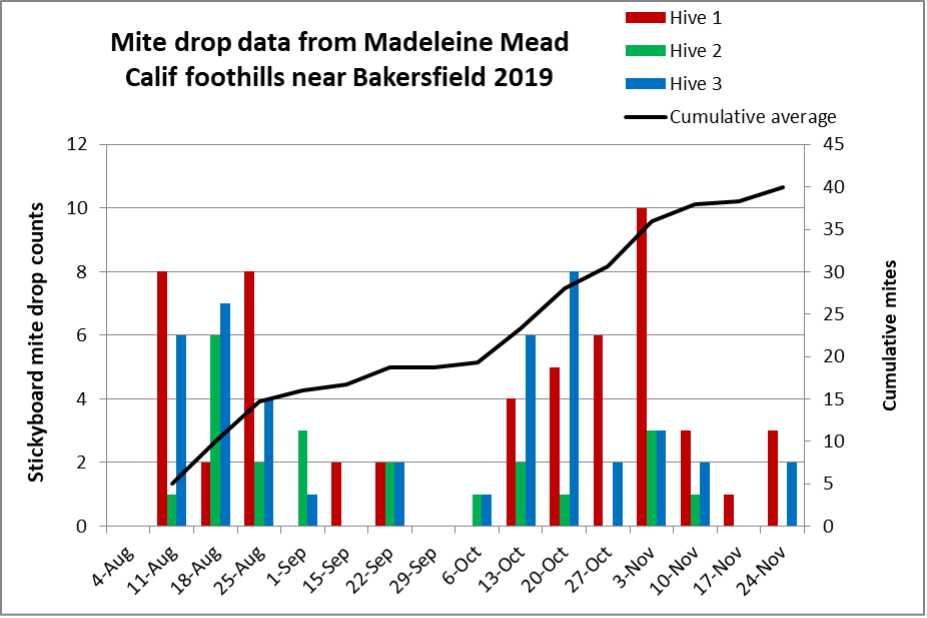
Fig. 9 Very few mites caught rides into Madeleine’s hives (lack of a color column indicates a zero count). I was curious about the near cessation of mite immigration in late September, so checked her weather history. The daily high dropped from 100°F to only 70, but there was no rain or wind, so I can’t explain. Mite immigration went back up during her warm October and immigration tapered off as the weather finally cooled at the end of November.
Practical application: A typical colony may emigrate far more mites every day on its own exiting workers who don’t return, than it receives from bees drifting in from other colonies.. Let’s do the math: From a colony in September, there are about 1000 bees a day flying off to die of old age. At a low mite infestation rate of even 1%, that would be 10 mites per day being flown out of the hive never to return. On only one day did any of Madeleine’s hives reach 10 incoming mites. That small amount of mite immigration would not be expected to tip the balance to any great extent.
DISCUSSION
Thank you volunteers ― the data that you collected was very informative!
The amount of mite immigration into the monitored hives in rural areas of the West was hardly enough to support the mite bomb hypothesis.
On the other hand, Debbie and Kyle’s apiaries on the East Coast, in areas in which I’d expect a lot of beekeepers and perhaps an abundance of feral colonies, not surprisingly exhibited far higher amounts of mite immigration, and they could legitimately say that they got bombed by mites (although it’s not clear as to whether any single colony was the bomb). Although I haven’t seen hard data, beekeepers in other urban areas where there are a bunch of beekeepers who don’t do a good job of managing varroa, tell me that mite immigration is a major issue for them late in the season.
Practical application: What with all the talk and blame among beekeepers about mite immigration into their hives, we could sure use more hard data such as that above for every region in the country. Let me know if you want to collect some!
Next month I’ll show the results of two experiments that we ran last year to test the effect of entrance guards on reducing mite immigration.
ACKNOWLEDGEMENTS
My great appreciation to my helper Brooke Molina, and volunteers Cahit Ozturk, Elwin Stillman, Hal Liske, Kyle Mulligan, Debbie Hewitt, Madeleine Mead, and Dave Munkvold.
CITATIONS AND NOTES
[1] https://scientificbeekeeping.com/mite-drift-quantification/


