
An Online Model for Varroa Management

April 14, 2022
An Online Model for Varroa Management
Randy Oliver and Trish Harness
First published in ABJ February 2022
Beekeepers worldwide have been using Randy’s Varroa Model with great success since its release in 2017. But there has been a demand for an online version that did not require Excel, and could be used on a cell phone. Trish started working on such an app in 2018, and now has it ready for release!
No single varroa management strategy is appropriate for every beekeeper, since we keep bees in dissimilar climates, with short or long brood breaks, diverse colony population dynamics, various treatment windows of opportunity, preferred mite treatments, and disparate goals and limitations (almond pollination, honey production, avoidance of comb-contaminating miticides or wish to use “organic”methods, labor costs, etc.).
For that reason, with no background whatsoever in modeling or spreadsheets, Randy painstakingly worked for over a year to create his open-source varroa management model, first publishing it in 2017 [[1]]. The logic for the model is laid out in Figure 1.
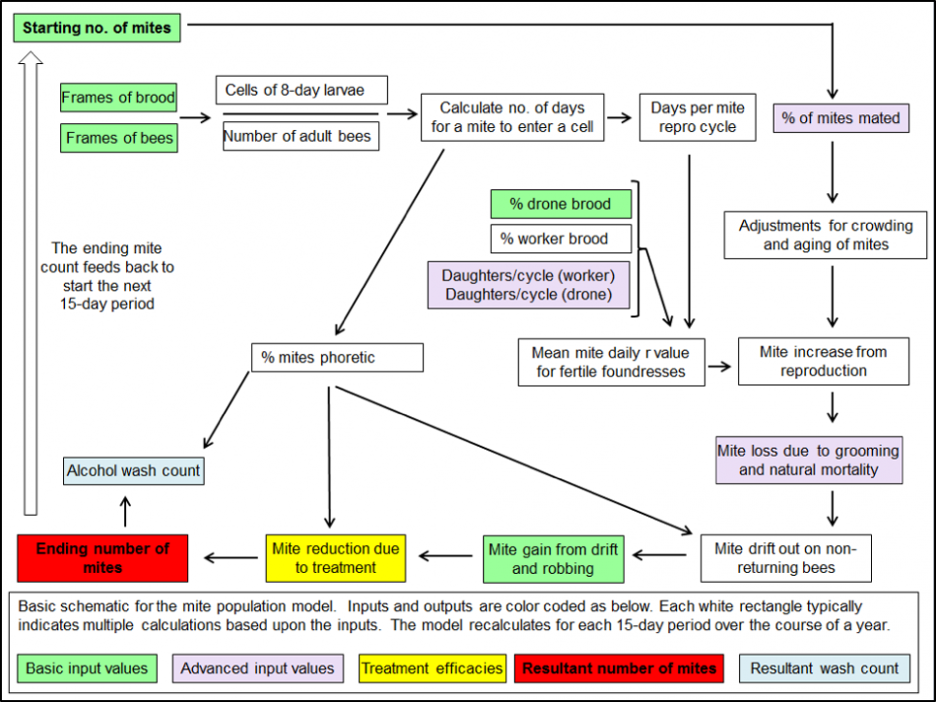
Fig. 1 The inputs for the model are details that can be measured or estimated by the beekeeper: the mite wash count, cluster size and amount of brood over the course of the season, the amount of mite immigration, and the expected efficacy of each treatment.
After inputting a few values for the above parameters, the model then indicates the expected impact of treatments, and allows a beekeeper to customize his or her management strategy (Figure 2).

Fig. 2 A beekeeper can run simulations of various management strategies with the goal of avoiding the red crash indicator — it doesn’t cost you anything to lose a colony on the computer! In this simulation, a 50% efficacious mite treatment in May (when high efficacy is tough to attain, due to the amount of mites in the brood), followed by an 80% efficacious treatment on the first of October, didn’t do the trick, and the colony would be expected to crash.
Note: Since there are far too many variables involved for any model to predict the degree of colony morbidity due to increasing virus transmission due to mite buildup, or colony performance with changing forage or weather, the model assumes that the infestation rate is kept to a low enough level to not change the expected colony structure. Thus, the “crash” indicator is only a rough approximation, and can be adjusted.
Randy encouraged, and fully expected, bee researchers or professional modelers to take his crude model and improve it, but it’s been mostly beekeepers themselves who have caught errors and offered suggestions. So over the years he’s updated it continually — the current iteration is Version 19, available for download at [[2]].
To those familiar with using Excel spreadsheets, this varroa model is simple to learn to use, and for those with a deeper understanding of varroa and honey bee biology and reproduction, is fully customizable for any bee stock or conditions anywhere in the world.
However, not every beekeeper has Excel on their computer (or even has a computer), or is comfortable with using spreadsheets, so some asked for a simpler version that they could download to their beloved cell phone. Not being a programmer himself, Randy put out the word for help…
TRISH STEPS UP TO THE PLATE
In 2018, beekeeper/computer science undergrad Trish Harness recruited an upper-level computer science class at Hiram College to collaborate on developing an online version of the varroa model. After the class term ended, she continued to work diligently on it herself, going through countless iterations over the years, bouncing ideas and prototypes back and forth between us. We’ve finally arrived at a version that we’re both happy with. All you need to do on your cell phone or laptop is to go to chickabuzz.com/model.html and type in a few input values. So let’s run a few simulations to show how to use it, starting with Figure 3.

Fig. 3 A screenshot of Trish’s model (on a cell phone, best viewed sideways), using the same inputs as for Fig. 2 (the blue cells indicate the inputted treatments). She also allows the user to choose which parameters they want to have shown in the chart — in this example, all are checked.
For Trish’s simplified app, she wanted to make the varroa infestation stand out. So the varroa population (red line) is shown at a 10x multiple (topping out at 5000 mites), and the mite wash count for a sample of a half cup of bees tops out at 45 (a 14% infestation rate). From a management standpoint, hitting either of the top-out limits indicates that immediate treatment is called for.
Compare the above results for the same simulation, but instead of only two treatments, the beekeeper checked the upper grey boxes to apply three moderately-efficacious (80% reduction) treatments in April, August and November (Figure 4).
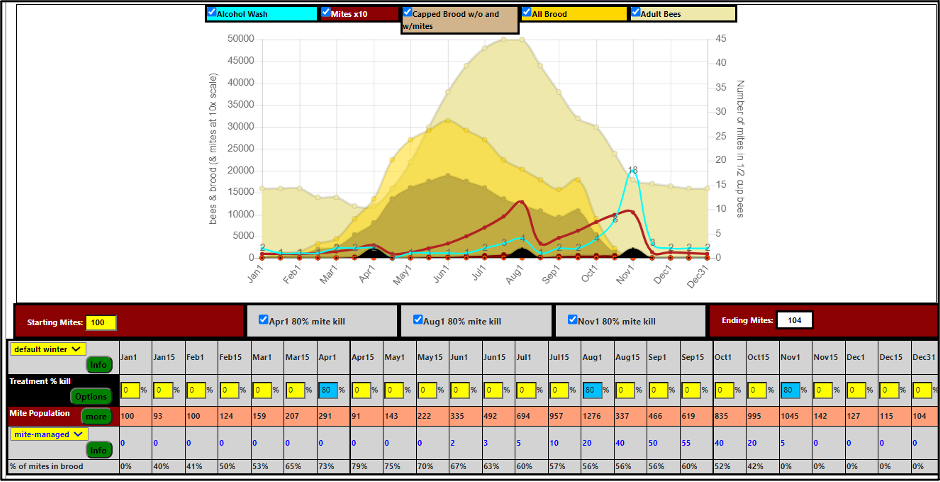
Fig. 4 Success — no crash! This treatment regimen prevented the mite population or brood infestation rate from climbing too high, and the colony would be expected to survive the winter. Note that this treatment regime would be sustainable, since the starting and ending mite counts (100 and 104) are essentially the same.
For another example, let’s show a simulation for a beekeeper who purchased a nuc in early April, with a starting varroa population of only 50 m ites (Figure 5).

Fig. 5 A starting wash of a half cup of bees from this nuc would typically detect zero mites. In this simulation, instead of indicating total brood, it’s clicked to show only the amount of sealed brood. The beekeeper applied a 50% efficacious treatment at the first of August, and then a 90% efficacious treatment on November 1st, as the last of the sealed brood was emerging.
If this happened to be the beekeeper’s first colony, they would be impressed by their low mite counts in April and December, but the colony may still have been suffering from a late-season Deformed Wing Virus infection due to its high mite level in October and November, and might not make it through the winter. And even if it did, it would begin the season with 157 mites — three times as many as it started with in the previous year. So this varroa management strategy would not be sustainable.
In the simulation below (Figure 6), the beekeeper proactively applied a formic acid treatment in March, and then applied 5 OAVs every 15 days starting in mid-August. The model indicates the expected proportion of the mites in the brood at any time (bottom row), which helps you to estimate the efficacy of various treatments. For example, a 30-second oxalic acid vaporization (OAV), using 1 g per brood chamber may only kill around 80% of the mites on the adult bees, and none under the cappings. So for the first application, since an estimated 56% of the mites would be in the brood, that would leave 44% out on the bees, for which an 80% kill rate would result in an overall reduction of the mite population of 35% (44% x 80% = 35%, the figure that the beekeeper would enter). For each subsequent OAV, the expected overall efficacy could again be estimated as shown.
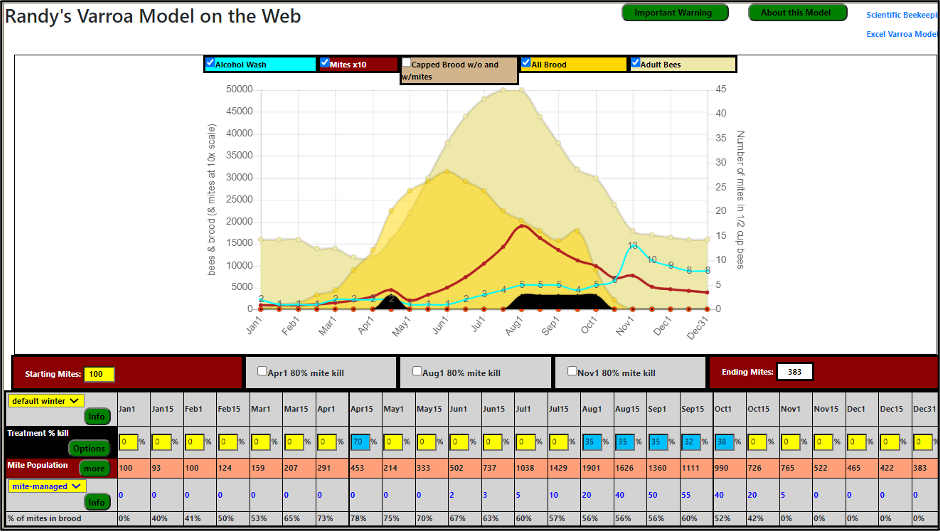
Fig. 6 By proactively hitting the mites in April (and perhaps suppressing the swarm impulse by the brood break induced by a formic treatment), the beekeeper got by with a series of late-summer low-efficacy OAVs while the colony still contained brood, taking it into the winter with a barely-acceptable infestation rate of 8 mites in a wash. But note that the ending mite population was nearly 4 times that of the start, which would spell trouble the next season.
Note: Randy’s been analyzing data sets from several beekeepers who have taken mite drop counts following repeated OAVs. It appears that repeated applications of 1 g per brood chamber, applied in a 30-second blast, although “safe” for the colony, may result in relatively low overall efficacy, even if repeated at 4-day intervals, especially if much mite immigration is taking place (there was moderate immigration in the above simulation). Indeed, mite wash counts might even give the impression of no efficacy (as recently observed by Berry [[3]]). Note that in the above simulation, the mite wash counts (the numbers on the blue line) over the course of 5 OAV applications did not change, despite reducing the total mite population by two-thirds.
For a last simulation, let’s switch to a Mediterranean California climate, with a nectar and pollen flow in September and October, and with a bit more mite immigration during late summer from surrounding neighbors’ hives (Figure 7).
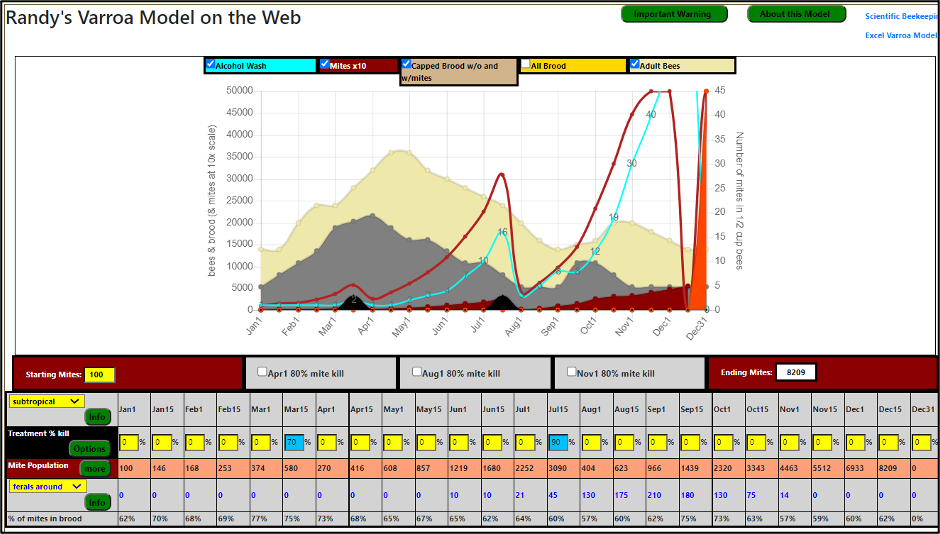
Fig. 7 This San Francisco beekeeper was also proactive by treating in mid-March, but got only 70% mite reduction due to the large amount of sealed brood. By mid-July, there was much less brood due to the summer dearth, and she obtained 90% efficacy with a double application of Apiguard (thymol). But then a new spike in broodrearing, coupled with troublesome mite immigration, allowed the mites to rebound. Notice how the proportion of brood cells infested by at least one mite (dark red area) built up to a point of no return by late November, causing all her bees to “disappear” while she was distracted by the holidays. What a bummer of a way to start the New Year!
By running simulations, one can start to better understand mite population dynamics, and response to various treatments.
USING MITE MODELS AS A REALITY CHECK
No model of a complex biological system can be perfect, but these simulations, based upon Randy’s experience in his own operation, as well as feedback from other beekeepers worldwide, indicates that they generally hit the mark. Randy continually checks the base model against data from others to confirm its accuracy.
The full model requires inputs of only:
- A starting mite infestation rate, estimated by working backwards from an actual mite wash count from a bee sample taken from a frame adjacent to brood at any time point,
- A choice of colony type (or customize for your location by inputting the number of frames covered with bees and amount of brood over the course of your season),
- An estimate of mite immigration (several options given, or customize).
- And any treatments applied (the models list expected efficacies of various treatments).
Trish’s model lacks some of the customization options, but can be used right in the field on your cell phone.
There’s no reason to be surprised by mites unexpectedly getting out of control in your hives. By running simulations, you can test out various mite management strategies for your colonies in advance, adjusting them for your available treatment windows, working around honey flows, and rotating different treatments to avoid breeding resistant mites.
Practical application: We’ve found that the most successful strategy is to deal with varroa proactivelyrather than reactively. Get ahead of the mites as early in the spring as possible, so that you go into the honey flow with an extremely low infestation rate, then harvest your honey as soon as you can after the flow, and knock the mites back before your colonies are producing their last rounds of brood before winter.
A NOTE FROM RANDY
Trish has worked hard and long to create this mobile version of my varroa model, and plans to continue to improve and update it (always check for the latest version). She doesn’t get paid for this, so if you find it to be useful, please send her a donation. Her website is Chickabuzz.com [[4]] and her online model can be accessed at chickabuzz.com/model.html
MORE INFORMATION AND DOWNLOADS
[1] https://scientificbeekeeping.com/the-varroa-problem-part-12/
[2] https://scientificbeekeeping.com/randys-varroa-model/
[3] Berry, Jennifer (2021) Multiple applications of vaporized oxalic acid. Bee Culture Dec. 2021: 70-73.
[4] Trish’s website: https://chickabuzz.com/


