
Drones and Varroa: Part 2

December 30, 2023
Contents
Why Would Mites Prefer Drones?. 12
Drones and Varroa
Part 2
Randy Oliver
ScientificBeekeeping.com
First Published in ABJ November 2023
In the May issue of this journal, Dr. Zac Lamas presented some findings of great interest, regarding the distribution of varroa mites on drones as compared to that on workers. Aha, I thought – this might help to explain why mite wash counts after the honey flow sometimes increase more strongly than expected. So I dove into some hives to determine to what extent the prevalence of drones in the hive could be involved.
If you haven’t already watched it, check out Dr. Lamas’ video [[1]], in which he goes into much greater depth than in his May article. He explains that the drones function as a “protective cushion” for the colony, due to the mites preferentially feeding upon them rather than the workers. Since drones are not involved in transferring food to other bees, nor in brood rearing, they are more expendable than the critical nurse bees, and their presence may help to reduce the impact of mites upon the nurse bees, as well as reduce varroa-mediated virus transmission within the hive, especially early in the season, when the relatively few mites present on the adult bees in a colony may be riding (and feeding) predominately on drones.
Practical question: The biotechnical method of using drone brood to trap and remove varroa can reduce the number of mites in a hive, but it would also remove the “protective cushion” that those drones would have provided had they been allowed to emerge. This tradeoff would be an interesting subject of research.
What especially intrigued me about Dr. Lamas’ presentation were two intriguing hypotheses:
- That for the purposes of varroa monitoring early in the season, sampling drones may better reflect a colony’s overall infestation rate than sampling bees shaken from the combs, and
- That the post-flow disappearance of drones from the hive would cause an appreciable increase the varroa infestation rate of the worker population.
I found both of the above hypotheses to be plausible and worth testing.
Regarding the first hypothesis, Dr. Lamas pointed out the problem with using a sampling methodology based on the assumption of a random distribution of the parasite on the bees, when the parasite actually occurs in an aggregated distribution – suggesting that hand-plucking of drones may be a better method than a wash of a half cup of workers. Last month I showed my own results, comparing the mite counts from worker samples to those of plucked samples of 25 drones from the same combs.
This brings us to the second hypothesis, which to me was of far greater interest, since it might help me to improve my varroa model [[2]]. Dr. Lamas’ proposed hypothesis was that when the drones “disappear” after the honey flow, the resultant shift of mites solely onto the workers might help to explain why mite wash counts suddenly increase, leading to viruses overwhelming the colony.
I found the above hypothesis to be plausible, and possibly explanatory for why my varroa model sometimes underestimates the observed rapid increase in mite wash counts in worker samples taken in late summer. So I decided that I’d better investigate.
Testing Hypothesis #2
First let me specify the question to answer:
Would the post-honey flow “disappearance” of drones from a colony result in an appreciable increase in the infestation rate of the adult workers?
It occurred to me that this would be a straightforward arithmetical calculation. So for our calculation, let’s imagine a hypothetical case in which all the drones in a colony were to suddenly fly off, leaving some of their mites behind.
To perform the calculation, we need to know:
- The total number of adult bees in the hive prior to drone fly off.
- The percentage of those bees that were drones.
- The mite infestation rate of the drones relative to that of the workers.
- The number of mites that the drones would be expected to carry out as they exited the hive.
We commonly hear that colonies reach populations of up to 60-80 thousand bees. But I was surprised by how difficult it was to find hard data supporting those numbers. So I decided that we should roll up our sleeves and count just how many workers and drones there were in some of my own hives in late June and early July (at the end of our honey flow).
Since I wanted to get counts for both the workers and the drones, I couldn’t just weigh the hive before and after shaking out the bees – I needed to first shake all the bees into a cage and weigh them (this part was relatively easy), then separate out the drones, and weigh them alone (that turned out to be a bit more difficult than I hoped) (Figures 1 & 2).
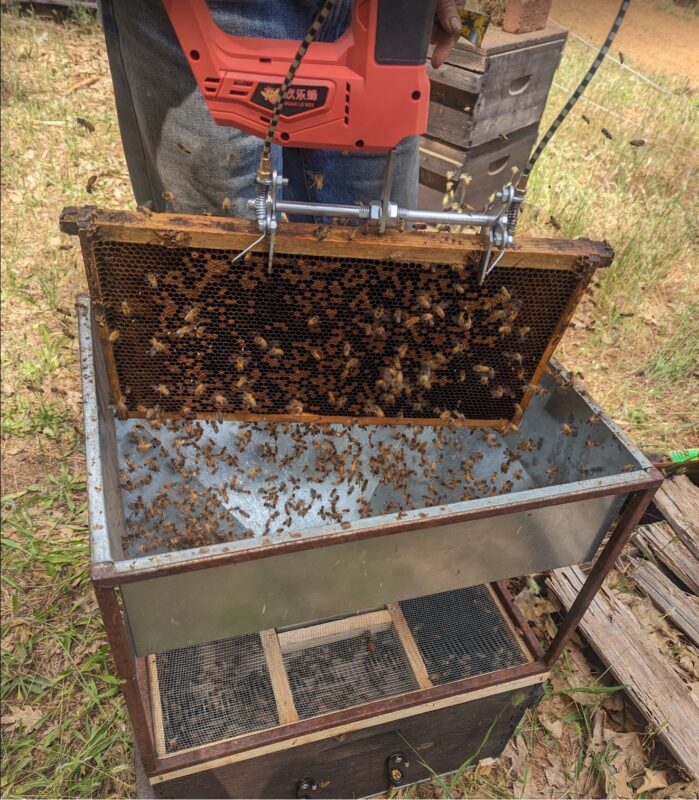
Fig. 1 I used a very handy battery-powered device from China to shake the bees from each comb. Just pull the trigger, and in two seconds all the bees are falling through the funnel (I used a standard bulk bee funnel). I built a special hive body “cage” to hold them for weighing.
By weighing the cage before and after shaking the bees into it, I could determine the net weight of the bees. I also took a sample (on ice) of at least 100 workers for later weighing. After the first hive, I first located and caged the queen prior to shaking.
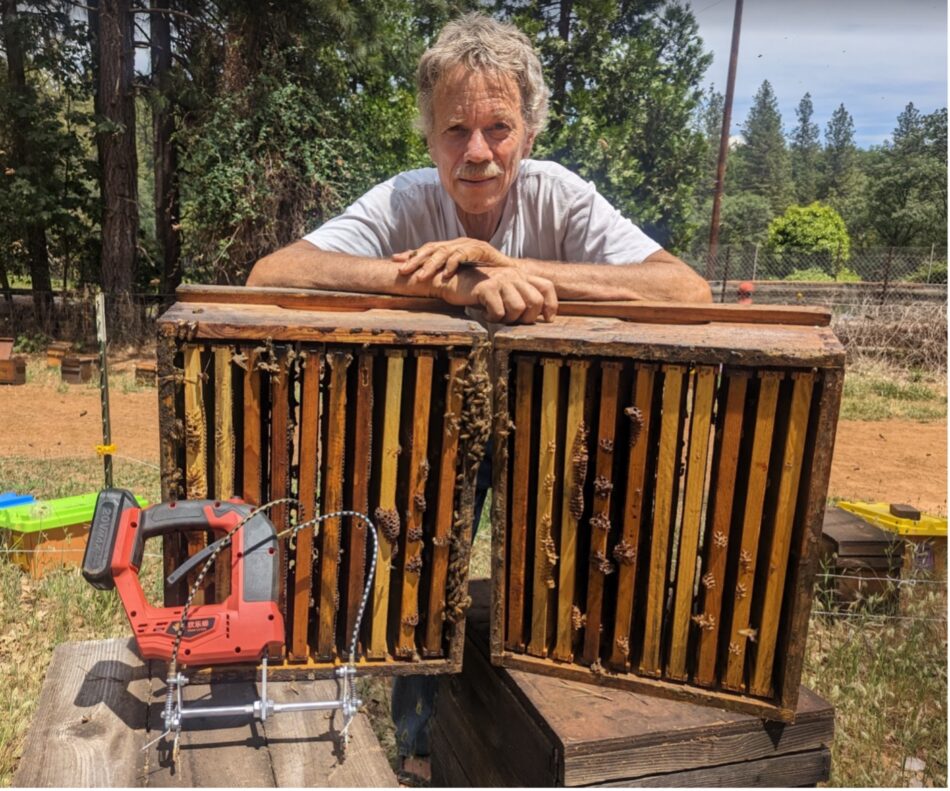
Fig. 2 A view of the combs after shaking off the bees. The small amount of bees you see were returned foragers (which we then also shook into the cage).
It was relatively easy to determine the weight of the adult bee population. The tricky part was then to separate the drones from the workers. I had installed a queen excluder over the cage, so that after weighing, I could allow the workers to exit (Figure 3).
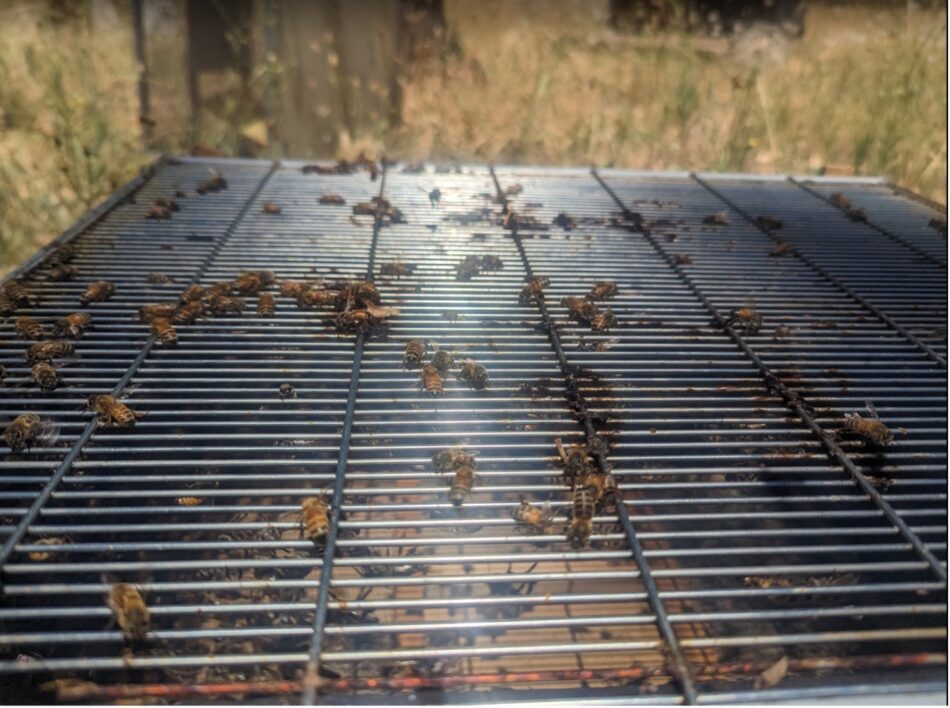
Fig. 3 Young workers avoid light; older workers fly towards it. I found that what worked best was to first replace the queen back into the empty hive (with its brood combs), then place the cage queen excluder side of the cage down, and allow the younger workers to climb through it onto the combs. Then I’d flip the cage over, and allow the older workers to exit up and out towards the light, leaving the drones still trapped inside.
Unfortunately, some workers stubbornly remain behind in the cage (there was a substantial hive to hive difference), preventing me from simply weighing a cage full of only drones. I tried transferring the remaining bees to a bucket to smoke the workers down through the excluder (Figure 4).
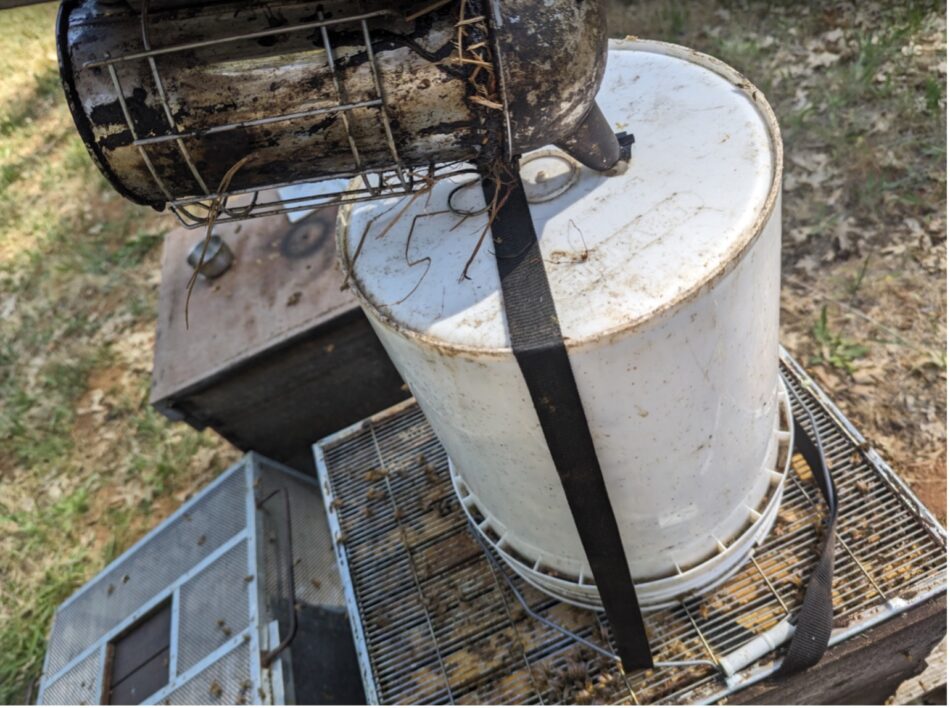
Fig. 4 Trying to smoke the workers down. Didn’t work.
So how about knocking them out? (Figure 5).
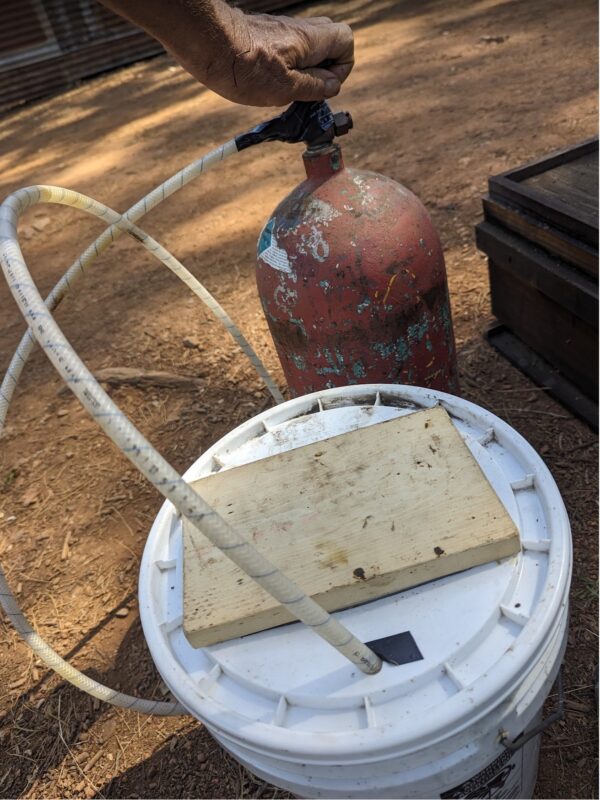
Fig. 5 I tried anesthetizing the drones and workers with CO2, but they recovered too quickly to separate them by hand.
What I unfortunately wound up having to do was to drench the drones (and any remaining recalcitrant workers) with detergent solution, and bag them for later drying, hand sorting, and weighing (Figures 6 & 7).
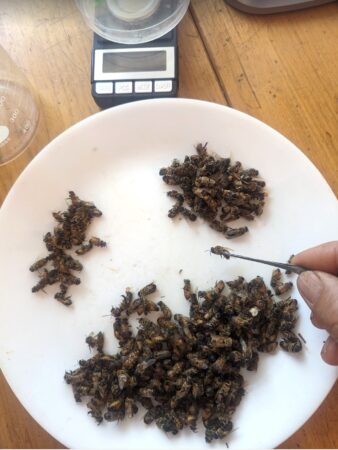
Fig. 6 We tediously hand sorted and weighed thousands of drones and workers.
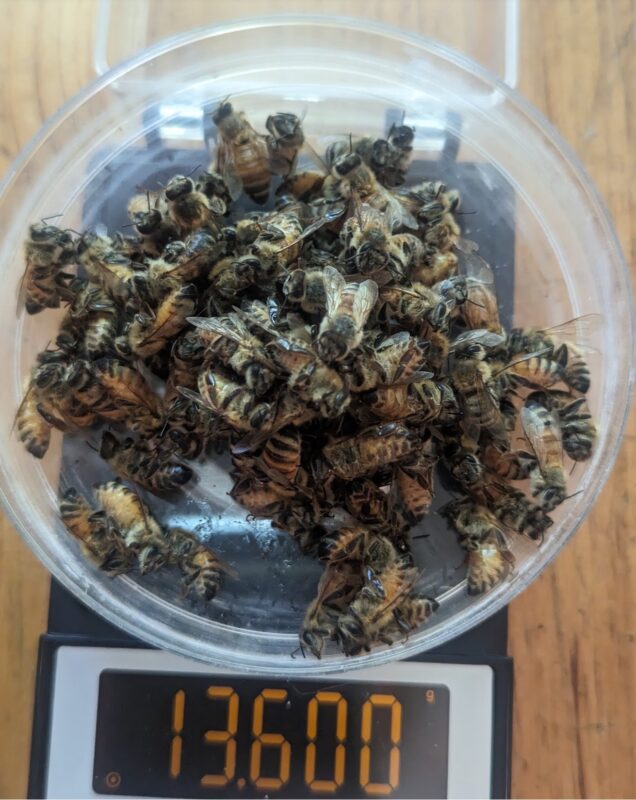
Fig. 7 By counting out 100 workers or drones and accurately weighing them, we could determine their average weights, and then calculate how many of each were in the hive.
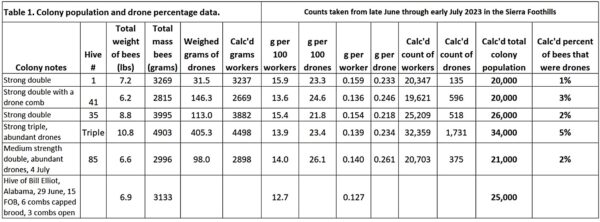
We shook the bees from five relatively strong double- and triple-deep hives. This was at the end of our honey flow, and we only shook out colonies in which I saw a lot of drones. I highlighted the description “relatively strong” since it was based upon my assessment of “cluster size” by looking down at the top bars – the colonies appeared to be “full of bees.” What was eye-opening for me were just how few bees were spread out over the combs of the colonies that we shook (Table 1).
Practical note: Many years ago, Dr. Eric Mussen had commented to me that our colonies in California never reached the strength of those in Minnesota. So my results may not reflect what you’d see elsewhere.
I put out a request for other beekeepers to shake some of their hives. Bill Elliot from Alabama did so from a 1½-story hive around 20 days after his honey flow ended, and I included his finding. None of our shaken colonies were anywhere near the commonly stated 50-60,000 bee range. In the summer heat, the bees were not as packed on the combs as they are when it’s cool.
My bad: In my varroa model, I incorrectly assumed that there were as many bees on a comb during summer as there are when it’s cooler. That mistake leads to under calculating the expected mite wash counts during summer. I’ll address this in my next article.
Anyway, we’ve now got a figure for the total population of bees in post-flow hive. We now need a figure for the percentage of the population that were drones. Currie and Jay [[3]] stated that “Colonies with 24,000 – 27,000 workers contain approximately 1800 drones,” which works out to them constituting a bit more than 7% of the population. We didn’t find anywhere near that high a percentage, with some of the hives containing only 2-3% drones. Anyway, for our calculation, let’s use the highest drone percentage (5%) that I found in my hives.
The next figure that we need for the calculation would be the mite infestation rate of the drones relative to that of the workers – luckily something that I already had from the drone sampling that I described last month (Table 2).

I color coded the worker infestation rates in blue, and those of the drones in red. In black boldface below I calculated the “multiplier” – how many times higher the infestation rate of the drones was, relative to that of the workers.
In all the hives, the infestation rate of the drones was higher than that of the workers. For our calculation, let’s use the overall average multiplier of 5.5% (meaning that the average infestation rate of the drones was five and a half times higher than that of the workers).
The last figure that we’d need for our calculation would be how many mites the exiting drones would take with them. E.J. Steed collected flying (and thus presumably) older drones at drone congregation areas, and found that they were infested by mites at about two-thirds the rate of workers sampled from brood combs in nearby hives [[4]]. This indicates that drones that exit the hive take their mites with them. Dr. Lama’s data indicate that drones old enough to fly were roughly as attractive to mites as were workers of the same age, so for my calculations I’ll assume that when a drone exits a hive, its infestation rate would be the same as that of the worker average (as opposed to workers sampled from the brood combs).
Let’s Do the Calcs!
OK, we’ve now got all the information that we need to calculate to what degree a hypothetical fly-off of drones would increase the mite wash count in a sample of workers. So (as I’m prone to do) I took some time (actually a lot of time) to create a calculator [[5]] to see (Figure 8).
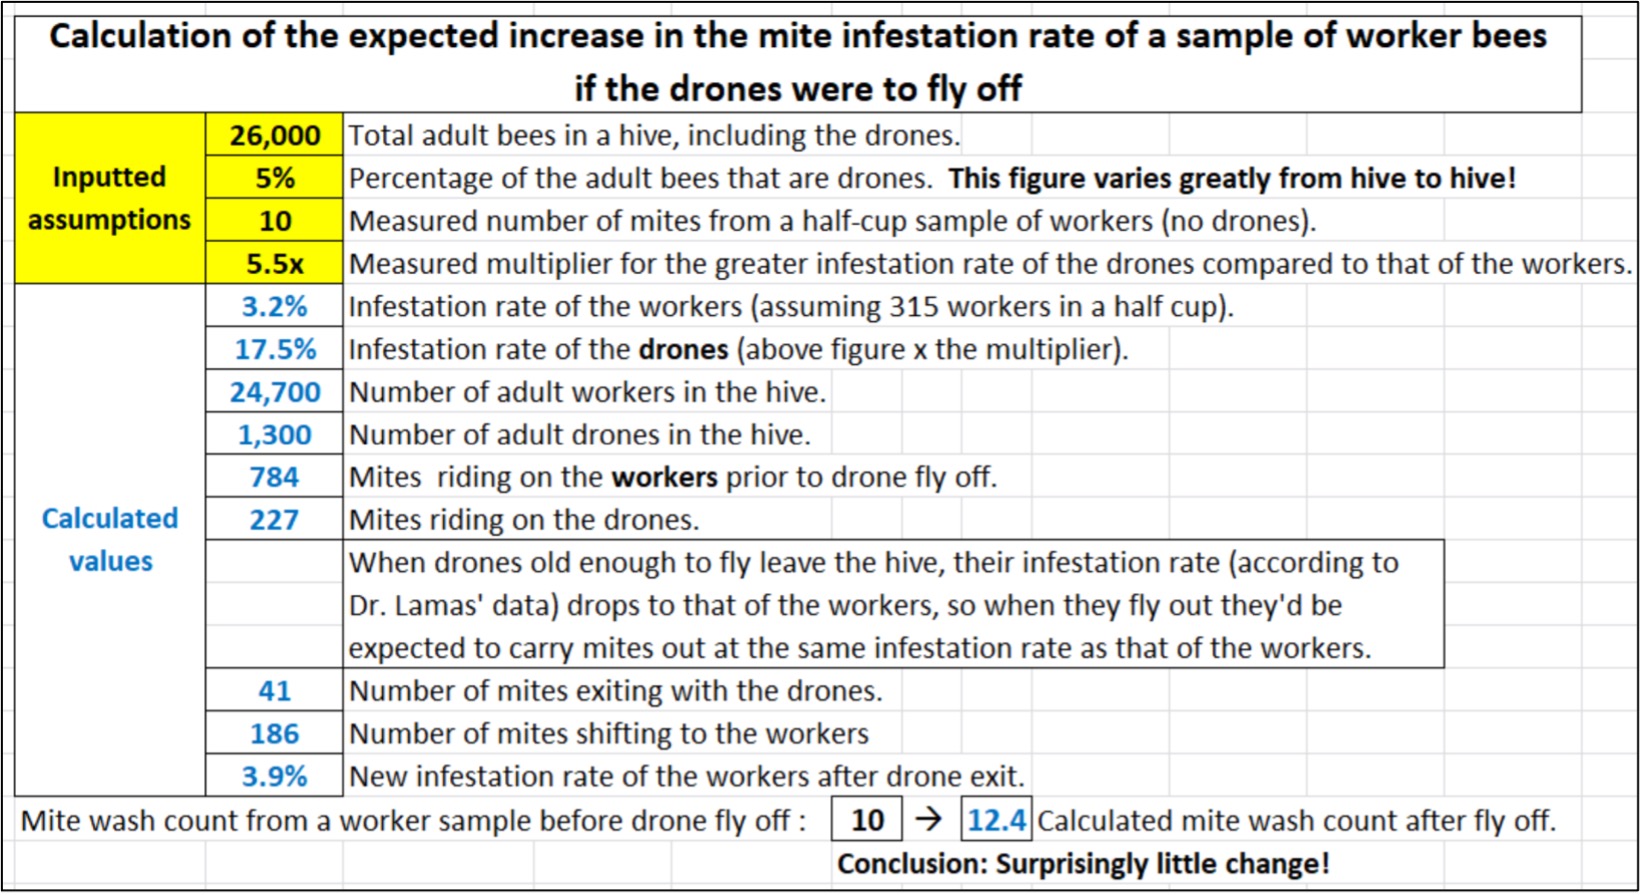
Fig. 8 In the above calculation run, I arbitrarily assumed that prior to drone fly off, the workers had reached an infestation rate of 10 mites per half-cup sample (a 3.2% infestation — a commonly accepted action threshold). The calculation indicates that even in the hypothetical case of the drones (infested at 5.5x that rate) suddenly leaving the hive, their exit would only result in a minimal increase in the infestation rate of the workers. Another tantalizing hypothesis bites the dust.
Conclusions
Although the hypothesis that post honey flow drone disappearance would result in a serious jump in the mite infestation rate of the workers was compelling, my data and calculations do not support it.
The cause of the rapid increase in the infestation appears to be mainly due to a combination of four factors:
- The exponential increase in the mite population, which doubles roughly each month [[6]].
- The reduction of the adult worker population, meaning more mites per bee [[7]].
- A decrease in the amount of sealed brood, which results in a greater proportion of mites on the adult bees.
- And possible immigration of mites due to worker drift or robbing.
Practical application: My measuring of the actual bee counts of my hives has opened my eyes to the fact that my varroa model needs adjustment. I’ll go into greater depth next month.
Why Would Mites Prefer Drones?
I wish to thank Dr. Lamas for his impressive body of research. His findings on the preference by mites for drones (which my data confirm) are of great interest, and I’m curious as to why, since their fat bodies (varroa’s target food) are not as developed as those of non-foraging workers. Haydak [[8]] found that the fat bodies in drones consisted of only “a few aggregations of cells, difficult to find,” and that “no fat-body was found in drones 3 days old or more.” However, the hemolymph of freshly emerged drones contains relatively more glycogen (an energy molecule) than in same-aged workers, and the protein and vitellogenin content of drone hemolymph “increases rapidly within the first days after emergence, reaching a peak at the 3rd day and decreasing after the first week” [[9]]. So what is it about drones that mites find so attractive?
We obviously still have a lot to learn about varroa and their affinity for drones! I look forward to reading Dr. Lamas’ studies when they become available.
Acknowledgements
Thanks for the field help from Corrine Jones, Kamon Reynolds, Victoria Knight, and Rose Pasetes.
Citations and notes
[1] Hidden in plain sight: Varroa aggregate on adult drones https://www.youtube.com/watch?v=mAsXFPakumU
[2] https://scientificbeekeeping.com/randys-varroa-model/
[3] Currie, R & S Jay (1991) The influence of a colony’s queen state on the drifting of drone honey bees (Apis mellifera L.). Apidologie 22: 183–195.
[4] Steed, EJ (2023) Parasites and pathogens at honey bee mating sites, and the implications for monitoring colony health. M.S. Thesis, The University of Waikato.
[5] I’d be happy to share a copy if you’re interested.
[6] See cell AG62 on the Current Version tab of my varroa model.
[7] https://scientificbeekeeping.com/ipm-3-strategy-understanding-varroa-population-dynamics/
[8] Haydak, MH (1957) Changes with age in the appearance of some internal organs of the honeybee. Bee World 38: 197–207.
[9] Hrassnigg, N & K Crailsheim (2005) Differences in drone and worker physiology in honeybees (Apis mellifera). Apidologie 36(2): 255-277.


