
Re-Evaluating Varroa Monitoring: Part 2 – Questions on Sampling Hives for Varroa

August 6, 2020
Re-Evaluating Varroa Monitoring
Part 2
QUESTIONS ON SAMPLING HIVES FOR VARROA
Randy Oliver
ScientificBeekeeping.com
First published in ABJ April 2020
In order to monitor the varroa infestation rate of the adult bees in a colony, one must take a sample of bees from somewhere in the hive. But how to decide which comb to take the sample from?
This is not an easy question to answer, since several questions come to mind:
- How many bees do you need for a representative sample?
- Is the sample truly representative of the worker force?
- Which age class of bees carries the most mites?
- On which combs are those bees found?
- Which combs in a hive would offer the “best” representative varroa sample?
Yes, some sticky questions. But first, allow me to define a critical term:
Sample: a representative portion of a larger whole group.
Question #1: How many bees do you need for a representative sample?
I find that if we limit the varroa infestation rate of our bees to the 2% level (2 mites per 100 bees), that our colonies thrive; but by the 5% level varroa and Deformed Wing Virus (DWV) start to noticeably take their toll on colony health and performance. Thus, early in the season I want to be able to detect an infestation rate should it reach the 1% level.
Practical application: A colony with a 1% infestation level at the beginning of April will reach the point of no return by September if not treated well before then [[1]]. Colony performance is best if mites are controlled early in the season.
So let’s say that a colony was infested at the 1% level. If I sampled a single bee, 99% of the time, I’d see zero mites — which might mislead me into thinking that the colony was “mite free.” If instead I sampled 100 bees, I’d still get a zero count 36% of the time (one can use an online calculator to determine these probabilities of sampling success). So what if I sampled a level half-cup of bees (roughly 315 workers)? See Fig. 1 below.

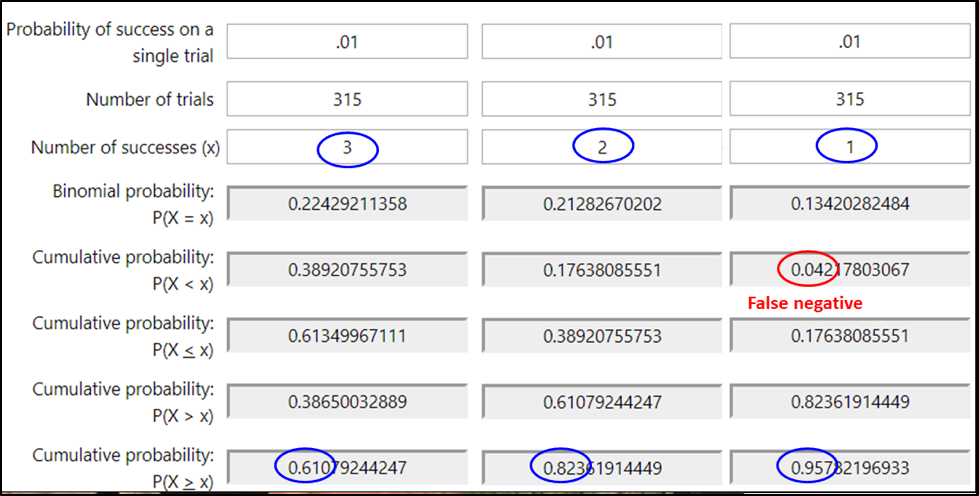
Figure 1. At the 1% infestation level, a half cup of bees would, on average, carry 3 mites — but that’s not the number that you’d see every time. With an online calculator [[2]], I entered the probability of a bee carrying a mite at the 1% infestation level (.01). Then the number of bees in a sample (315), and the number of mites that I’d expect to detect in that sample (upper blue ovals). The calculated probabilities are that although you’d get exactly 3 mites in only 22% of samples (upper left gray box), you’d detect at least 3 mites 61% the time (lower left gray box.
In the second two columns, I ran calcs to find out the chances of seeing fewer than three mites (circled in blue in the lowest row). You’d expect to see at least a single mite 96% of the time, and completely miss a 1% infestation only 4 times in a hundred (in red). So seeing even a single mite in an alcohol wash early in the season might be a call for action.
Practical application: Most of us would rather err on the side of overestimating, rather than underestimating the degree of varroa infestation. Thus, we are more interested in avoiding false negatives (underestimating the infestation rate), than worrying about false positives (overestimating the infestation). At the 1% infestation rate of the adult bees, a half-cup bee sample gives you 96% chance of getting at least one mite in the bee sample.
The Importance of Technique
Important note: Keep in mind that any of these figures depends upon the degree of mite recovery that you get by your sampling technique. In the above calculations, I assumed 100% mite recovery from the bee sample – a success rate that I suspect is rarely attained in the field. I created the table below based upon my field observations of colony performance vs. varroa infestation rate (Table 1).
| Table 1. Colony health implications related to the number of mites recovered from a sample of a level half cup of bees (approx. 315 bees). | |||||
| Infestation level of the adult bees | Colony health implications | Number of mites in an alcohol wash or sugar roll, adjusted for the degree of mite recovery due to technique.* | |||
| Percent actual mite recovery | |||||
| 100% | 90% | 80% | 70% | ||
| <2% | Colony not appreciably affected by varroa. | 6 | 6 | 5 | 4 |
| 3% | Winter survival rate drops. | 9 | 9 | 8 | 7 |
| 5% | Colony summer performance drops. | 16 | 14 | 13 | 11 |
| 10% | DWV starts to seriously take hold. | 32 | 28 | 25 | 22 |
| 15% | Colony typically past the point of recovery despite treatment. | 47 | 43 | 38 | 33 |
| * Few beekeepers likely attain even 90% recovery due to poor technique. | |||||
Practical application 1: The mite counts above are only expected averages, so obviously half the time you’d see fewer mites in a sample. But when I run the numbers, the counts will be within 10% roughly 75% of the time. So take multiple samples from your hives to get an idea as to where you stand, and keep in mind that roughly a tenth of the hives in a yard will exhibit much higher counts than the yard average.
Practical application 2: Since the threshold for treatment involves relatively few mites in a sample (as low as 1 early in the season), it’s important to obtain full mite recovery. Later in this series I will address how to obtain maximum mite recovery in alcohol washes.
Question #2: Is the sample truly representative of the worker force?
To obtain a truly-representative sample of the worker force of the colony as a whole would require you to shake all the bees off the combs into a cage, mix them up, and only then to take the representative half-cup sample. Clearly, most of us are not going to do that! So the question then is, where in the hive should we take the bee sample from? One would think, what with all the experts telling us beekeepers that we should monitor our hives for varroa, that there would be well-supported recommendations as to which comb in the hive gives the best representative sample. The common advice is to take the bees from a brood frame “because varroa prefer nurse bees.” Is that actually true, and would such a sample indeed be representative?
Practical application: Let’s just say that a colony has only a tiny patch of brood, indicating that there would perhaps be a low proportion of nurses in the hive. Would the presumably-high infestation rate of those few nurses then be representative of the colony as a whole? I don’t know that anyone has investigated whether the infestation rate of the nurse bees is actually the most biologically-relevant metric for varroa impact upon the colony as a whole.
Question #3: Which age class of bees carries the most mites?
There’s no sense in wasting time in trying to reinvent the wheel, so when I have a question about bees, I first search the literature to see if someone’s already performed an experiment or study to answer it. So I first looked for the supportive evidence for the claim that “varroa prefers nurses.” The original basis appears to be from a trio of in-hive studies performed in the mid ‘80s — before varroa reached the U.S. At that time, German scientists were engaged in quite of bit of very impressive research into varroa biology.
In the first study published [[3]], Petra Schneider collected samples of bees from 10 hives from mid-June through mid-October. One group of hives had low mite levels; the other high mite levels. I’ve reworked her results in Table 2:
| Table 2. Comparison of varroa infestation rates, in June, of different types of sampled bees. Data reworked from [[4]]. | |||
|
Type of bees sampled |
Mite infestation of bees from low-mite hives, normalized to that of nurse bees. | Mite infestation of bees from high-mite hives, normalized to that of nurse bees. | |
| Nurse bees | 1 | 1 | |
| Foragers | 0.29 | 0.36 | |
| Drones inside the hive | 1.50 | 1.13 | |
| Drones outside the hive | 0.44 | 0.69 | |
This preliminary study indicated that nurse bees and drones exhibited the highest mite infestation rates. Unfortunately, the brief abstract doesn’t detail how they determined which bees were “nurse bees.” But Schneider then performed additional studies during winter in a flight room, checking the infestation rate of (presumably marked) bees by age:
The highest infestation rate was found on bees which were 1-day old, further peaks were at ages of 5, 15-20, 20-30 and 42-44 days.
Unfortunately, the paper was only an abstract, so no further details.
But the next year, three heavyweights — Drs. Bernhard Kraus, Nikolaus Koeniger, and Stefan Fuchs — published a study in which they introduced over 2000 paint-marked bees into a hive and then later compared their infestation rates (Table 3):
| Table 3. Infestation rates of marked bees in a hive by age class. Data from Kraus [[5]]. | ||
| Age of bees (days) | No. of bees sampled | Infestation rate of age group |
| 6 | 600 | 5.5% |
| 12 | 640 | 5.2% |
| 18 | 450 | 2.2% |
| 24 | 250 | 3.2% |
| Pollen foragers | 370 | 0.3% |
Practical application: This in-hive study confirmed that the mite infestation rate of 6-12-day workers is roughly twice that of older workers. So the question to me then was how workers are distributed by age throughout the hive?
We know that after emergence from her cell, a worker bee typically progresses through a series of different behavioral tasks, adjusted according to the needs of the colony. This phenomenon is referred to as “temporal polyethism” (“temporal” meaning “over time,” and “polyethism” meaning “multiple behaviors”).
Since these early studies, we’ve learned that mites tend to quickly abandon the emerging workers that they had developed on (as pupae), and preferentially latch onto nurse bees. Since the mites are blind, they recognize the nurses by their odor, as evidenced by laboratory olfactory preference experiments, well-reviewed by Pernal [[6]]. This preference makes sense for two reasons:
- Nurse bees have fully-developed fat bodies, which means that they are a better food source for a female mite, and
- A nurse bee is the best transporter for a mite to its next host — which occurs when a nurse sticks her head into a cell containing a late-instar larva about to pupate.
So we can justifiably conclude that varroa do indeed “prefer” nurse bees. We might assume then that those nurse bees would mostly be on frames containing brood. But you know how I feel about assumptions. So I looked for hard data.
Question #4: On which combs are the nurse bees found?
In order to determine the usual age ranges at which workers perform each task, several researchers have tracked the activities of age-marked bees in observation or field hives.
A youthful Dr. Tom Seeley [[7]] took the time to record the activities and location of marked individuals of a cohort of 100 newly-emerged bees over the course of a month. Dr. Seeley granted me permission to include his chart of activities by age (Fig. 2).
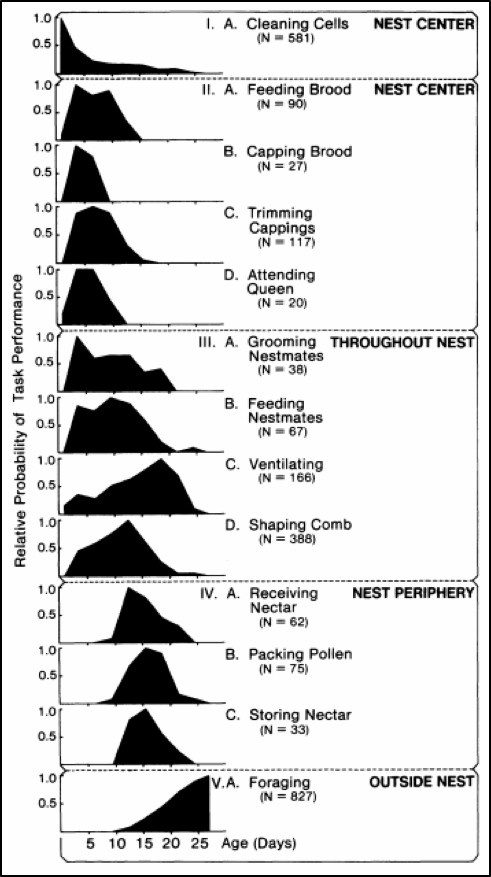
Figure 2. The darkened curves show the relative probability of a bee of any age performing one of the 13 listed tasks. Each of the five groups represents an age class, with Groups II and III commonly referred to as “nurses.” Figure from Dr. Thomas D. Seeley, by permission
Practical application: Varroa would be expected to be mostly found on nurse bees — which according to Seeley’s observations would be those from 4-12 days of age, which tend to favor the broodnest.
So I was surprised some years ago when I used fluorescent tracer to track the distribution of pollen-consuming (i.e., nurse) bees within the hive, and found them to be scattered widely throughout the combs. So let’s go back to a study by the noted English bee researcher J.B. Free, published in 1960, [[8]] to see where he found bees of that age to be located. Free introduced newly-emerged marked bees (nearly 4000 bees in 7 replicates) into normal colonies and recorded the numbers of marked bees found on brood and storage combs at intervals afterwards (I graphed his data in Fig. 3).
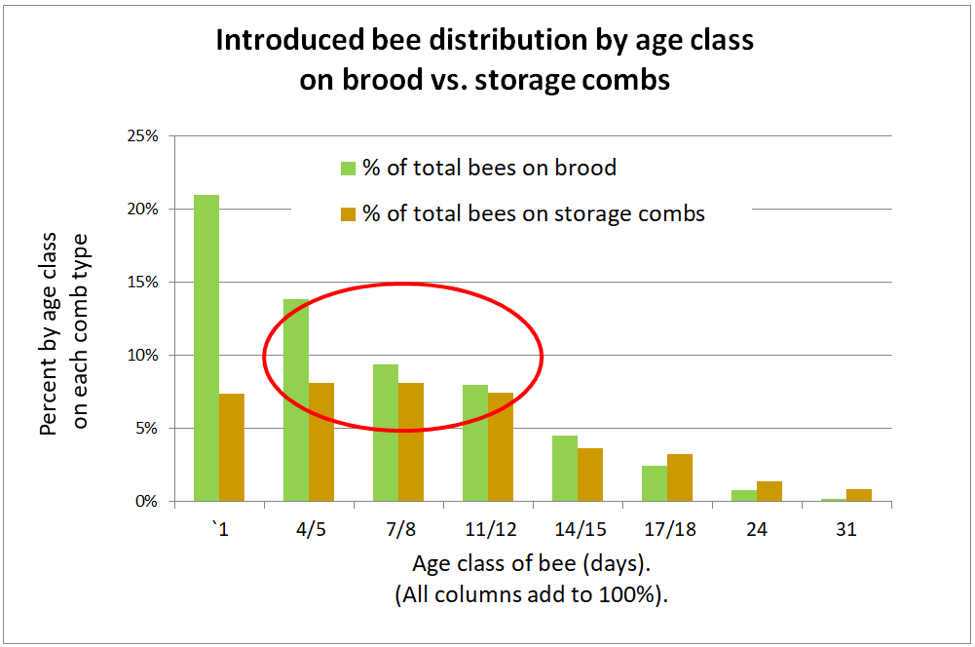
Figure 3. J.B. Free recorded the distribution of bees of each age group on brood combs (green) or storage combs (brown). Note that the bulk of a colony’s population (during summer) consists of young bees that after 5 days of age are relatively evenly distributed over the combs. Nearly half the nurses (circled in red) were found on storage combs. I’ll break down Free’s data in greater detail in a later article.
Practical application: Although we often associate nurse bees with being on brood combs, in actuality, they tend to be distributed on combs all over the hive.
Following up on this earlier research, van der Steen in 2012 [[9]] marked emerging bees once a week in ten one-story colonies for 4 weeks, and then recorded the distribution of the marked bees on the frames of the hives each week from 24 August ‘til 20 September. They found no statistical hive-to-hive difference in marked bee distribution among the ten hives, so pooled the data. I’ve reworked their results in Fig. 4.
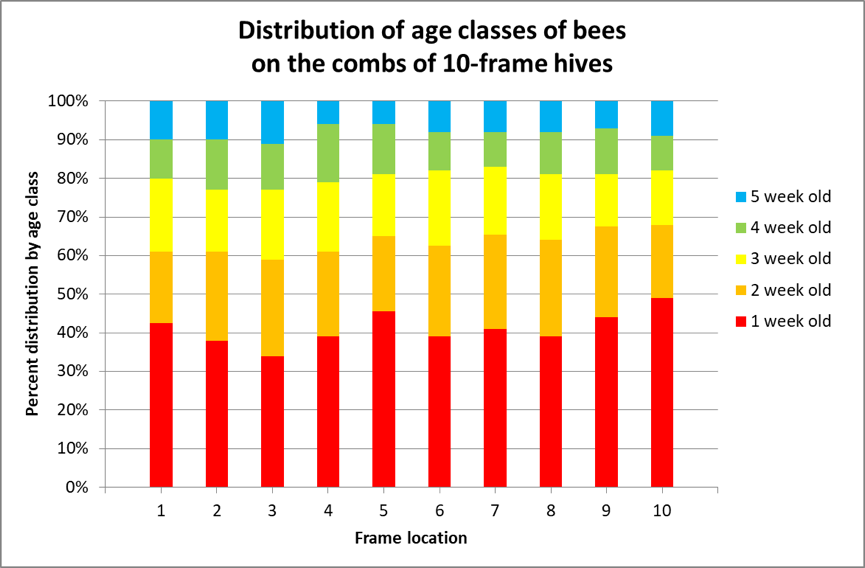
Figure 4. I color-coded van der Steen’s results. The authors did not specify the contents of the combs as far as storage or brood combs, but they clearly found that the various age classes of bees were relatively equally distributed over the combs, at least in single-story hives.
They concluded that:
Our study shows that in August it is perfectly possible to sample from the outer brood frames for a standard distribution of age classes, whilst disturbing the colony less. … We did not find a cluster of very young bees in the centre of the colony [as per Seeley], but we started counting from one week old bees onwards, which means that the phase of clustering in the centre of the colony had already passed by that time.
Practical application: The above studies determined the distribution of age classes of the bees, but does that indeed predict where mites were most likely to be found? Since nearly all the mites in a hive emerge from the brood, or are attempting to hitch a ride on a nurse bee in order to reenter a cell, we’d perhaps expect that the highest infestation rate to be found on a bee sample taken over emerging or open brood.
Question #5: Which combs in a hive would offer the “best” representative varroa sample?
In the same year as Seeley’s observation hive study of bee behaviors, Dr. Stefan Fuchs [[10]] published a field study, in which he determined the varroa infestation rate of bee samples taken comb-by-comb from across 10-frame hives. He found that:
The estimates obtained from different bee samples from the same colony fluctuate over a very wide range. In bee samples, infestation was somewhat higher in the central area of the hives, particularly on the brood combs.
However, the infestation rate of bees taken from frames containing brood wasn’t that much higher than that of bees taken from outside combs — only about a quarter higher, with only a weak correlation with the amount of brood on the comb. But in autumn, as the colonies began to go into winter cluster, infestation rates were roughly 1.5 times higher on the central comb than on outer honey combs.
More recently (2010), Katie Lee studied mite distribution within colonies [[11]]:
These results indicated mites were distributed approximately at random among bees on brood box frames.
In contrast, [mite] densities on frames with and without brood comb were statistically different… However, the difference was modest, with 1.8 mites per 100 bees on frames without brood comb, and 2.4 on frames with brood comb … for convenience, and to increase sampling precision and chance of detecting mites when they are rare, we recommend beekeepers take a single large-vial sample of 300 adult bees from any frame in the uppermost brood box.
Convincing myself
Years ago I’d also reviewed data given to me by Dr. Frank Eischen for frame-by-frame mite counts from many hives [[12]], as well as previously reporting that Dr. Ralph Büchler and I had both found that there didn’t appear to be much difference in mite infestation rates of bee samples taken from honey vs. brood frames from the brood nest [[13]]. I’d also performed a single comb-by-comb comparison myself [[14]], and concluded that taking a bee sample from any frame in the upper brood chamber was representative enough.
Practical application: Based upon a review of the literature, it was easy to convince myself that I could take a bee sample from nearly any frame in a brood box.
But that doesn’t mean that I don’t continually question my own assumptions and conclusions. So since my selection for mite resistant bloodlines is based upon mite counts. I decided to see whether it really made a difference in what comb I took the sample from. I’ll share what I found next month (teaser: it changed my mind).
Citations
[1] https://scientificbeekeeping.com/randys-varroa-model/
[2] https://stattrek.com/online-calculator/binomial.aspx
[3] Schneider, P (1985) Befall Von Sammlerinnen, Stockbienen, Flugdrohnen Und Stockdrohnen Mit Varroa jacobsoni. In Arbeitsgemeinschaft Der Institute Für Bienenforschung Bericht Über Die Tagung In Bonn Vom 12.-14.3. Apidologie 16 (3): 209-211.
[4] Op cit.
[5] Kraus, B, et al (1986) Unterscheidung zwischen Bienen verschiedenen alters durch Varroa jacobsoni Oud. und Bevorzugung von Ammenbienen im Sommerbicnenvolk. Apidologie 17 (3): 257-266.
[6] Pernal,S, et al (2005) Semiochemicals influencing the host-finding behaviour of Varroa destructor. Experimental and Applied Acarology 37:1–26.
[7] Seeley,TD (1982) Adaptive significance of the age polyethism schedule in honeybee colonies. Behavioral Ecology and Sociobiology 11(4): 287-293.
[8] Free, JB (1960) The distribution of bees in a honey-bee (Apis mellifera. L) colony. Proceedings of the Royal Entomological Society of London (A) 35: 141-141.
[9] van der Steen, JM, et al (2012) How honey bees of successive age classes are distributed over a one storey, ten frames hive. Journal of Apicultural Research 51(2): 174-178.
[10] Fuchs, S (1985) Op cit.
[11] Lee, KV, et al (2010) Practical sampling plans for Varroa destructor (Acari: Varroidae) in Apis mellifera (Hymenoptera: Apidae) colonies and apiaries. J. Econ. Entomol. 103(4): 1039-1050.
[12] Fig. 3 at https://scientificbeekeeping.com/mite-management-update-2013/
[13] https://scientificbeekeeping.com/messin-with-varroa-2014/
[14] https://scientificbeekeeping.com/sick-bees-part-11-mite-monitoring-methods/


