
Sick Bees – Part 12: Varroa Management – Getting Down to Brass Tacks

September 19, 2011
Sick Bees Part 12
Varroa Management—Getting Down to the Brass Tacks
Randy Oliver
First published in ABJ September 2011
Last month I showed how to make a mite shaker bottle, so that you could easily keep track of the actual mite levels in your hives. So now you may wonder, how do I use those mite counts to better manage my hives?
I was recently speaking in New Zealand, where the beekeepers are finally (but not unexpectedly) facing the first miticide-resistant varroa. One problem that occurs if some so-called “expert” (meaning someone from another town) repeatedly speaks on the same topic, is that he runs the danger of starting to believe himself unquestioningly. This is something that I strive to avoid, as I can be a very convincing speaker and if I’m not careful, I just might pull the wool right over my own eyes!
I was going to tell the Kiwi beekeepers how I use selective breeding, various hive management strategies, biotechnical methods, and “natural” treatments to effectively manage varroa and viruses. But talk is cheap, and since I base all my management suggestions in good science, as a “reality check” I sought out a good mathematical model for varroa infestation levels.
Varroa Infestation Models
A number of researchers (including Ingemar Fries, Stephen Martin, Wilkinson, and Gloria DeGrandi-Hoffman) have developed computer models for varroa populations. Unfortunately, none of them exactly met my needs.
So on the long flight over to New Zealand, I made up a relatively simple Excel spreadsheet based upon actual field measurements of bee and mite populations (as measured by the alcohol wash) in my own operation for the past few years. My first simple model stunned me—I could finally understand why the simple act of splitting hives is so important, and just how critical timing is when using natural treatments that result in less than 95% kill of the mites!
To make a long story short, after I returned home I dove hard into further development of the model (meaning: it consumed me, and I spent many frustrating and sleepless nights figuring out how to use the spreadsheet logic functions and in formulating equations that reflected what I observed in real life bee hives). The resulting model is not perfect by any means, but it is an eye-opening tool that helps one to really understand what is going on inside the white boxes, and even more importantly, to make informed management decisions that result in healthier and more productive colonies.
The Input Variables
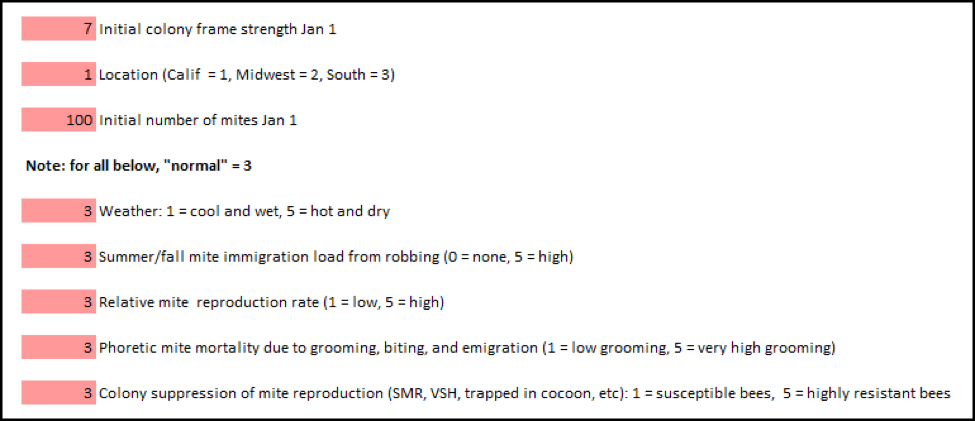 The user fills in each of these variables, and can tweak them to match his observed bee and mite population growth curves for his area (the model is completely fine-tunable by the user). One starts with colony frame strength, which can be adjusted for any time of the year.
I then added critical variables. Since mites do not reproduce well in hot or dry conditions (less mite buildup during drought), I put in a weather variable. Next was one that I called the “relative mite reproduction rate.” It ranges from the lowest to highest figures that I could find, so you can adjust to your locale and conditions (e.g., high with nonresistant stock bred solely for honey production run in large apiaries; or very low, as in the small apiaries that I visited high in the New Mexico mountains). The last two variables are there in order to adjust for two primary characteristics of mite resistant bees—I found that even a slight change in either grooming or suppression of reproductive success makes a huge difference over the year!
The Table
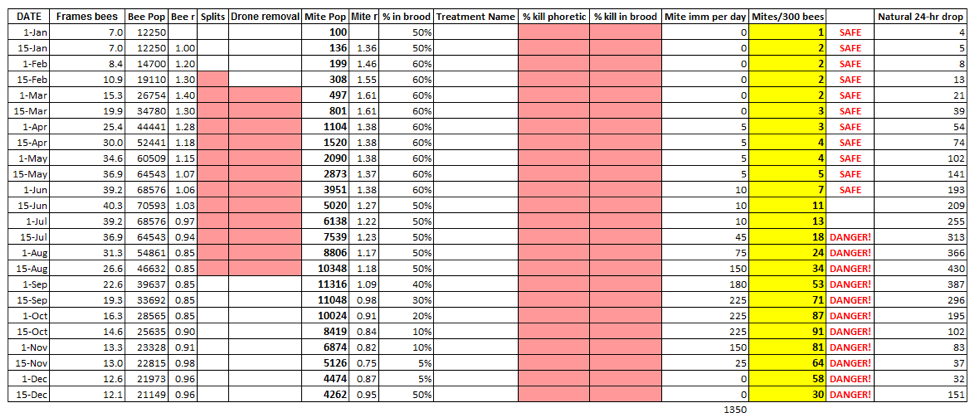 The table initially shows the baseline results from the input variables. Note that I indicate colony strength by the number of frames covered with bees (few beekeepers actually count all the bees in their hives); I only show population in thousands so that I can use the same scale for both bees and mites (I created this program for use by beekeepers, rather than academics).
The user can then fill in any pink rectangle, e.g., the number of ways that a hive is split, removal of drone brood, or mite treatments, broken down by percent kill of phoretic (free) mites (as by sugar dusting, oxalic acid, or Hopguard) and by any reduction of mites in the brood (from thymol, formic flash or MAQS, or extended application of synthetic miticides). As each new variable is entered, the table (and the graph) immediately shows the results of the new calculations.
For those not doing alcohol washes, I also created a formula to predict an approximate natural daily mite drop onto a sticky board. Funny thing is that I only did this as an afterthought, but as you will see shortly, comparing the two is really educational!
It’s All About the “r”
The key to understanding bee/varroa population dynamics is the interplay between the respective “r’s” – the intrinsic rates of increase (or decrease) for each player. The r for any time period is simply the current population divided by the previous population. If the population increased, the r will be greater than 1; if the population went down, r will be a fraction of 1. The further from a value of 1, the greater the rate of change.
What may be confusing in the literature is that authors calculate r’s for different time periods (day, week, season), so that they are not easily comparable (since they are exponential rates, you can’t simply divide them). So I recalculated published figures for r, as well as deriving the r’s from various graphs of bee and mite populations, and then converted them all to 15-day rates. For bees, the 15-day r varies from a low of about 0.8 in late summer or late winter when the die off of aging bees greatly exceeds the amount of brood being reared, up to a high of about 1.4 during spring and early summer when colonies are exploding (at this rate, a population doubles each month). For mites, the rates are about 0.96 during winter when there is no brood, up to 1.9 when there is lots of drone brood (overall, mite r with brood present is generally about 1.4—the same as optimal bee population buildup).
And this brings up a critical point to understand about the difference between monitoring with alcohol wash vs. stickyboards (natural mite fall). Since both the mite pop and the bee pop increase during spring buildup at about the same rate (r = 1.4), they run neck and neck, and the mite infestation percentage does not change, despite the fact that the mite population is exponentially building. Now look at the yellow and far right columns (mites/300 bees and natural drop) from January 15 through July 15. The alcohol wash only increases from 2 to 18, or 9x. The natural drop increases from 5 to 313, or 62x! The first reflects the infestation rate, the second the total mite population.
Practical application: understand the difference between stickyboard counts and adult bee samples (alcohol wash, sugar shake, ether roll)—either can be misleading if you don’t understand the population dynamics involved!
The total mite population doesn’t make much difference initially, as a large colony can tolerate a large number of mites so long as the infestation rate doesn’t get too high. The problem is, that in the bee vs. mite race, as the bees start to slow down in midsummer, the mites keep charging ahead, and can quickly gain the upper hand!
Now look at columns 4 and 8 in the table above—these are the resulting r’s from the calculations for each time period (changing any variable may change the r for that time period). Note that the mite r often exceeds the bee r (this is for California; bees in northern climes are able to get more ahead of the mites during their explosive spring buildup). Any time that mite r is greater than the bee r, the percent mite infestation increases. But that increase is not really noticeable until the bee r drops below a value of 1. In my area, that happens about July 1. But there is still plenty of brood in which the mites can continue reproducing, so the mite r remains higher than the bee r. As a result, the percent infestation suddenly starts to increase greatly—look at the red line in the graph below! It really takes off in July (invisibly because you have honey supers on)—not because the mites are reproducing faster, but because the bee population growth has just then turned to negative, while the mite r remains positive (a negative bee r coupled with a positive mite r is a recipe for disaster).
Take home message: the time when both the mite infestation rate and virus epidemics take off is right after the main flow when the bees throttle down broodrearing!
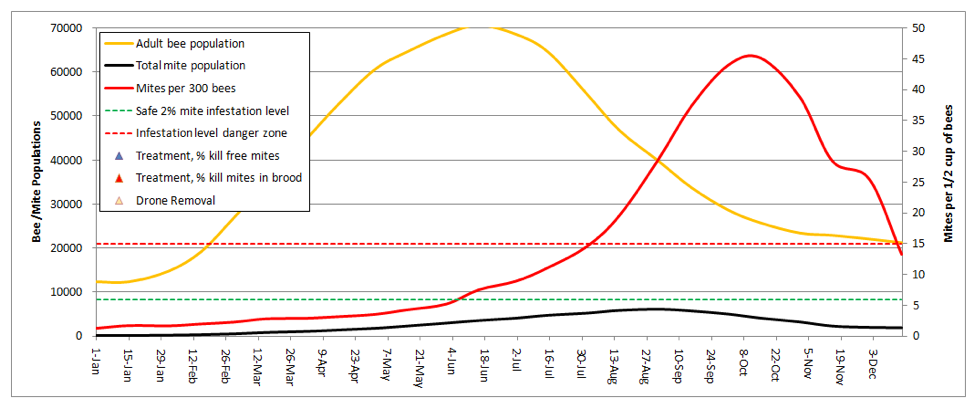
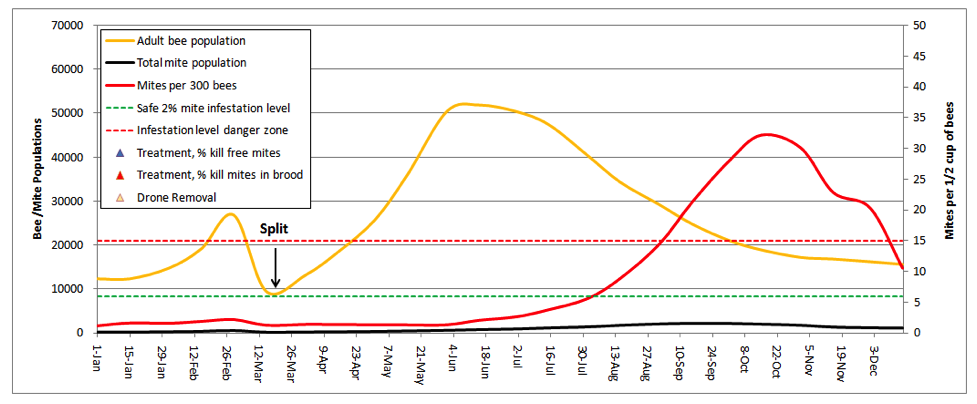
The Graph
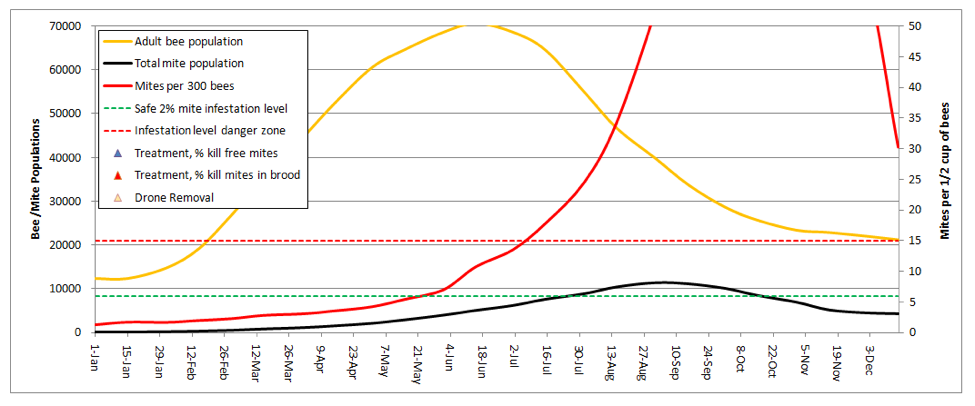 The graphical output consists of only three plots—the bee and mite populations in thousands (orange and black lines, respectively; left scale), and the mite count (alcohol wash) from a half cup of adult bees from the brood nest (red line–this is the critical line for the beekeeper to pay attention to).
Note that I set the right hand scale for mite count at a maximum of 50 mites, since I never allow mite levels to climb above that level in my own operation. I added dotted lines for what I consider to be either the safe or dangerous mite level during late summer—I try to keep the red infestation curve below the green dotted line (well below it up ‘til July 1st), and certainly below the red dotted line.
Practical application: any time that the red mite count line goes above the red dotted line, colony health is compromised and honey production suffers. When mite counts reach about 45, it’s my observation that virus epidemics really start hammering the brood.
This graph illustrates the point that even though the total number of mites in the hive may be decreasing in fall, the infestation rate of the adult bees can continue climbing to astoundingly high levels—leading to virus epidemics in both the adult bees and the brood.
Note also that this hive would likely never reach the indicated bee population, since any hive that strong in spring would swarm (at least once) at some point. But since I can’t predict swarming, I couldn’t include it in the model.
Now Let’s Play!
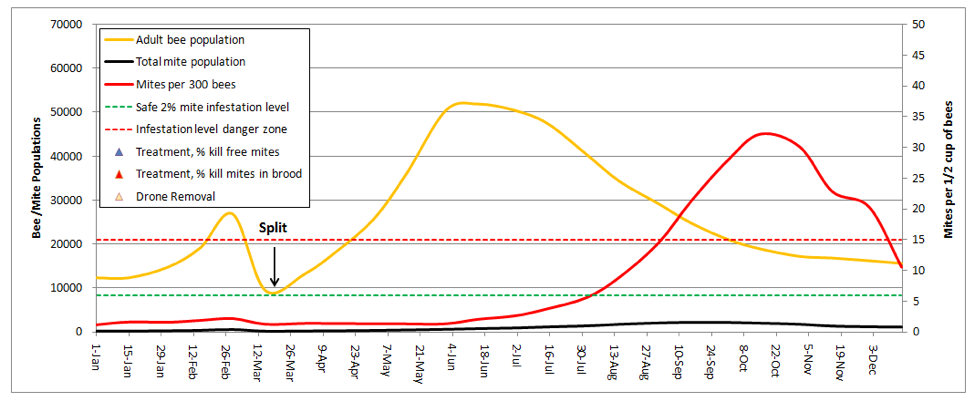
But we can still see what happens if the colony above swarms. During swarming season, roughly 2/3rds of the mites are in the brood, and cannot leave with the swarm. So if half the adult bees leave, they would only carry about 1/6 of the total mite population, leaving the poor parent colony with an even heavier relative mite burden! Here’s the graph for the same colony, swarming on May1:
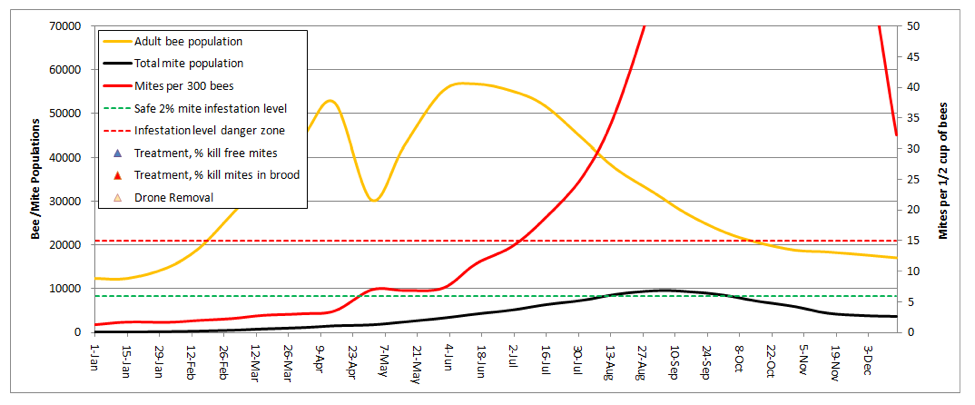
Note that the mite count briefly spikes, but then the colony goes into overdrive with the new queen and outruns the mite for a while. But the mites catch up easily by late summer. I played with the daughter swarms, which are in effect new colonies starting with only 1/6th of the mite load (and none in brood). What I found was that the earlier the swarm, the more substantial the depression of the mite level was for the rest of the season. Hence, we see that the (mite resistant) Russian bees have the trait of swarming early and often! It is an effective survival strategy against the mite—the parent colony may die, but the relatively mite-free daughter colonies survive.
Now let’s look at the effect of drought—tangible to me, since California has only recently come out of one, and my mite buildup is noticeably quicker this season!
The only variable that I changed was to increase the hot/dry input by one notch (in the program I set the degree of mite suppression by dry weather such that at the highest setting, the daily r for mite increase matches published data from hot Mediterranean climates). Note that now the highest mite count has come down substantially (to the level that I observed in my own untreated test hives during the drought).
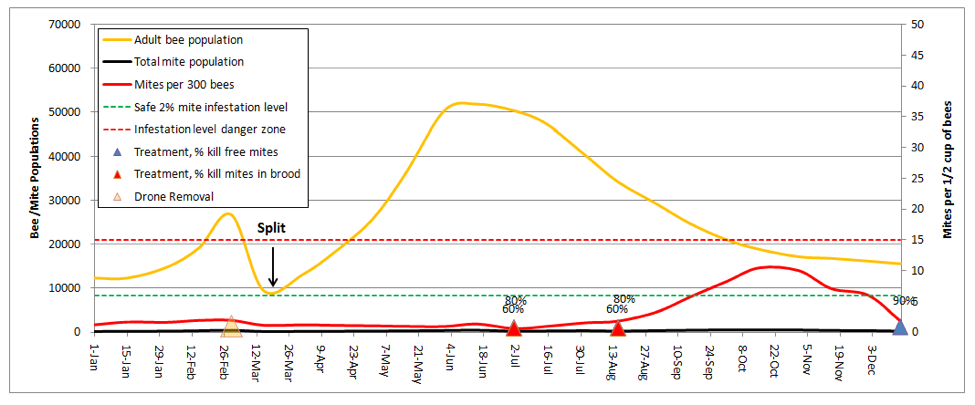
Making Splits
When I talk with beekeepers who consistently bring strong colonies to almonds, the single factor that they have in common is that they make a lot of splits. Dr. Eric Mussen describes this practice as keeping your colonies “forever young.” In my own operation, we split all our hives down to 5-frame nucs after almonds. Let’s see how that looks (I’ll reset the weather back to normal):
I was really struck by this graph! It explained why I find early splitting to be so effective at suppressing mite levels. In dry years, the colonies that build from my splits don’t reach worrisome mite levels until August. And the main reason that they do so is from mite immigration from the robbing out of dying hives elsewhere (in this simulation, the hive picked up a total of 1350 mites from other hives, which is the only reason that the mite count ever went above the danger line!). This subject was recently covered by Wyatt Mangum (2011).
Think about it—when I come home from almonds, my hives generally have 20 frames of bees, which I split 4 ways. That means that each new hive starts with only ¼ of the number of mites, and since I requeen the splits with cells, each split gets a nearly 2-week break during which there is zero mite reproduction (there’s a 12-day break in the brood cycle after splitting, and then little mite reproduction until there is enough new brood to enable hitchhiking mites to find a suitable host larvae of the right age).
During this waiting period, the mite population actually drops, due to grooming and attrition. Even better, as soon as Hopguard is registered in my state, I’ll start putting in a strip when I check back for fresh eggs—if I time it right, I can hit the mites during the approximately 1-day window in which all the mites are forced into the phoretic state just after the original brood all emerges, but before the new queen’s brood reaches the age at which mites can invade!
Once the new queen starts laying, the split then takes off with a vengeance, with an r that exceeds that of the mites, since splits don’t rear drones (drone brood is necessary for high mite reproduction rates). As a result the bees are able to outrun the mites for several weeks, which gives them a helluva head start before our dry California summer slows down mite reproduction.
Take home message: early splitting knocks the snot out of mite levels
Let’s Add Some Treatments
The point for me to create this model is that there are now so many management and treatment options, which when coupled with the choice of when to perform or apply them, that it would take a lifetime to see which combinations work best. But by running simulations on this model, you can try dozens of combinations in an hour, and see how each scenario would affect mite levels!
Let’s start by going back to the first scenario—a 10-frame colony in almonds, no splitting, but now add a dose of highly-effective miticide applied twice during the season: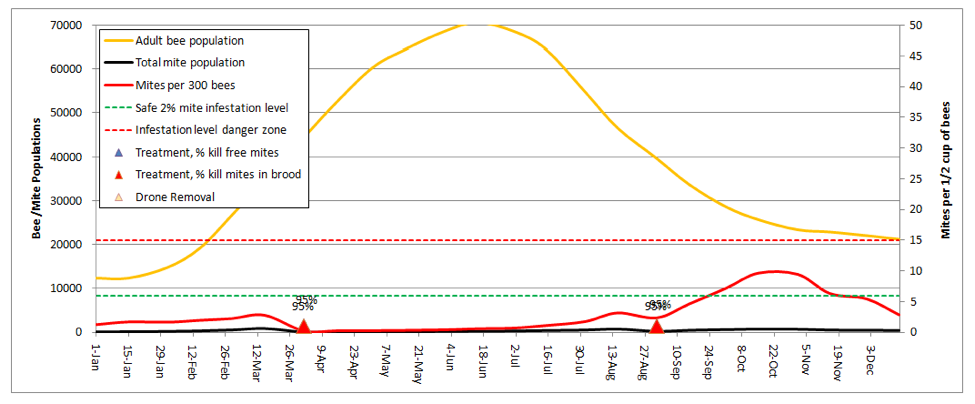
In order to keep the mite levels out of the serious danger zone in late summer, I needed to adjust the kill rates up to 95% for all mites in the hive (the model automatically shows the entered rates in the graph above the colored triangles)! As the current synthetic miticides lose their effectiveness, those 95% kill rates will become a thing of the past.
Practical application: You’d better have a Plan B!
The above graph would be misleading if your colonies don’t get huge (the above reaches 4 deeps solid with bees). If your hives only reach 3 deeps, then the red mite infestation curve would be even steeper, as there would be fewer bees to “dilute” the mites.
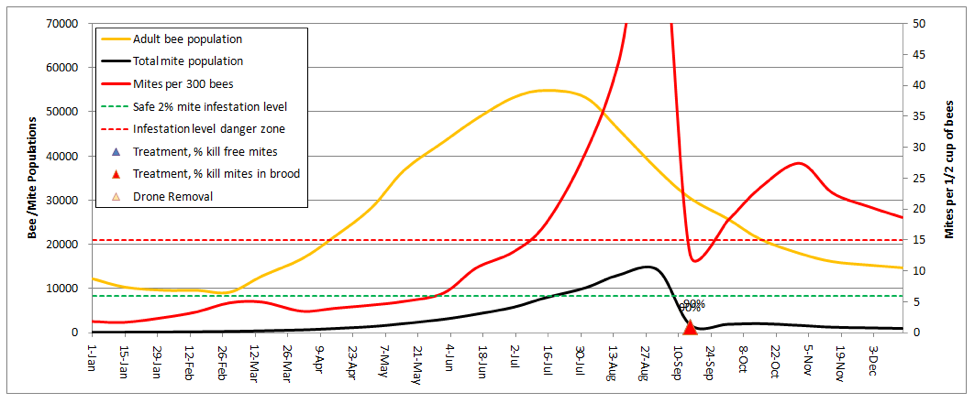
Here’s a graph of a colony under Great Plains conditions, adjusted to grow to a triple, and given a single 90% mite kill treatment on Sept 15. Look how scary the red infestation curves are during August! Even if that beekeeper manages do get mite levels down in September, it would be too late—the damage has already been done, and Deformed Wing Virus would be running rampant in the brood.
Practical application: I performed numerous runs for mite rates in hives that never got beyond triples, with immigration of 1350 mites. If I applied two treatments that killed 90% of all mites, the best results were obtained with a May treatment, followed by an early September treatment. But I was never able to prevent mite levels from going dangerously high for a short time in November, due solely to immigration! Take home: if your apiary is exposed to immigration from collapsing hives within flight range, you will likely need to add another treatment in fall.
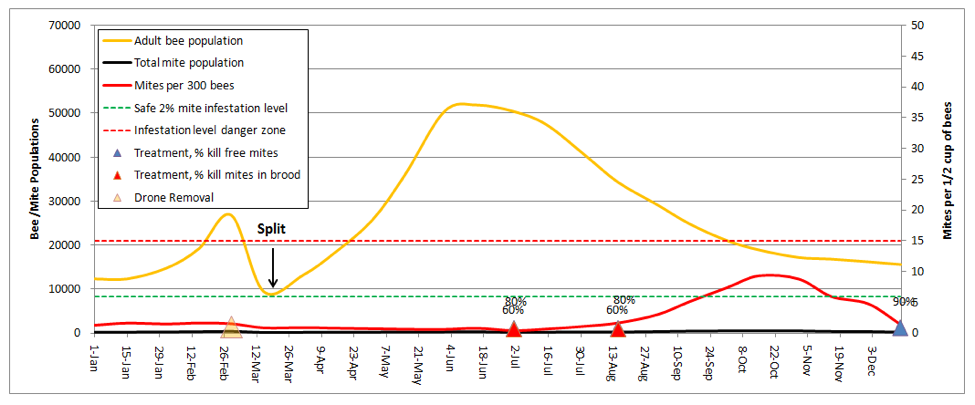
Now I’ll show you the typical treatments that I use in my own operation (my two sons have come on board as partners, so we’re now sort of The Three Stooges of Beekeeping). Nonetheless, we’re currently running about a thousand hives without benefit of synthetic miticides (for practical reasons, since I wish to keep miticide residues out of my combs). I’ll plug our typical treatments into the model— one drone brood cutout, splitting to 5 frames in late March, a half dose of Apiguard between flows and after pulling honey mid August, and an oxalic dribble in mid December. Note that I used conservative kill rates (80% of free mites, 60% of mites in brood), back calculated from the actual resulting mite wash rates that I observe. In this run, I also clicked the summer dryness up notch, and immigration down 1 tick to reflect my normal situation.
Again, the above graph of mite infestation reflects reality in my operation—during dry years, I don’t need a follow up treatment in August; in years with more mite pressure I do. If mite counts approach 10 mites per wash, I hit them again!
Practical application: note that I only used half doses of Apiguard, in order to minimize the stress to the bees. Point: if you never let mite counts get high, you don’t need a very effective treatment in order to keep them low. But always check back in case you need a follow up treatment!
One more thing—now let’s just increase the rate of varroa resistance of the bees by one little notch, to see what happens if you run slightly mite resistant stock. All else remains the same:
Adding a bit of mite resistance just took the edge off the mite counts—mite immigration is still the main problem. However, by adding a small degree of resistance to this stock, the overwintering mite number dropped from 188 to 132. What I’ve found is that by selecting for mite resistance in my stock (and bringing in the USDA’s excellent VSH and Russian lines), that I’m able to keep mite levels very low all year long. And I do this by using relatively gentle half doses of the “natural” treatments.
Let’s run it again, using a different treatment regime:
In this case, I applied Hopguard to the nucs to wipe out the mites while they were vulnerable during the brood break, followed by a MAQS formic treatment (assuming 95% kill phoretic, 90% in brood) when I pulled honey, and an oxalic dribble during a normal winter check before almonds. Total cost, about 5 bucks and a half a minute of extra labor at each of the normal hive openings. If it weren’t for immigration (1350 mites), counts would only briefly been above the green “safe” level.
And how about powdered sugar dusting? Let’s try dusting every other week, dropping half the phoretic mites each time (based upon my limited testing, 50% is likely the best you could hope for with a thorough dusting):
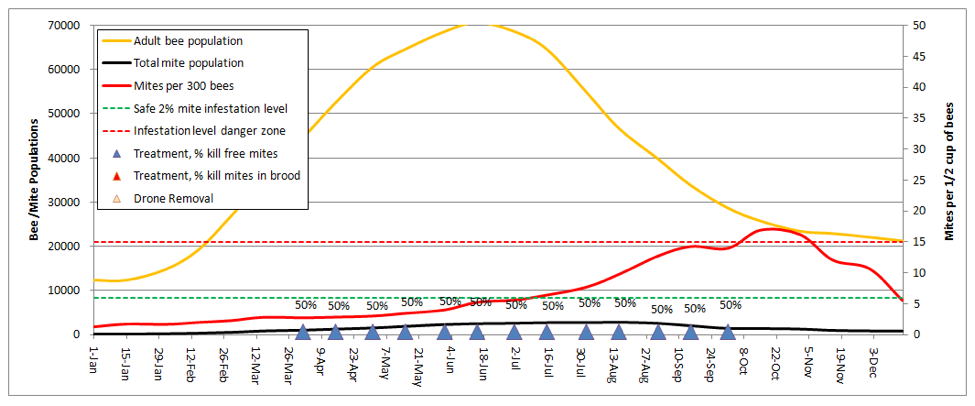
Even the diligent beekeeper, giving 13 dustings (blue triangles), will just barely be able to keep up with mite reproduction and immigration. This result is in accordance my own experience, but better than that of Ellis (2009, but whose trial was performed in an area in which a larger percentage of mites were in the brood for most months of the year).
The Goal
For my last illustration, let’s look at our ultimate goal—naturally mite-resistant stock that needs no help. I replicated the very first graph, with only two changes—I increased the two mite resistance factors to the high settings (both based upon actual data):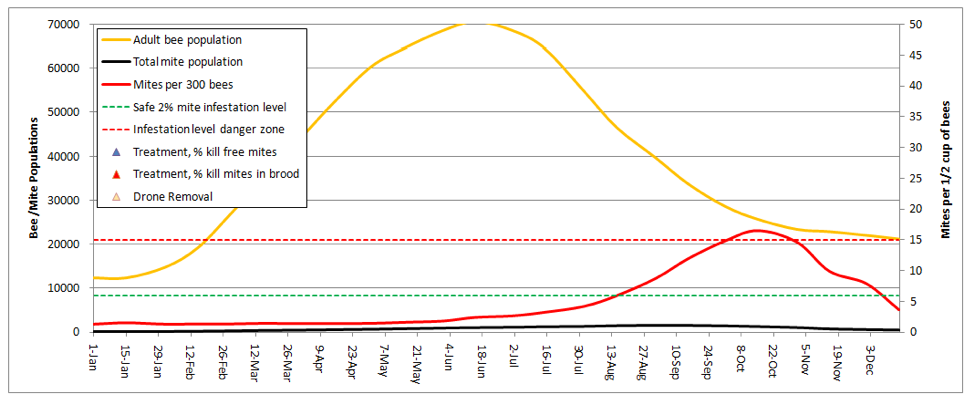
This colony held its own against the mites pretty well! Note that mite levels would never have gotten dangerously high without the immigration of 1350 mites in late summer, despite the total lack of any treatments! A point of interest is that the model predicts 500 mites at the midwinter low point, which would not indicate sustainable colony survival. However, if I took a bit of immigration pressure off, and dropped the background mite buildup rates somewhat, the model took the overwintering mites back down to near 100, which is what you’d need to see for truly mite-proof stock.
But how about them Russian bees? In my dry summer climate, they largely shut down broodrearing in late summer and scour out the now-exposed mites. When I put the broodrearing shutdown into the model, the Russians then held mites down to safe levels, despite serious mite immigration from my neighbors!
Further Development
I recently received two generous donations towards my research—from almond pollination broker Joe Traynor, and from the Virginia State Beekeepers Association. I’m using part of those donations to cover my time involved in developing this spreadsheet, and hope to make it an “open source” program to be developed in cooperation with other beekeepers and researchers, with the most up-to-date version available at my website.
This modeling spreadsheet is still very much a work in progress (I tweaked it numerous times while I was writing this article). But I think that I’ll have it ready for release to other beekeepers soon (I will announce progress in my next article). I hope then that you will find it instructive to play with, and useful for making informed management decisions! The copied graphs in this article don’t even begin to capture the fun of playing with the program, and seeing the curves immediately change in response to each input variable. Ideally, an evening spent playing with the program might save you years of hard trial and error, and help you to avoid unnecessary colony losses. With the wide range of available treatments and management options out there, you now have many choices as to how to go about riding herd on mite levels.
Get Involved!
Other mite population models that I’ve seen are based upon elegant and very complex formulas, and are predictive over the course of an entire season. Since my advanced mathematical abilities have atrophied with age, I cheated, and used a major shortcut—I simply used published population graphs (growth curves), and determined the “r” for either bee or varroa population growth for each 15-day period of the year (this gave me 24 data points—enough to plot smooth curves). The beauty of this approach is that this model only predicts 15 days ahead, and then “resets to reality” 24 times over the course of the year. I’m spending countless hours tweaking the formulas, guesstimates, and numbers until the model jibes with my own field measurements.
This model does have limitations—it does not adjust for excessive colony size, nor for the effects of mite infestation upon colony size. I would consider it unreliable at extremely high bee or mite populations. However, since neither of the above happen in my real-life operation, they matter little to my practical use of the model.
The resulting model works great for my operation under my California foothill conditions, but could be easily customized for any other area. And here’s where I’m asking for help from other beekeepers to work together in a “wiki” fashion to cooperatively develop a fuller model adjustable for other locales.
What I need are more growth curves from various areas—actual measured data would be best, but in lieu of that, I’d be happy getting the type of numbers that a well-experienced beekeeper might be able to give me off the top of his head (Tip: draw the curve). Numbers for an entire season would be best, but even figures for a portion of the year would help, so long as every number is linked to a specific date. Data for all of the following would be ideal, but numbers for any one would help:
- Colony population growth curve for your area—how many frames covered with bees over the course of a season (look up from the bottom of the box as well as from top down).
- Presence of brood—high, medium, low. I especially need to know the date of fall/winter brood shutdown, and spring initiation.
- Whether there is substantial drone rearing going on—high, medium, low.
- Mite counts over time (preferably alcohol wash, but sugar shake or sticky board OK), and the type of bee stock (is it resistant?).
- If you send mite data, please include the date and type of mite treatments used.
- Build up rate of splits—starting frame strength on a certain date, and then frame strength each succeeding 15 days. Again, data or from experience.
I need all the above taken over periods of time, with the date for each measurement. If you email me (randy@randyoliver.com) I will send you a simple spreadsheet to fill in and return.
Acknowledgements
I wish to thank all the researchers in the references, who have done the tedious counting work necessary to develop a model. We all owe a debt of gratitude to Canadian Lloyd Harris (who counted jillions of marked bees over the course of a year); his data set (which he graciously shared) is invaluable. I also thank Katie Lee for sharing her data on mite distribution in hives. I’m also grateful to Baton Rouge ARS researchers, Tom Rinderer, Bob Danka, Jeff Harris, and Jose Villa, for their correspondence and tireless work toward developing mite-resistant bee stocks.
References
Charriere, JD, et al (2003) The removal of capped drone brood: an effective means of reducing the infestation of varroa in honey bee colonies. Bee World 84 (3): 117-124.
Ellis, AM GW Hayes, and JD Ellis (2009) The efficacy of dusting honey bee colonies with powdered sugar to reduce varroa mite populations. Journal of Apicultural Research and Bee World 48(1): 72-76.
Fries I, S Camazine J Sneyd (1994) Population dynamics of Varroa jacobsoni: a model and review. Bee World 75 : 5-28.
DeGrandi-Hoffman, G and R Curry (2005) Simulated population dynamics of Varroa mites in honey bee colonies: Part II – What the VARROAPOP model reveals. Amer. Bee J. 145(8): 629-632.
Fries,I(200?) Dynamics of the parasitic (Varroa jacobsoni) population: Modeling criteria http://ressources.ciheam.org/om/pdf/c21/97605905.pdf
Harris, J.W., Harbo, J.R., Villa, J.D., Danka, R.G. 2003. Variable population growth of Varroa destructor (Mesostigmata: Varroidae) in colonies of honey bees (Hymenoptera: Apidae) during a 10-year period. Environmental Entomology/Population Ecology 32(6):1305-1312.
Harris, JL (2008) Development of honey bee colonies initiated from package bees on the northern Great Plains of North America. Journal of Apicultural Research and Bee World 47(2): 141–150.
Harris, JL (2010) The effect of requeening in late July on honey bee colony development on the Northern Great Plains of North America after removal from an indoor winter storage facility. Journal of Apicultural Research and Bee World 49(2): 159-169
Harris, JW and JR Harbo (2000) Changes in reproduction of Varroa destructor after honey bee queens were exchanged between resistant and susceptible colonies. Apidologie 31 (2000) 689–69
Lodesani, M., K. Crailsheim, and R.F.A. Moritz (2002) Effect of some characters on the population growth of mite Varroa jacobsoni in Apis mellifera L. colonies and results of bi-directional selection. J. Appl. Entomol. 126: 130-137.
Mangum, WA (2011) Varroa immigration and resistant mites. ABJ 151(5): 475-477.
Martin, S. J. (1998) A population model of the ectoparasitic mite Varroa jacobsoni in honey bee (Apis mellifera) colonies. Ecological Modeling 109: 267-281.
Murilhas, AM (2002) Varroa destructor infestation impact on Apis mellifera carnica capped worker brood production, bee population and honey storage in a Mediterranean climate. Apidologie 33:271-281.
Wantuch, HA and DR Tarpy (2009) Removal of drone brood from Apis mellifera (Hymenoptera: Apidae) colonies to control Varroa destructor (Acari: Varroidae) and retain adult drones. J. Econ. Entomol. 102(6): 2033-2040.
Wilkinson, D and G. C. Smith (2002) A model of the mite parasite, Varroa destructor, on honeybees (Apis mellifera) to investigate parameters important to mite population growth. Ecological Modeling 148(3): 263-275.


