The Seasonality of Nosema Ceranae
The Seasonality of Nosema Ceranae
Randy Oliver
ScientificBeekeeping.com
First Published in ABJ in April 2015
Nosema apis has long been known to cause disease primarily during winter and spring. Many misinterpreted Dr. Mariano Higes’ finding that one could detect spores of N. ceranae throughout the year [1] as indicating that infection was no longer seasonal. But that is actually hardly the case.
Introduction
At the peak of CCD in 2007 and 2008, we were stunned to find that an invasion of our colonies by Nosema ceranae had taken place without anyone noticing it [2]. This cousin of the “old nosema,” although introduced at an earlier date, appears to have not “caught hold” in the North American bee population until around the year 2001, and then subsequently and rapidly spread throughout the entire continent in only a few years [3].
Beekeepers and researchers struggled (and are still struggling) to understand the epidemiology and overall effects of this invasion. In retrospect, I feel that Spain’s Dr. Mariano Higes was likely correct in bringing to our attention that Nosema ceranae has likely been a major player in the reports of elevated colony mortality in many countries [4].
One much-debated point on the epidemiology is whether the seasonal prevalence of N. ceranae matched that of N. apis—i.e., being a problem only during winter and spring. At first it looked as though N. ceranae peaked in late spring, with a later and more extended seasonality than its cousin. But there were also a number of reports that the “new nosema” followed the same seasonality as the old one.
Then in 2012 Yue-Wen Chen published a study in which they tracked the intensity of N. ceranae infection over the course of 12-16 months in 7 apiaries on the subtropical to tropical island of Taiwan [5]. They found that spore counts were inversely correlated with the monthly average temperature, peaking midwinter, and declining as it warmed.
Since this finding was contrary to much of the current opinion at that time, I questioned the author via correspondence, and downloaded weather and vegetation information for the test apiaries from the Web. The data were robust, and made me question my own opinion at the time.
I occasionally test bee health products for those wishing to bring products to market. I do so with the understanding that I may publish the data I collect. As luck would have it, during 2012-2013 in the testing of one product, I tracked nosema levels in 36 colonies over the course of a year.
Materials and Methods
At the end of August 2012, at an apiary in the Sierra Foothills, we equalized 48 hives for strength and the amount of drawn combs and honey, checking for queenrightness and freedom from disease, and treated them for varroa with MAQS. On September 6 we selected the 36 strongest colonies and took our first bee samples for nosema analysis, collecting the bees from under the lid or from a top outside comb.
We continued to take monthly nosema samples (except for in February, when the hives were placed in almonds) over the course of the next 12 months (we also weighed and graded the colonies for strength at each time point, fed them as necessary, and managed varroa). In early February we removed 5 of the hives from the trial due to lack of strength, collecting data from 31 for the duration of the trial.
Previous testing had shown that my colonies are predominately infected with N. ceranae; we made no attempt to differentiate between species.
We quantified both nosema prevalence and spore counts. Prevalence was determined by performing “gut squashes” of 10 bees one at a time, scoring them 1 for highly infected, 0.5 for detectable spores, and 0 if no spores were observed [6]. An additional 25 bees from the same sample were processed via crushing them in ZiplockÒ sandwich bags and then counting spores using a hemacytometer [7]. All counts were performed by the same technician for consistency (beekeeper Leslie Gault).
We graded colonies for strength by counting number of interstices (between frames) filled with bees, viewing each box from top and bottom. I downloaded monthly mean temperatures for the apiary from a local weather station.
Results and Discussion
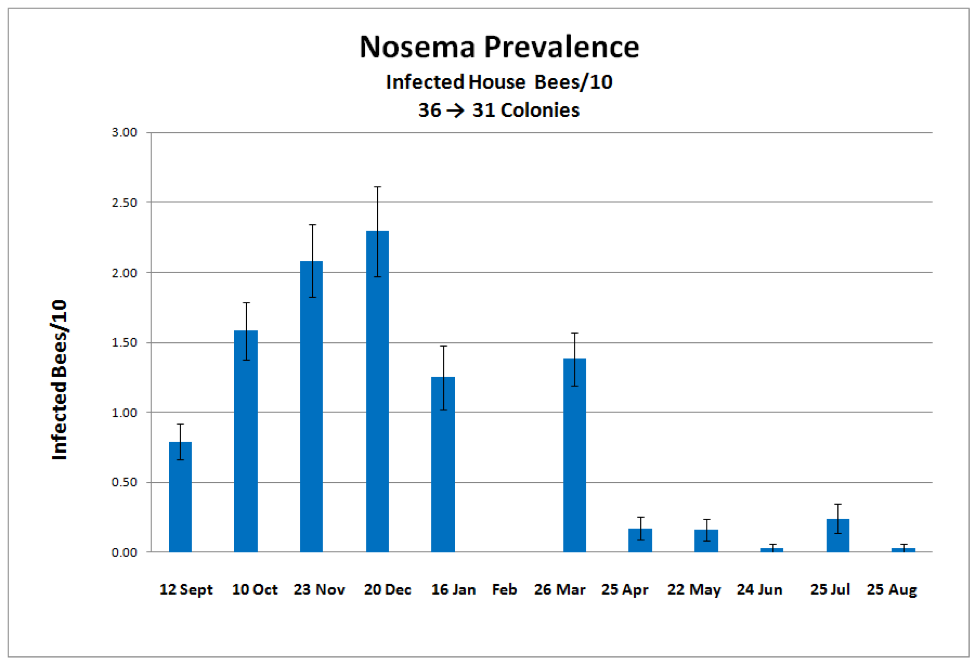
The seasonal distribution of nosema prevalence (as measured by number of infected bees out of 10) rose in autumn, peaked in late December, declined in spring, then largely disappeared by late summer (Fig. 1).
Figure 1. The mean prevalence of nosema over the course of a year, as measured the number of infected house bees in a sample of 10. The most intense prevalence of infection was 8 bees out of 10.
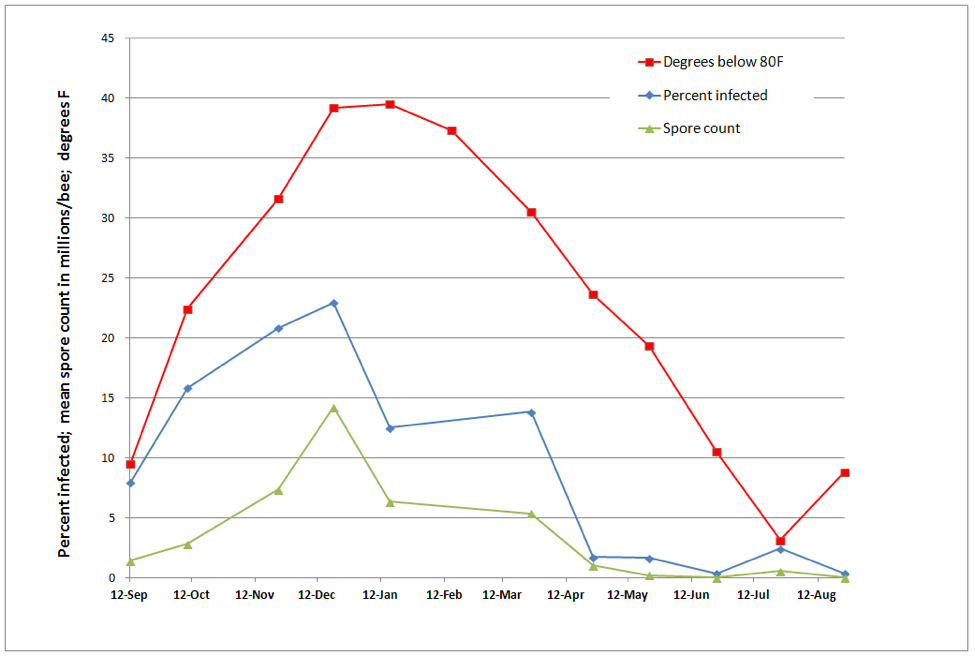
Mean spore counts followed the same trend (Fig. 2).
Figure 2. Mean spore counts of samples of 25 bees. The highest count was over 44 million spores/bee (not surprisingly, from the same sample with the highest prevalence).
Note how the above data support Dr. Eric Mussen’s findings that a spore count from 10 bees generally correlates with the prevalence of nosema infection–whether for N. apis or ceranae.
In order to better illustrate the relationship between mean monthly temperatures and nosema levels, I arbitrarily subtracted the temperature from 80°F in order to invert the temperature curve (so it curve in the same direction as nosema intensity). To my surprise, our results exactly matched those from Taiwan (Fig. 3).
Figure 3. Correlations between spore counts, percent of bees infected with nosema, and mean monthly temperature. The prevalence of N. ceranae appears to be strongly temperature dependent in my area, peaking during midwinter cold, and declining markedly during summer.
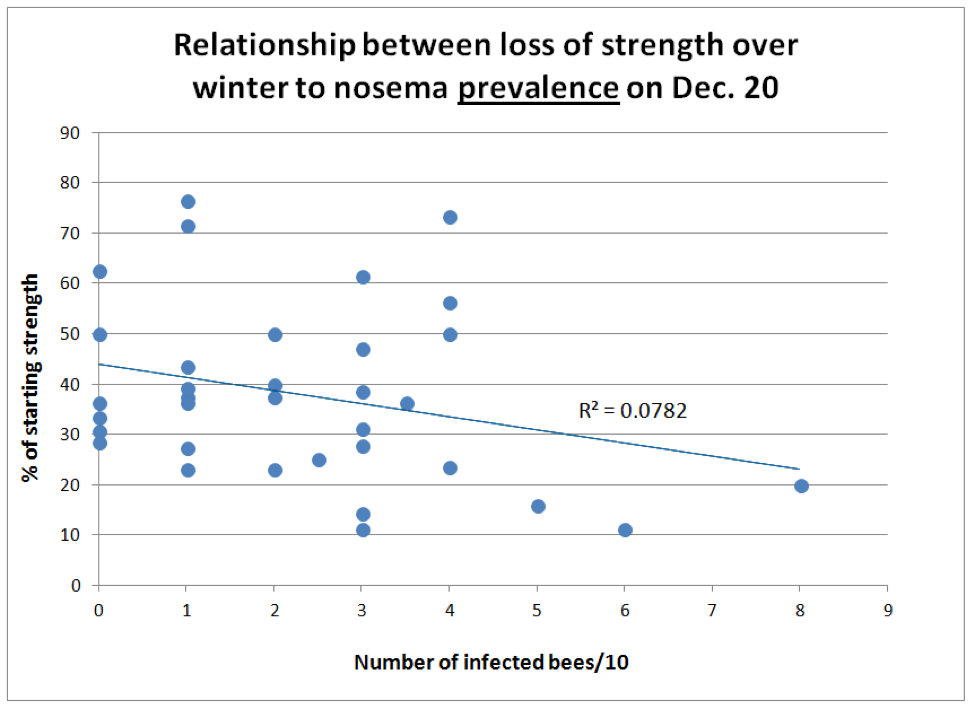
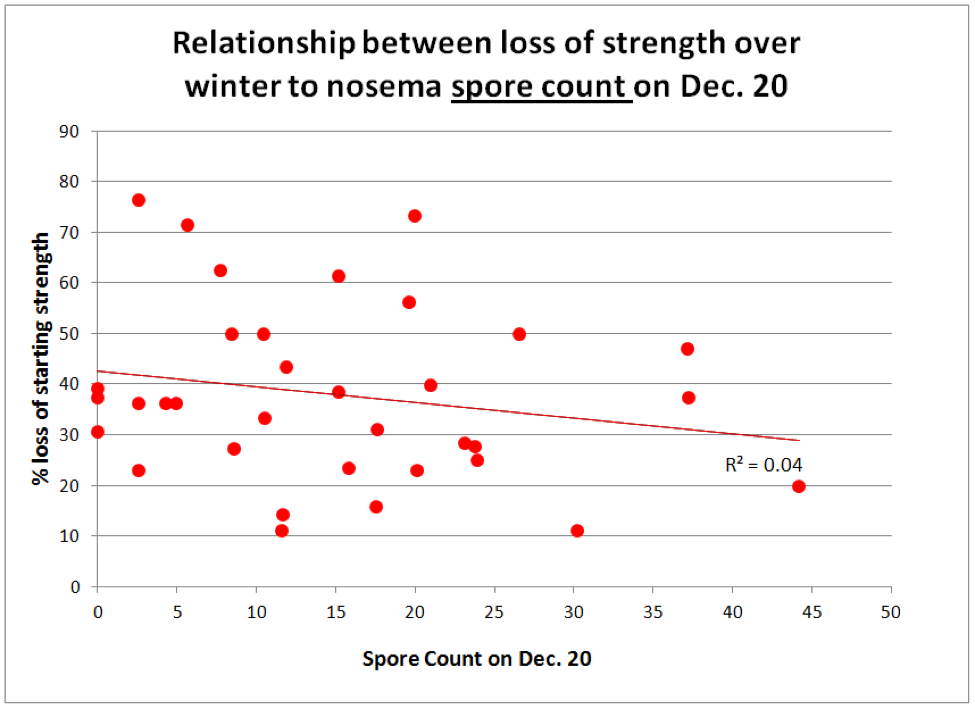
I fully expected to find a correlation between the presence of nosema and the decline of colony strength from autumn to midwinter. Again, to my surprise, this was not the case (Figs. 4 & 5).
Figure 4. There was little correlation between nosema prevalence on Dec. 20 and loss of colony strength from Sept. 12 through Jan 16 (n = 34 colonies). But notice how none of the colonies with over 4 out of 10 bees infected performed well.
Figure 5. Ditto for the level of nosema as measured by spore count.
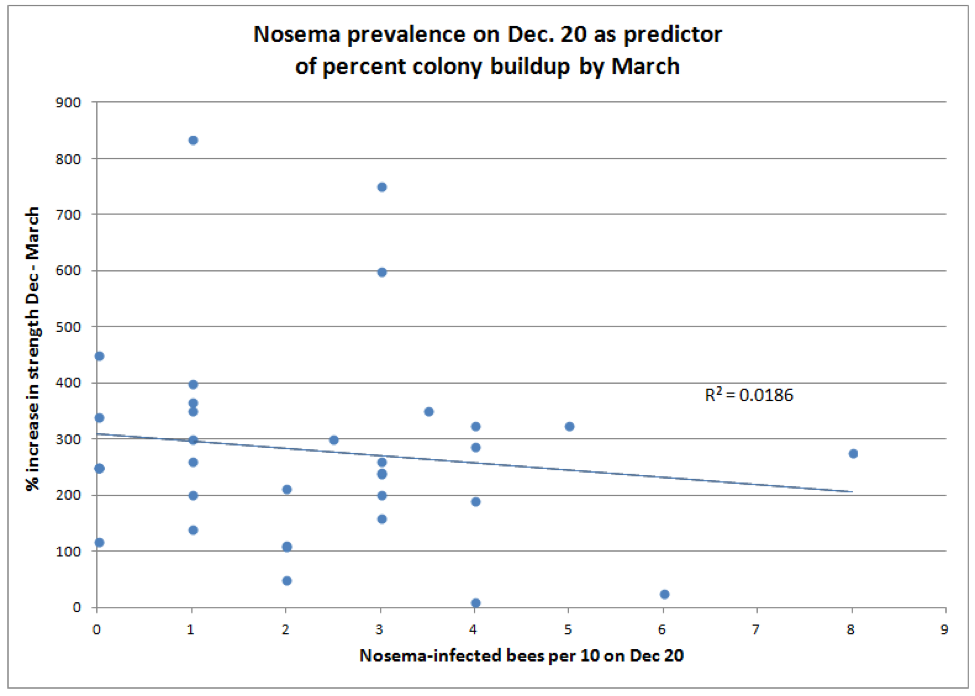
Surprisingly, the amount of decline in colony strength over winter was not correlated with the degree of nosema infection on Dec. 20. Surely though, you’d expect to see a correlation between spring buildup and the incidence of nosema (Fig. 6).
Figure 6. There was virtually no correlation between nosema prevalence in December and rate of colony buildup by March, although those colonies with lower December nosema counts tended to be slighter stronger in March overall (not shown).
What, you say, this makes no sense at all! This data set indicates that the degree of infection by N. ceranae in samples of house bees was not correlated with the loss of colony strength during the first half of winter; nor could it be used as a predictor for the degree of colony buildup in spring. I know–not what I expected either.
I’m still closely following published research on nosema, as well as collecting new, and cranking old data to try to figure out just how Nosema ceranae fits into the picture of colony morbidity and mortality. Although there is a goodly amount of evidence to support the notion that N. ceranae is a player, I hesitate to draw conclusions.
What I have observed is that under good conditions in spring, it’s possible for colonies to thrive with spore counts exceeding 5 million. However, I seldom find nosema in my strongest colonies; on the other hand I often find it in the weakest (especially in winter and early spring). It’s often present in dwindling colonies during early spring, and mostly absent in my hives in California in August (but others elsewhere report epidemics of it during summer).
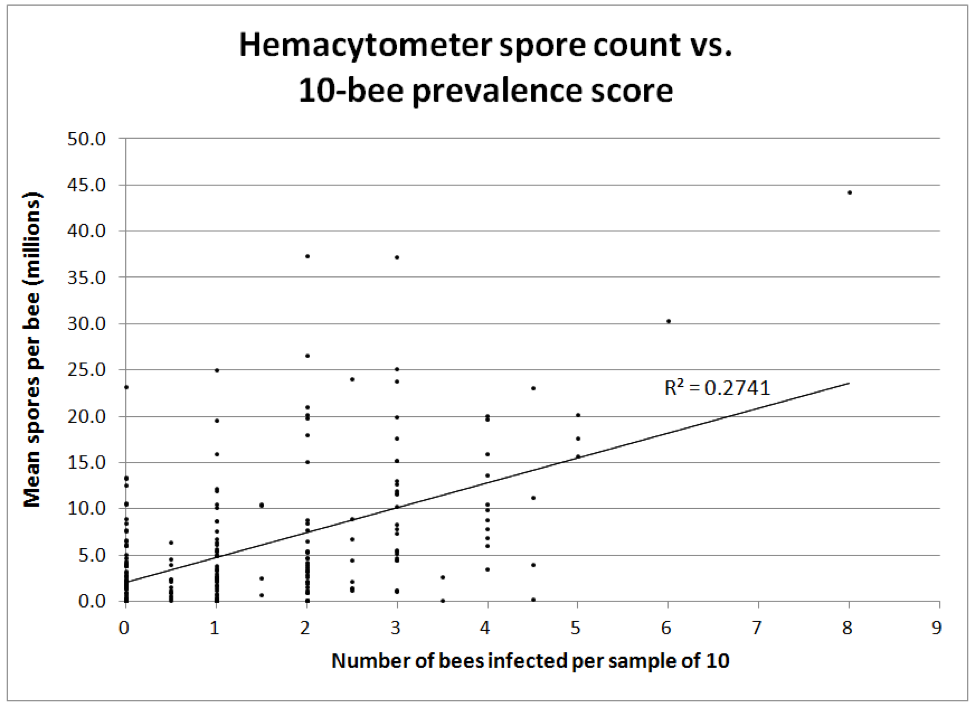
As observed by White in 1919 [8] for N. apis, there appears to be a tipping point for colony health if more than about 40-50% of the bees in a hive become infected. I favor individually squashing 10 bees to really get a handle on the degree of infection in a hive (Fig. 7).
Figure 7. The correlation between two methods of monitoring nosema intensity—by either individually determining the presence of infection in each bee from a sample of 10 vs. Cantwell’s hemacytometer count of a pooled sample of 25 bees (both methods take about the same amount of time). All bees were taken from under the cover or from an upper outside comb. n = 242 paired samples equally taken from September through April. Note how misleading spore counts can be—many colonies with only 1 or 2 bees out of 10 infected had spore counts above 10 million, and some low spore counts missed the actual degree of infection of the colony as a whole.
The correlation between spore counts and prevalence of infected bees in a hive roughly correlates, but the 10-individual-bee squash is likely the more reflective of the actual and immediate impact of infection upon the colony. But remember that neither appear to be very good indicators of later colony performance.
The presence of dysentery is also a poor indicator, especially for N. ceranae, which does not appear to cause dysentery in any way. However, dysentery due to other causes would certainly increase the transmission of nosema, if present, within the hive. I suspect that many beekeepers needlessly waste money on nosema treatments due to seeing dysentery. That’s not to say that treatments can’t be useful should nosema actually be present.
Practical application: dysentery is not a sign of nosema infection. The only symptoms that I’ve seen are poor buildup, a low bee to brood ratio, dwindling, and sometimes crawlers on the ground. The only way to be sure is to use a microscope. Spore counts of a pooled sample of bees (even from several colonies combined) will quickly tell you whether nosema is present. A look at the guts of 10 individual bees under the ‘scope will tell you just how seriously a colony is infected.
My current take on nosema is that it is an opportunistic pathogen, always there at a low level, but only becoming a problem when colonies are already stressed by chilling, viruses, poor nutrition, and perhaps environmental toxins. The effect would likely be most pronounced in colonies of aged winter bees, especially during the spring turnover. The troika of chilling, paralytic viruses, and nosema appears to be especially deadly. So it may not be that N. ceranae initiates disease, but rather that it takes advantage of weakened bees and delivers the killing blow by causing rapid abandonment of the hive by the infected bees.
I’ve been tracking N. ceranae in my operation since 2006. It appears–typically of emerging pathogens–that the initial wave of invasion was the worst, hitting us just as CCD reared its ugly head (nosema is one of the few pathogens clearly known to cause sudden colony depopulation). The wave of invasion was perhaps worst from about 2004 to 2009, as the parasite wrought havoc in a relatively “naïve” host population. Likely, the most susceptible stocks of bees were quickly eliminated by natural selection. In recent years, I’m seeing less and less nosema in my operation, despite the fact that I’ve never treated for it to any extent.
The best prevention of nosema problems appears to be to run resistant stock, keep young queens, minimize chilling, provide protein supplementation if necessary, and to isolate dwindling colonies. A number of companies are working to develop products to help treat nosemosis—perhaps I’ll test some later this year.
Acknowledgements
I thank beekeeper Leslie Gault for her diligence in squashing bees and counting spores, and to Dr. Mariano Higes, who has, despite questioning by his peers (including myself in frequent correspondence), continued to pound the drum about the impact of Nosema ceranae on colony health worldwide. I also wish to thank those beekeepers contributing to ScientificBeekeeping.com, who funded my analysis of the data.
Citations and Footnotes
[1] Martin-Hernandez, R, et al (2007) Outcome of colonization of Apis mellifera by Nosema ceranae. Applied and Environmental Microbiology 73(20): 6331-6338. Open acess.
[2] https://scientificbeekeeping.com/the-nosema-twins-part-1/
[3] See Fig. 3 in https://scientificbeekeeping.com/sick-bees-17a-nosema-the-smoldering-epidemic/
[4] Higes, M, et al (2006) Nosema ceranae, a new microsporidian parasite in honeybees in Europe. Journal of Invertebrate Pathology 92(2): 93–95.
Higes, M, et al (2008) How natural infection by Nosema ceranae causes honeybee colony collapse. Environ Microbiol 10: 2659–2669. Open access.
Higes, M, et al (2010) Nosema ceranae in Europe: an emergent type C nosemosis. Apidologie 41(3): 375-392. Open access.
[5] Chen, Y-W, et al (2012) Nosema ceranae infection intensity highly correlates with temperature. J Invertebr Pathol 111(3):264-7. Compare my graph to their Fig. 2.
[6] https://scientificbeekeeping.com/sick-bees-part-16-the-quick-squash-method/
[7] https://scientificbeekeeping.com/sick-bees-part-13-simple-microscopy-of-nosema/
[8] White, GF (1919) Nosema-Disease. USDA Bulletin No. 780. Open access.


