


2012 Almond Pollination Update
2012 Almond Pollination Update
ScientificBeekeeping.com
First Published in ABJ in April 2012
Randy Oliver
Who woulda thunk, what with all the lousy weather last spring, widespread summer drought, the reports of massive queen failures, the disastrous honey crop, and the high winter losses of the past few years, that there would have been enough colonies for almond pollination this winter? But to most everyone’s surprise, there was!
It seems like a lifetime ago that I wrote my first article for ABJ–on the status of almond pollination, way back in 2007! I’m typing these words during the middle of almond bloom 2012, and just spent the day in the orchards tending to my hives. The bloom today is on strong, and the weather perfect, with several varieties simultaneously in bloom (Fig. 1), which augurs well for a good harvest.
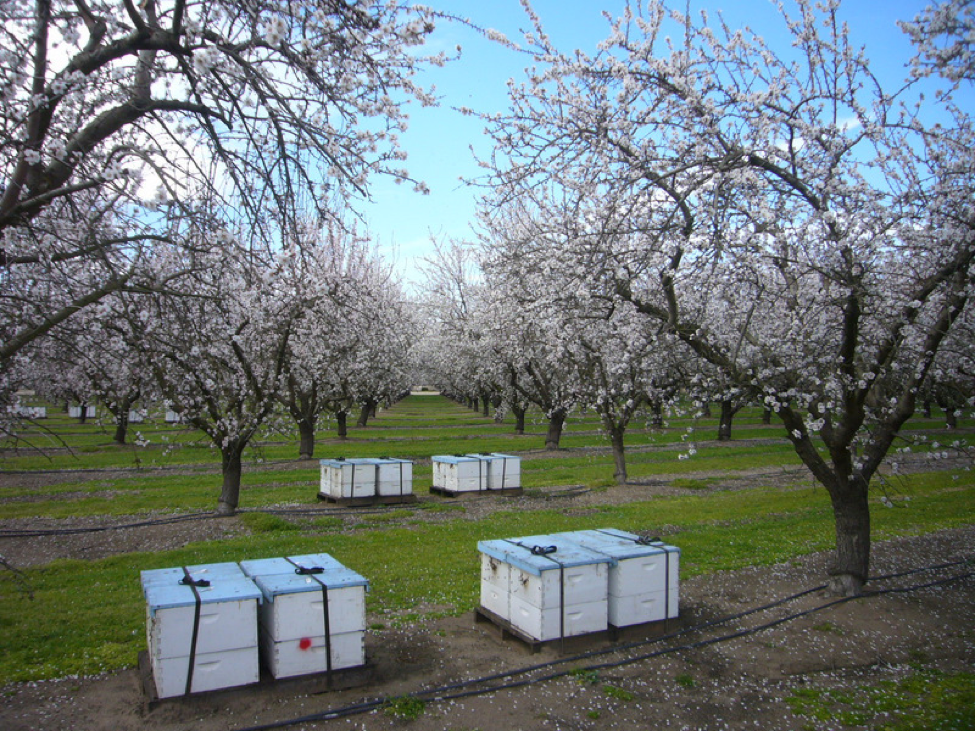
Figure 1. Almonds in bloom in the Central Valley last season. The cool, damp weather extended the bloom for the longest duration in memory; both growers and beekeepers were surprised that a record crop was set! For you trivia buffs, the average tree last year set 7,353 individual nuts (I have not personally confirmed that figure).
Back in 2007, there had been a sea change in the beekeeping industry, shifting from primarily being honey producers, to instead depending upon pollination rental income from a single crop in California. The Golden State is now host to a million out-of-state bee hives which come to celebrate Valentine’s Day in the almond orchards. These immigrant pollinators outnumber California hives two to one. They arrive by pickup truck, flatbeds, and semi trailers, bringing with them every new strain of pest and pathogen from the far corners of the country, do their job (paying taxes to California as of last year), and then leave.
The big question each winter since 2004/2005 is whether there will be enough colonies to fulfill the pollination demand, and just how much growers are willing to pay for those hives.
More trivia: it took about 1.5 million colonies of bees to pollinate 750,000 bearing acres of almond trees, producing nearly 2 billion pounds of nutmeats. That means that on average, every colony pollinated about 1333 lbs of nuts, and at a wholesale price of about $2/lb, each colony’s efforts contributed to a gross return to the grower of $2666.00! If we divide that value by the approximate number of bees in an 8-frame colony (14,000), that means that each individual bee, on average, pollinated 19¢ worth of nuts. And at a $150 per hive rental rate, each bee rented at 1¢ for a month’s wages.
Supply and Demand
The supply of bees this season for almonds just barely met demand—it was neither short nor long. This indicates that the supply and demand market worked perfectly. It also indicates that the current offered rental rates are likely something that both growers and beekeepers can bank on, provided that the growers keep planting new acreage, that the world continues to crave almond nutmeats, and that colony winter mortality doesn’t suddenly go up to 50% or drop back to the 5-10% that we enjoyed prior to our bees having to share their blood with the varroa mite.
Adam Smith’s “invisible hand of the market” is clearly working as expected. The pollination needs of the growers are being met, and beekeepers are receiving adequate monetary incentive to supply enough colonies to continue to meet the growers’ needs.
So how does this unregulated and inefficient market manage to work so well to reach equilibrium? It’s driven by the simple bidding of almond growers against each other for a service that beekeepers are willing to provide. The economic demand for hives is relatively “inelastic”—growers need bees in order to set a crop, independent of the price. But the important thing to keep in mind is that the beekeepers do not set the average price for pollination contracts—it’s impossible for us to rig prices, since there is no way to keep beekeepers from undercutting one another (otherwise, in this inelastic market, we’d all be charging $200 per hive). Rather, beekeepers respond to the price that growers offer and adjust the number of colonies that they run based upon the degree of profitability of hauling them to almonds. It’s up to the growers to offer enough incentive for beekeepers to ramp up their numbers.
Just prior to bloom each year, we see the extremes: if the supply of bees is “long,” desperate out-of-state beekeepers trying to recoup hauling costs for hives for which they couldn’t find placement will advertize them for as low as $80 (the lowest price that I heard of this year). On the other hand, should supply be short, growers desperate to fulfill the crop insurance requirement for placing two 6-frame colonies per acre (USDA 2010) will bid the price up to $200 per hive (happened last year). The funny thing is that the next season the growers only remember the lowest advertized price; conversely, the beekeepers all remember the highest! The reality is that those extreme last-minute prices paid for a few hives only represent a drop in the bucket, and have little to do with the setting of a fair price for the other 99% already in place.
So the market, after some oscillations in recent years, seems to have settled upon a figure of around $140-$160 per 8-frame colony, sometimes with bonuses for stronger hives. At this price, Dave Mendes may find it worth the cost and hassle to haul thousands of hives from Florida to California (and is even more attractive for me hauling them the mere 100 miles to the orchards that I pollinate).
Colony Collapse and the Price of Rentals
CCD has been a mixed blessing for beekeepers—it caused disastrous losses for some, but has also grabbed the public’s attention about the plight of bees and beekeepers. Such attention has made it a tiny bit easier for almond growers to swallow the incredible jump in pollination prices since 2004 (Fig. 2). But the good news for those growers is that by dint of hard work and ingenuity, beekeepers have generally managed to supply enough hives each year. Most of us long-time almond pollinators have good relations with our growers, and certainly do not feel that we are gouging them. I want my growers to get rich–so that they are able to pay me a sustainable price for my hives! It appears that an inflation-adjusted price of around $150 is sustainable.
A recent economic analysis of almond pollination prices (Rucker 2012) concludes:
“Based on media reports, attentive readers who have tracked the issue might infer that managed U.S. honey bee populations are nearly gone. Our examination of the operation of pollination markets leads us to conclude that beekeepers are savvy entrepreneurs who use their wealth of knowledge of the particular circumstances of time and place—acquired over their lifetimes of work—to adapt quickly to changing market conditions. Not only was there not a failure of bee-related markets, but they adapted quickly and effectively to the changes induced by the appearance of Colony Collapse Disorder.”
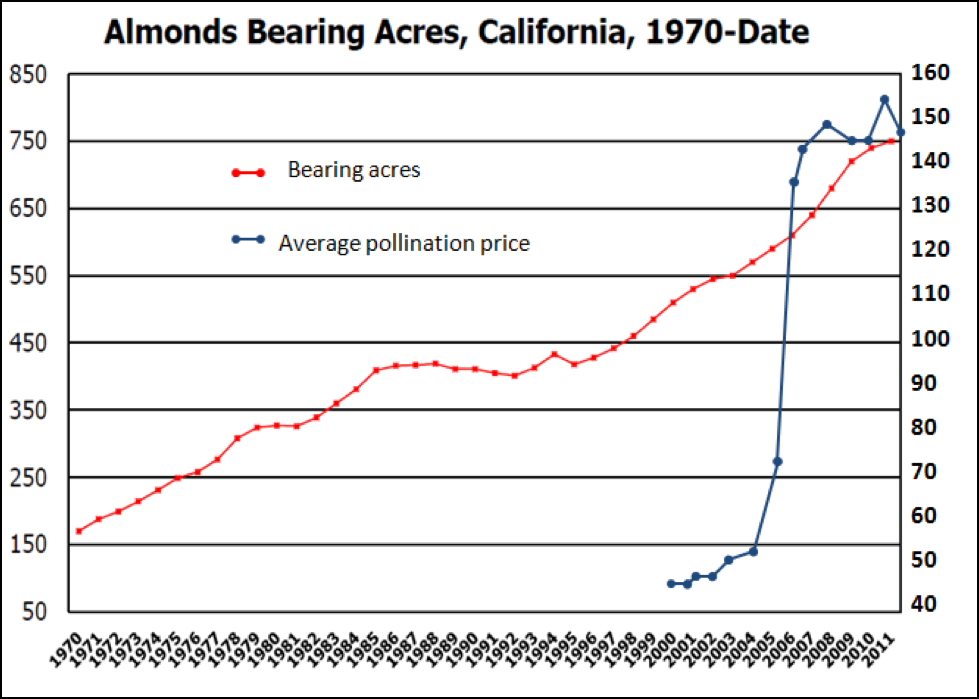
Figure 2. Acres of bearing almond trees in California (left scale, in thousands) vs. pollination rental rate (right scale, in dollars). Note that it wasn’t any sudden surge in demand that caused prices to skyrocket—it was due to the sudden relative shortage of bees. Sources: Doug Flohr (2011), USDA, NASS, California Field Office, by permission; Almond Board of California; 2012 estimate.
The abrupt rise in pollination rental rates from 2005-2008 was a supply and demand “adjustment.” Although increased acreage of bearing almond orchards indeed increased the demand somewhat, it certainly wasn’t the main cause for the abrupt increase in prices—that was due to lack of supply—the number of colonies available for rent. The California State Beekeepers survey estimated that the winter mortality rate in 2004/2005 doubled from the previous year’s 15 percent to 30 percent (Sumner 2006). The resulting shortage of bees caused prices to start climbing. Then in 2005/2006, “On the heels of the 2005 shortage, some almond growers wished to secure their bees early for 2006” (Mussen 2006), and things started to get exciting!
Up until that winter, the growers had been able to bluff the beekeepers into thinking that there was no way that they could possibly afford to pay another penny for hive rent. But then, anticipating another shortage, they suddenly they went into a bidding frenzy for the short supply of available bees, driving the price up to an unheard of $150. The growers had been forced to tip their hand, and we stunned beekeepers got a taste of what the growers were really willing and able to pay for bees. There was no turning back!
Increased Winter Mortality
That high winter mortality rate continued to persist through last year (it appears to have abated somewhat this season). As much as we’d like to blame it on a single cause, in reality there were a number of reasons. The high fall/winter losses for 2004/2005 and 2005/2006 can largely be attributed to the failure of miticides (and beekeeper management) to control varroa, and to poor late-summer forage in some regions (Mussen 2006). (We may see a return of major mite issues next fall if are unable to adjust to the unavailability of a current popular miticide).
Additionally, as I’m pointing out in my articles on Nosema ceranae, that parasite also likely started adding an additional degree of stress about that time. Plus, in 2005/2006, some operations (including my own) suffered from a serious epidemic of “corn-yellow EFB-like” sick brood and unusual sudden collapses. Then in 2006/2007 Dave Hackenberg became the industry spokesperson for the syndrome that came to be known as Colony Collapse Disorder.
Folk rushed to place their bets upon what caused CCD—blaming everything from cell phones or jet chemtrails, to genetically-modified crops or systemic pesticides, to previously unnamed viruses. Since CCD issues seem to be abating this year, a number of those suspects can likely be exonerated. What is important to keep in mind is that beekeepers, given enough economic incentive, figure out how to deal with things.
Rucker explains: “What should be understood is that the state of the honey bee population—numbers, vitality, and economic output—are the products of not just the impact of disease but also the economic decisions made by beekeepers and farmers.”
If beekeepers’ primary income is from almond pollination, then they are going to do whatever it takes to ramp up their numbers. As Sumner (2006) pointed out, many of those colonies are likely to be “unemployed” for the rest of the season, and must be maintained at considerable expense by trucking them to good forage if you can find it, or by costly supplemental feeding. Sumner predicted, “The result is that rather than receiving half or one third of their annual revenue from almonds, many commercial pollinators may now require almonds to cover most of their annual cost of colony maintenance. If this scenario develops as described, we may expect the pollination fee for almonds to remain high.” Sumner was clearly prophetic.
As you can see by the graph above, due to the infusion of additional money from the almond industry, the beekeeping industry quickly responded to the problem of 30% winter losses; by 2008/2009 pollination prices had restabilized, but at a considerably higher set point.
So let’s take a look at the various market forces involved, specifically the demand for bees, based upon the amount of bearing acreage, and the supply of bees, which is largely determined by the wholesale price of honey and the amount of winter mortality.
The Beekeepers’ Situation
When honey prices were low, and winter losses starting hitting 35%, beekeeping for many became unprofitable. The almond growers stepped up and threw the beekeepers a lifeline in the form of higher rental income from pollination. And for that we beekeepers should be immensely grateful. In the past two years I’ve even heard beekeepers saying that times now are pretty good—with both honey and pollination prices at historically high levels, they are actually making money (myself included).
And then comes this year, with a completely unexpected full supply of bees for almonds! CCD seems to have largely disappeared (which is why “Disappearing Disease” used to be called just that—the disease would spontaneously disappear). The question now is, will there be an excess supply of bees next season exerting downward pressure on rental rates?
A projected shortage of strong colonies is the main bargaining chip for beekeepers. But that doesn’t mean that lack of shortage is going to drive down pollination rates to any great extent, since the degree of supply directly reflects the return on investment to beekeepers. In order to maintain high colony numbers, commercial beekeepers today spend a fortune on trucking, queen replacement, medications, pollen supplements, and syrup; not to mention about twice as much labor per hive as back in the day.
A typical migratory pollinator nowadays may need to replace 50-70% of his colonies over the course of a season. The “three P’s”—pathogens, pesticides, and poor nutrition are a deadly combination to bee health, and the necessary crowding of hives exacerbates the problems.
The need to make up replacement colonies from splits eats into income that might have otherwise been made from the unsplit hives (Harmon 2011). And it’s much more expensive to try to build up your operation late in the season in time for almond pollination, than it would be to work instead with the normal honey bee seasonal cycle and split colonies on natural pollen flows in early spring (too late for almonds). So unless there’s enough reward in the almond orchards, it simply won’t be worth it for beekeepers to maintain the numbers of strong hives that the growers desire.
But there are always some beekeepers who for some danged reason or another just give their bees away in almonds! Beekeepers could learn from the almond industry. At a recent almond growers’ convention (Waycott 2012), Brian Ezell from Paramount Farms explained that:
- “Growers & Sellers must place value in what we produce. Buyers do not expect our industry to sell below the cost of production, but they will gladly let us!
- Growers must draw the line on acceptable grower returns. There is never a reason to sell any…almond below the cost of production.”
Beekeepers should take this sage advice to heart! Those who rent hives at less than the cost of production destabilize the market and hurt us all.
There is a term used in economics: the “marginal cost of production”–the cost of producing one more unit of a particular good. In the case of the supply of hives for almonds, that would be the cost to add one additional strong hive to the overall supply of bees (including the placement cost required to get them in and out of the orchard). In an expanding market, such as the demand for hives in almonds, the price paid by the buyer must allow the supplier to recoup his marginal cost of production.
So what’s the cost of production of a new hive? I don’t know how much it takes for the rest of you to produce an additional hive for almonds, but I figure over $200, so that fact alone suggests that colony rental rates won’t be dropping much.
But is it fair to compare the marginal cost of production to something that is merely rented out? Perhaps we should rather be looking at the “return on assets”—in the case of beekeepers, the question would be, is running an additional hive a good “investment”? Data from an informal survey by Dr. Eric Mussen (2009) suggested that at that time it cost a beekeeper about $180 to maintain an 8-frame hive for a year—and costs have gone nowhere but up since then. Granted, that hive, if well managed and if the weather cooperates, may return some income from honey or other pollination contracts, but many beekeepers base their colony count upon a break-even in almonds. So if a temporary glut of hives occurs, my guess is that the supply will quickly adjust downward the next year.
There is also the “reserve pool” of potential hives that are not normally brought to almond pollination (these are akin to the “carryout” reserve of commodity crops). These hives belong to honey producers who simply don’t find the price offered for almond contracts to be worth the time, trouble, cost, and risk to haul them to California. This reserve acts as a stabilizing force for the market price—should the growers suddenly get desperate due to a major shortage and start offering $200, then that would be enough motivation for some of those reserve hives to get put onto trucks. Conversely, if the offered bid dropped to only $100, even more hives would pass on almond pollination, and instead spend the winter resting (along with their owners).
Bottom line: the number of colonies available for rent reflects the degree of profitability to the beekeeper. Both the marginal cost of production and the return on assets suggest that the sustainable price for almond rental fees for 8-frame colonies will remain at around the current price, and adjust upward for inflation.
The Growers’ Situation
The cost of production for almonds is currently approaching $4000 per acre if you calculate it by the book (Klonsky 2011, 2011), although that high theoretical cost should be taken with a grain of salt. Renting two hives per acre at $140/hive accounts for about 7% of theoretical production costs—in the same ballpark as either irrigation or fertilizer.
However, grower return per acre is pretty good–at last year’s average yield per acre of 2600 lbs and the current farm gate price for nut meats of about $2 per lb, the average grower enjoys a net return of $1200/acre (over total operating costs), or $2700/acre (over cash operating costs, excluding land and trees) (Klonsky 2011). When you take into consideration that the grower would lose money on every acre without bees, it’s easy to see why they are (begrudgingly) willing to pay $150 or more for colony rent (of course growers begrudged paying me $12/hive when I first began pollinating, and have begrudged every price increase since).
So what does the crystal ball say about future demand for colonies in almonds?
Projected Acreage
A recent presentation to growers on the economics of almond production (Harp 2011) projected that the world demand for almonds will require about 30–40,000 additional bearing acres in California per year, which in turn will require an additional 60–80,000 8-frame colonies. This projected additional demand should help to support pollination prices.
Sure there’s some concern about the new “self-fertile” cultivars decreasing the demand for bees, but those varieties still require at least a colony per acre to be cost effective (Northcutt 2011), so no one is expecting them to make much of an impact for the foreseeable future.
Stocking Rate
The thing that I can’t understand is why some growers shoot themselves in the foot by shorting themselves on bees. I picked up a new contract this season—a beautiful, by-the-book 15-yr orchard that yielded less than 2000 lbs/acre. But the grower had only been contracting for one 7-frame colony per acre, figuring that his neighbor rented enough bees to cover one end of his orchard (adjacent growers consider this sort of getting a free ride akin to thievery).
When I began pollinating almonds, growers rented two hives of bees per acre and were happy to obtain 1000 lbs of harvested nutmeats per acre. Today, state-of-the-art orchards harvest 4000 or more pounds from the same acre! Four times as much yield means that four times as many nuts are set per acre, meaning that at least four times as many blossoms must be pollinated per acre. Yet the average hive stocking rate is still set at only two hives per acre, even though average colony strength hasn’t substantially changed (Sheesley 1970). Honey bee foraging behavior hasn’t changed, so I wonder if we are expecting today’s bee to do four times as much work as yesterday’s bee?
Recent research by Dr. Frank Eischen indicates that at peak bloom of early cultivars, there was much better nut set at 2 colonies per acre compared to 1 colony; and for late cultivars better at 1 colony/acre as compared to 0.77 (which is the range that the grower in the test was willing to allow). His findings strongly suggest that growers are seriously not renting enough bees per acre to realize the full potential nut set.
Practical application: Dr. Eischen’s findings strongly suggest that growers are not contracting for enough bees per acre in order to realize the full potential nut set, especially in the newer high-density orchards and for the densely-flowering hardshell cultivars. As growers get educated to this fact the demand for bees should increase.
At the U.C. experimental almond research station that I’ve pollinated for over 25 years (Fig. 4), the average bee stocking rate has been 18–20 frames of bees per acre of mature trees, or the equivalent of two 9–10 frame colonies. But you don’t have to guess as to whether the stocking rate for any particular orchard is adequate—it’s easy to check for yourself! In a fully-stocked orchard, the bees will have completely stripped the pollen from the blossoms by early afternoon each day (Fig. 3).
Practical application: I suggest to my growers that they confirm that they are getting optimum pollination by checking the blossoms for pollen in the afternoon at peak bloom.
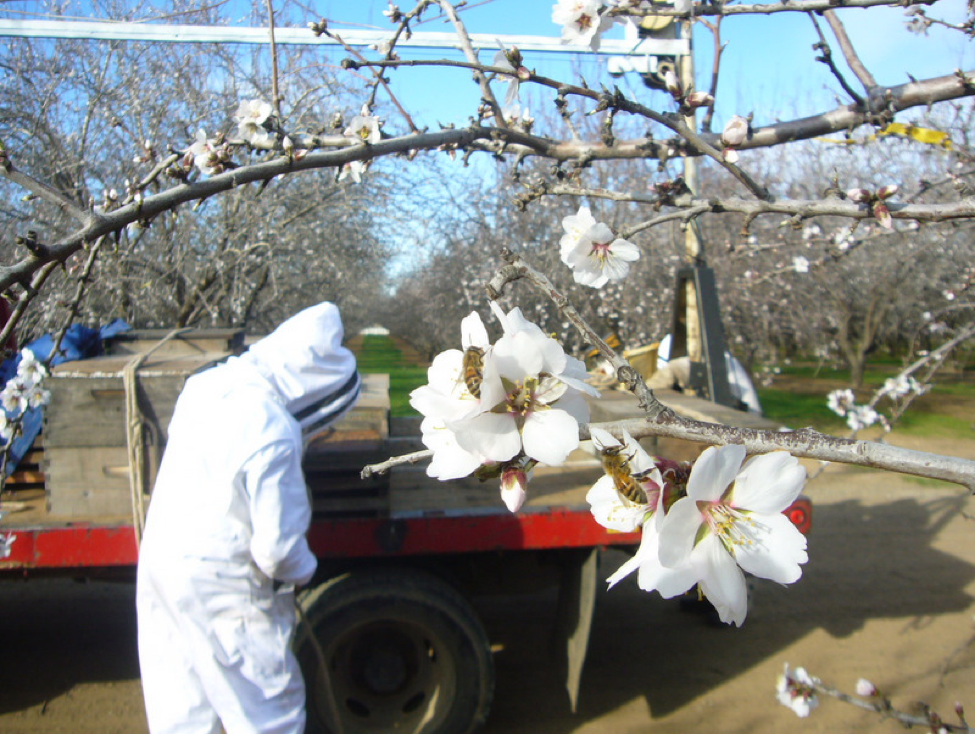
Figure 3. Early bloom on a cold morning in Arbuckle this spring. My son Ian at work in the background; our bees at work in the foreground. Note that the pollen has not yet been stripped from these blossoms. At full bloom, recent data from Dr. Eischen suggest that growers may not be renting enough colonies per acre.
Without adequate pollination, the grower may forego some portion of the potential yield of that orchard. Smart growers go ahead and contract for bees a bit on the heavy side as a form of risk management should the weather not cooperate—in an orchard heavily stocked with bees, a good crop can be set during brief breaks in the weather.
Practical application: stocking an adequate amount of strong colonies per acre is an effective form of risk management for growers should poor pollination weather occur during bloom.
Although growers balk at spending more on hive rental, they should do the math! Say that an orchard is yielding 2000 lbs at two hives per acre. It follows that with nutmeats selling at $2 a pound, an increased yield of merely 4% would easily pay for an additional hive at $140. Dr. Eischen’s data suggest that growers may be missing out on far larger percentages of yield than that! I just don’t understand why a grower who has invested some $2500 in fixed costs per acre would short himself on bees at the most critical time for nut set!
Practical application: the beekeeping industry is doing a poor job at educating growers as to optimal stocking densities. If we were to invest some money into research and grower education, both parties would benefit!
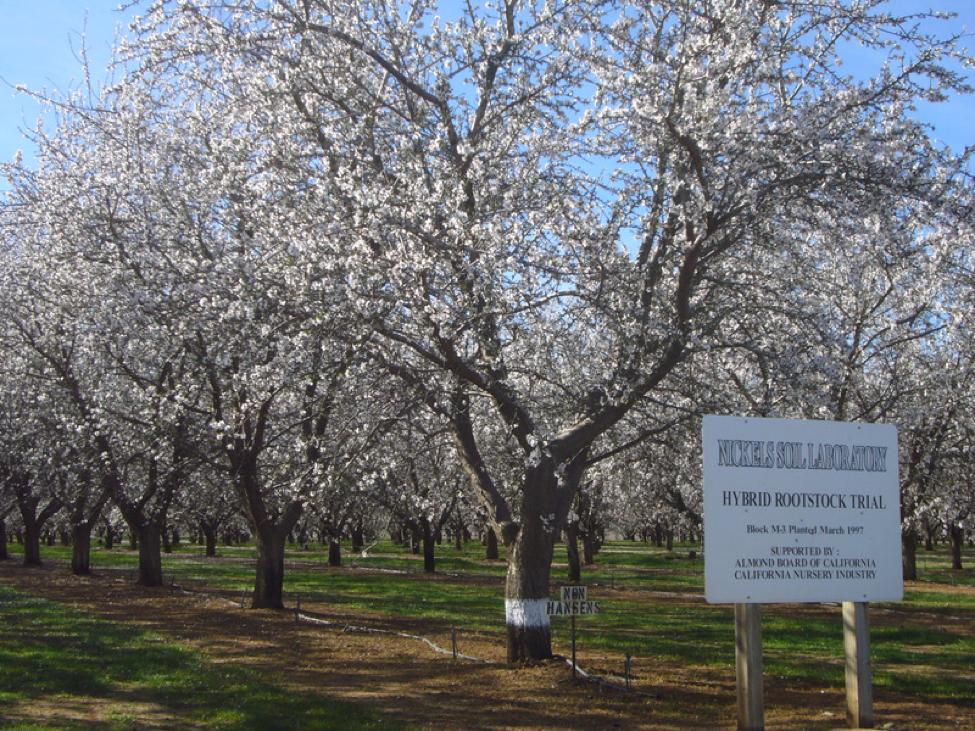
Figure 4. At the Nickels Soil Laboratory in Arbuckle, U.C. researchers experiment with every combination of rootstocks and almond cultivars, planting density, type of pruning, methods of irrigation, fertilization, etc. I’ve been pollinating this orchard long enough to see plots get planted, the trees grow to maturity, and then be ripped out and the plot replanted!
Every spring I speak with grad students at the Nickels Lab who are marking off individual blossoms, monitoring soil probes, etc. Such research has allowed growers to increase production from 1000 lbs to an average 2600 lbs per acre, with 4000+ lbs expected in the near future! The research station is self-sustaining—they make enough from the sales of harvested almonds to cover their costs and pay the staff. Would I be frivolous to suggest that some of our bee research stations follow a similar model?
Frame Strength
The question often arises, what is the most efficient colony strength for almond pollination hives? And furthermore, what is a 10-frame colony worth relative to 4-framer, as far as the actual amount of pollination work that gets done?
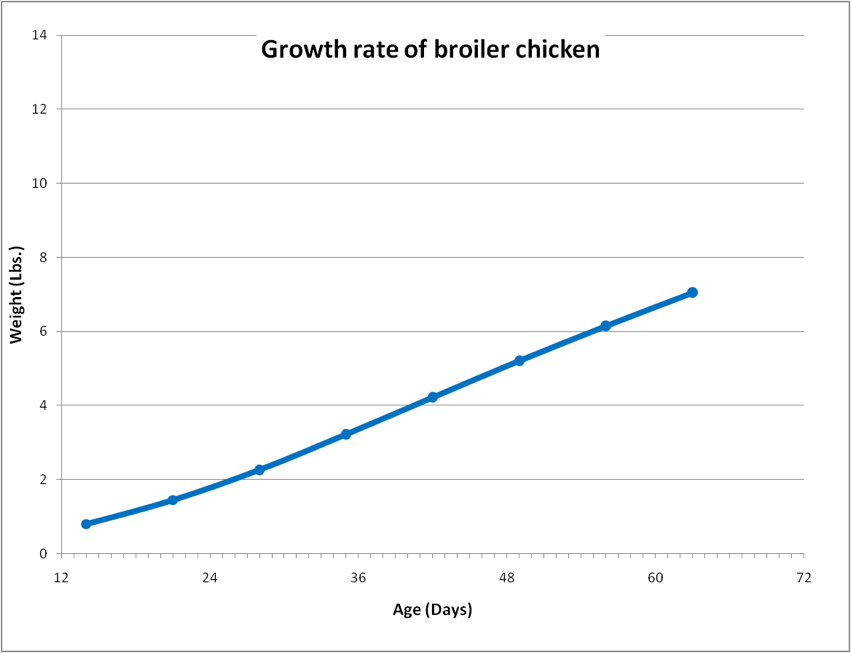
There are plenty of opinions based upon what someone thinks, but not a whole lot of firm data. In my 2007 article, I plotted out a graph derived from a bunch of unpublished UC Davis data. It suggested that the relationship between frame strength (from 4 to 16 frames of bees) and actual pollination work was directly proportional—i.e., that a 12-frame colony would do as much work as three 4-framers. Of course, nearly everyone was incredulous.
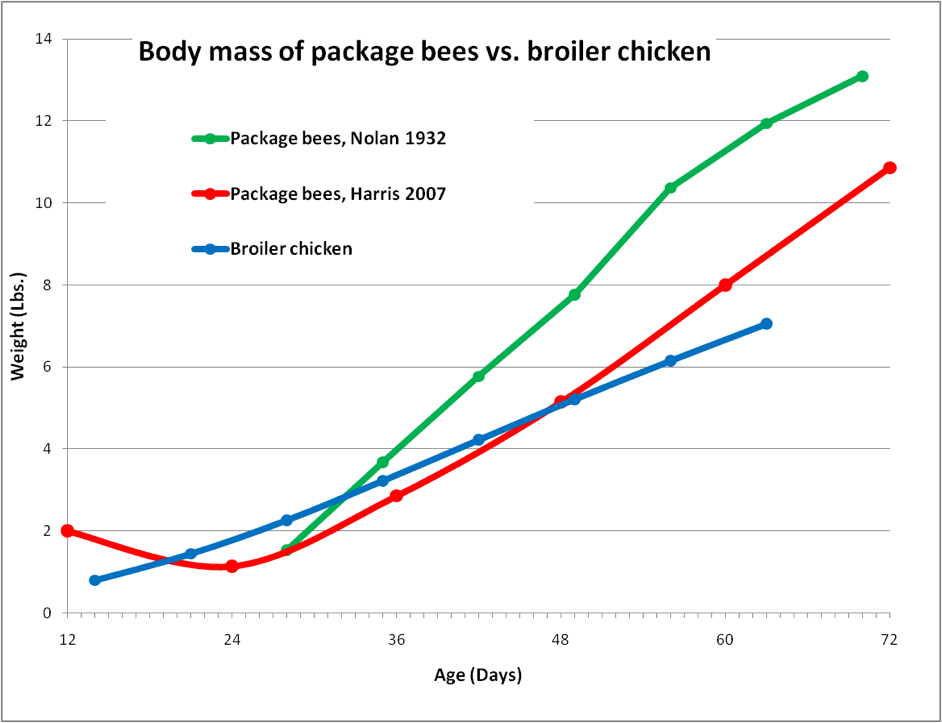
So I found the best published data sets to date—a large 1970 study of 256 colonies, and a meticulous 2007 study of 83 colonies. Both studies used the amount of pollen removed by a pollen trap as a proxy for the number of blossoms visited by the foragers of that colony. One may argue fine points, but shy of netting off acres of almonds, the amount of trapped pollen is probably a fairly reliable indicator of pollination performance.
I reworked the data —setting the amount of pollen trapped by 4-frame colonies as the baseline to which pollen collection by colonies of other strengths could be compared. In the graph below (Fig. 5), I set the amount of pollen collected by 4-framers at 100%; if a larger colony collected three times that amount, then it would be rated at 300%. Interpretation tip: If there were indeed an optimal colony size, the bars would form a curve, peaking at that strength.

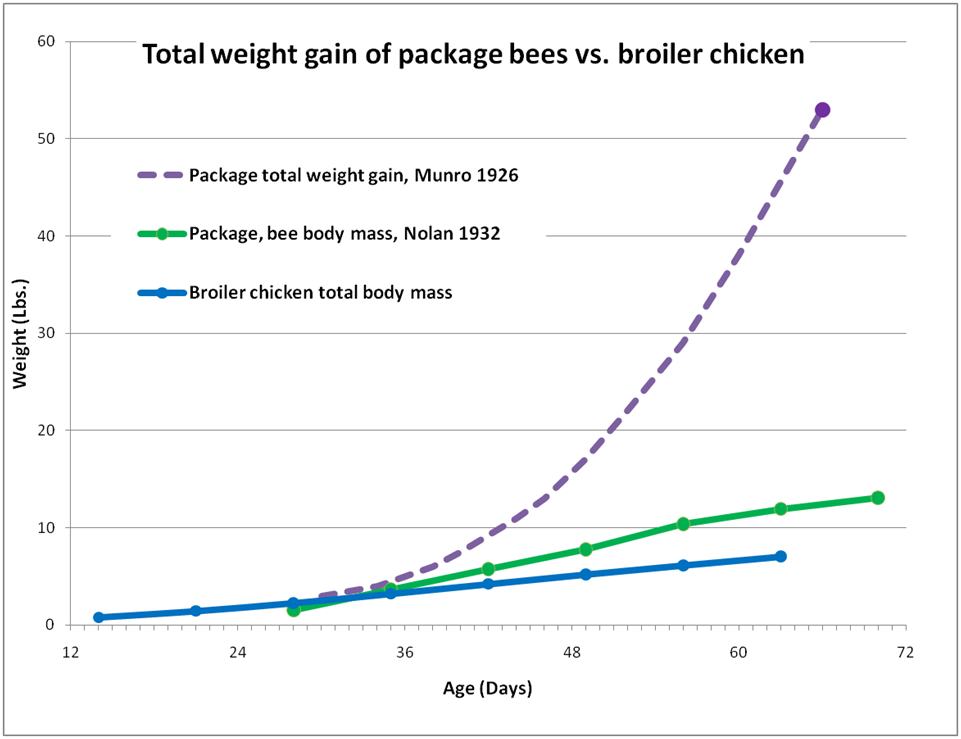
Figure 5. Pollen collection as a function of colony frame strength, relative to that of 4-framers. The green line is the hypothetical relationship that pollen collection is directly proportional to frame strength, rather than being more efficient at any particular colony size. And that is pretty much what the actual data indicates over the range from 3 –16 frames! These hard data sets indicate that a single 12-frame hive is likely worth at least as much to the grower as three 4-framers! Data reworked from Sheesley and Poduska (1970), 256 colonies, five orchards, two years combined data; and Eischen (2007), 83 colonies.
The above findings will come as a surprise to those of us (including myself) who assumed that stronger colonies would have a greater percentage of field bees, and would thus be relatively more effective pollinators per frame of bees. The data also suggest that pollination value continues to increase linearly clear up to at least 16 frame strength! By rights, then, if 4-frame colonies are renting for $100, then a 16-framer should rent for $400. That’s going to be a hard sell, no matter how robust the data!
Practical application: again, unless beekeepers educate growers with firm economic data, we may not be paid fairly for strong colonies.
OK, you say, but strong colonies, due to their larger cluster size, must certainly fly better earlier in the morning or in cool weather! Luckily, Dr. Eischen also collected data comparing the number of returning pollen-carrying foragers in morning and evening, which I also reworked. In addition, I included his calculations for the number of grams of pollen trapped per frame of bees. To interpret the graph below (Fig. 6), for each color of bars, look to see if there is a curve indicating an optimal colony size for pollination efficiency.

Figure 6. Eischen’s 2007 data, reworked. I divided both returning pollen forager rate and pollen collected per day by average colony frame strength during bloom in order to get pollination rates per frame of bees. Surprisingly again, the per-bee morning and afternoon foraging rates were highest for the 7-framers. On the other hand, the highest rate of actual pollen collection (as measured by pollen traps) was by the 10-frame colonies.
Well, more surprises again—it appears that a larger proportion of bees in the smaller colonies actually foraged for pollen! Lots of us would have lost money on that bet, but I put a great deal of faith in any of Dr. Eischen’s well designed and meticulous studies (Fig. 7)! The astute reader may have noticed that the two graphs have different bottom axes. In the first graph, pollen collection was plotted against initial field grading, rounded to the nearest frame at the beginning of bloom. In the second graph, I plotted it against the more accurate average of actual measured frame strength over the entire course of bloom. I did this since not all of the colonies in the study grew in strength during the bloom.
Bottom line: it looks like a frame of bees performs approximately the frame amount of pollination work regardless of the size of the colony, suggesting that two 4-framers would provide about as much pollination service as a single 8-framer. If anything, pollination efficiency appears to be greatest in 8- to 12-frame colonies, which comes as no surprise, as this is around the size at which a colony is typically feeding the greatest proportion of brood.
Practical application: the implications of the above data sets are that growers are either paying far too much for 4-frame colonies, or far too little for 12-framers (I personally favor the latter interpretation).
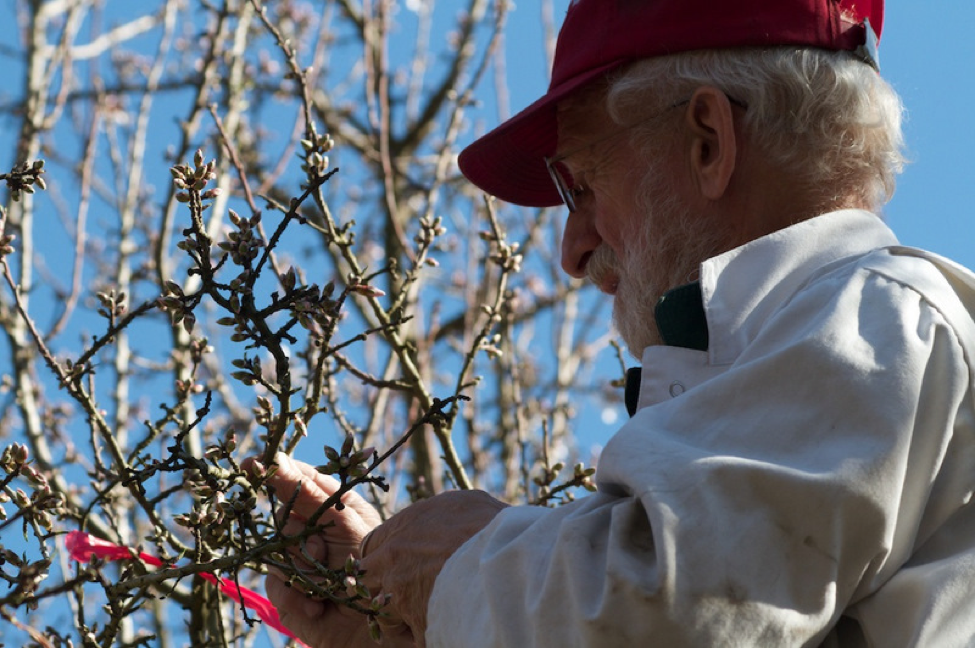
Figure 7. Dr. Frank Eischen of the USDA ARS at work in the almonds this season—preparing to net off a branch to measure bee pollination rates. The bee industry owes Dr. Eischen a debt of gratitude for his valuable practical research on mite control, Small Hive Beetle, and almond pollination. Photo courtesy Kodua Galieti, whose images can be seen at koduaphotography.com.
And even those growers who are paying bonuses for stronger colonies may not be compensating beekeepers adequately. I had the choice this year between several different contracts (Table 1):
|
Contract |
Strength Specified |
Payment |
Payment Per Frame of Bees |
|
A |
4-frame average |
$100 |
$25.00 |
|
B |
6-frame average |
$125 |
$20.83 |
|
C |
8-frame average, 6-frame min |
$145 |
$18.12 |
|
D |
5-frame min, 11-frame max |
$165 max |
$15.00 max |
|
E |
12-frame average |
$175 |
$14.58 |
Table 1. Comparison of payment per frame of bees, depending upon the contract. Note that in the current market, the beekeeper really has little incentive to produce strong colonies. Other than saving a bit on trucking, you get paid more per bee the weaker the colony!
Traditionally, it used to be worth it to me to combine my 4-framers with my 8-framers, and contract for 12-frame colonies at a premium price (thus saving on trucking). There is no longer much incentive for me to do so, since the current market rewards the beekeeper for the number of boxes, rather than for the numbers of bees in those boxes.
So some beekeepers stick to the “Domino’s Pizza model”—forget busting your butt to produce premium colonies that growers aren’t willing to pay proportionately more for. Rather, offer them the minimum quality that they’ll accept, for what appears to be a cheap price. After all, they are only screwing themselves!
Grower Education
I hope that Dr. Gordon Wardell, who has been collecting data on nut yield vs. average colony frame strength, will be able to share those important economic figures with the industry some day (hint, hint). My suggestion to the almond growers would be to shift from renting numbers of hives to numbers of frames of bees per acre.
To that end, I drew up a new contract this year for one of my more enlightened growers: I guaranteed a specific number of frames per acre (18), independent of the number of hives that I used to fill the contract. For validation, I invited my grower to inspect as many drops as he wished with me, to ensure that I met the guarantee. This contract allowed me great latitude as to how to fill each drop, and could easily have had a proportional penalty written in for failure to reach the target. Since I came up a little short on hives in February, I ran all my 12-framers to this contract, and then cleaned up by renting all my weaker hives at a high per-frame rate to other growers.
Such a contract may become a model for the future. But for now, there is unfortunately a disproportionately low return for providing extra-strong colonies, and I’m tired of all the feeding and work necessary to produce them!
Fungicides
Almonds are susceptible to a variety of fungal diseases, especially in the Central and North Valleys, which receive more rain than down south. Following wet weather, the sounds of tractor-mounted blowers, crop-duster biplanes, and helicopters are common in the orchards, spraying right over our hives (Fig. 8). Although such fungicides are touted as being harmless to bees, after a spray we may observe entombed pollen, brood issues, and adult bee dwindling.
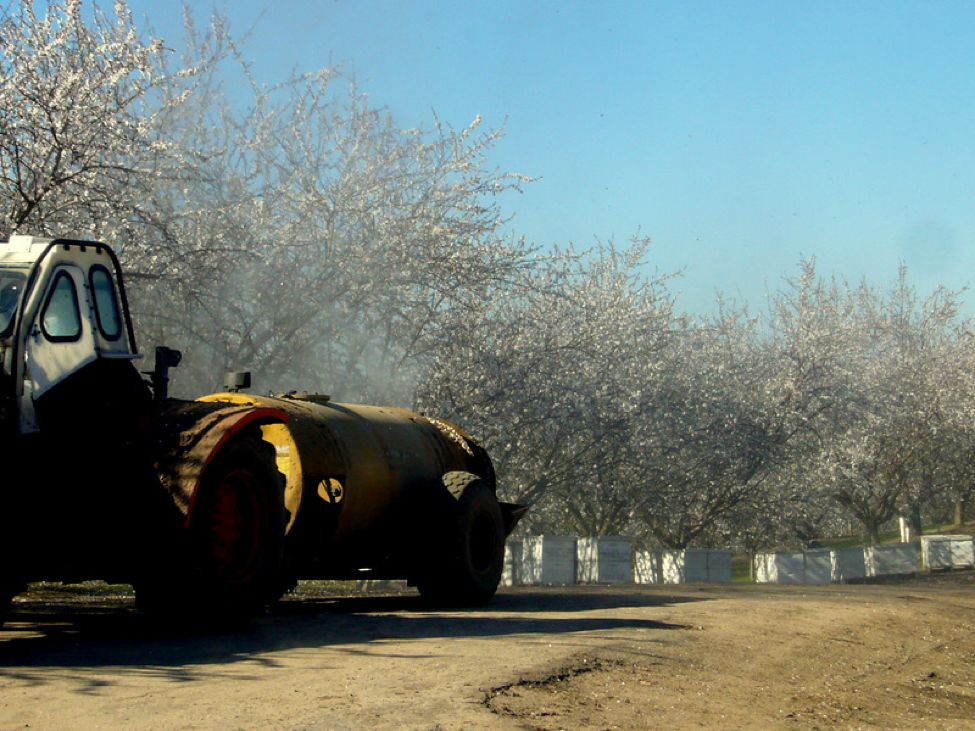
Figure 8. I snapped this photo of John Miller’s hives as they were being thoroughly fogged with fungicide in the middle of the day. Although fungicides do not normally cause significant overt adult bee mortality, the surfactant adjuvants in the tank mix sure can! Such spraying may also cause negative effects upon brood, beebread fermentation, and overall colony health. Growers can mitigate these problems somewhat by spraying after dusk.
Of special concern to the California queen breeders are the queen cell losses that some see when raising queens from colonies that had been exposed to the fungicide PristineÒ. Dr. Gloria Degrandi-Hoffman of the Tucson Bee Lab recently presented the results of their research, which found negative effects from Pristine upon queen production.
On the other hand, I’ve seen legitimate research by BASF, the manufacturer of Pristine, which indicates that the active ingredient has little effect upon bee brood. At the last California Queen Breeders meeting, representatives from BASF, to their great credit, pledged to work with us to get to the root of the reported problems. The company has stationed Dr. Christof Schneider, one of their bee specialists from Germany, in California to monitor pesticide levels in pollen and to run studies in almonds. I applaud this sort of cooperative work between beekeepers and the chemical industry!
Some researchers have suggested that the problem may be due to pesticide synergies or surfactants added to the tank mixes. I also suggested that we should consider that no researchers have investigated whether there are synergies between the toxic amygdalin in almond pollen and common pesticides.
Eco-Terrorism in the Valley
As if you didn’t already have enough things to worry about, this January right in the heart of almond country, animal rights extremists perpetrated an act of terrorism by using kerosene and digital timers to incinerate fourteen parked cattle trucks at a major feedlot [1, 2]. Such destruction is a tactic used by those who feel that “Arson, property destruction, burglary and theft are ‘acceptable crimes’ when used for the animal cause” [2a].
What has the above got to do with beekeepers? Well, if you didn’t already know, “bees are abused and exploited for their honey, wax and other derivatives” [3]. There is “cruelty in the honey industry” [4]. “Many people who understand the cruelty involved in factory farming and are morally opposed to eating meat find it less obvious that the lowly honeybee should also be of ethical concern…Like all factory farming, beekeeping has morphed into an industrial process which puts profits ahead of animal concerns” [5].
Your beekeeping operation could be the next target of some extremist!
One of the problems of the blogosphere is that folk concerned about legitimate issues can, by stretching the truth just a wee bit, incite those itching to destroy something to do so for some ostensibly “just cause.” The destruction of Harris Farms’ trucks should serve as a warning to all beekeepers that there are those out there who are under the impression that we abuse our bees–“Like other factory-farmed animals, honeybees are victims of unnatural living conditions, genetic manipulation, and stressful transportation” [6].
The press coverage of CCD has opened an opportunity for some to blame commercial beekeeping practices as the cause of death of our unfortunate charges. I am surprised by the number of blogs on the web by well-meaning folk who earnestly believe that, “There honestly is no escaping the harsh realities of methods within the commercial honey production process and the cruelty the bees themselves are forced to endure during such times” [7].
I read this after my sons and I had worked in the rain for a week to feed thousands of dollars worth of carefully-prepared and nutritious pollen supplement to my hungry hives, gently brushing the bees aside so that we didn’t squash them. Heck, in this instance, I literally treated my bees better than my own children! (Fig. 9). But you’d never know it if your only source of information was the Internet!
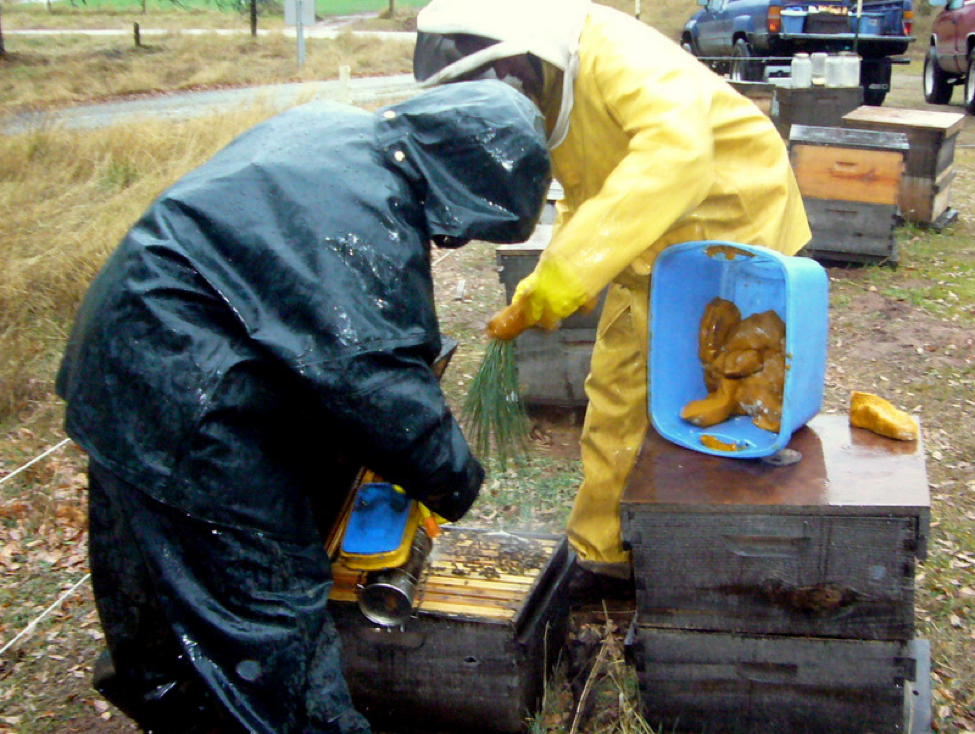
Figure 9. My sons feeding pollen supplement to hungry colonies in the rain prior to moving to almonds. We use a pine bough to “tickle” the bees so that they move down between the frames. Some of my recent research strongly suggests that you don’t want to squash bees when you’re feeding pollen supplement (more later)!
Practical application: it’s up to beekeepers to educate the public as to the truth about how much we care for our bees’ well-being, and that we only make a living if we treat them well!
The Future
The reality is this: almond growers are doing pretty well these days. The projected world demand for tree nuts is strong, and almonds are the cheapest and most versatile among them. Indeed, one of the industry concerns is that sales of nuts are so strong that packers are having trouble maintaining a comfortable “carryout”—a minimum inventory to act as a cushion should there be a short crop!
California holds a virtual monopoly on world production of almonds, so long as our water holds out (there is no snowpack in the Sierra this winter). And the world loves almonds! They are not only a tasty confection, but also good for you.
Despite some record almond crops in recent years, prices to growers remain profitable. Grower Bill Harp (2011), speaking to the Almond Board, reports that projected 10-20% grower returns on assets are possible with the expected almond supply and demand fundamentals (this is in an economy where any return on assets is a good thing). The bee industry will continue to hitch a ride on that wagon.
Bottom line: The near future looks pretty rosy for both almond growers and beekeepers.
Good Sources of Information
You can track the weather and progress of bloom at the Blue Diamond website http://www.bluediamond.com/applications/in-the-field/index.cfm?navid=101).
Project Apism http://projectapism.org has two great webpages of interest to almond pollinators:
The Cummings Report http://projectapism.org/content/view/64/49/ written by almond grower and industry insider Dan Cummings, and the
Bee Status Report http://projectapism.org/content/view/93/49/
Your $1 per hive donation to Project Apism will help to support beekeeper-funded practical research.
Hilltop Ranch posts almond updates at http://www.hilltopranch.com/2012/02/almond-update-25/
References
Carman, Hoy (2011) The estimated impact of bee colony collapse disorder on almond pollination fees. ARE Update 14(5): 9-11.
Eischen, FA, RH Graham, R Rivera & J Traynor (2007) The effect of colony size and composition on almond pollen collection. http://projectapism.org/component/option,com_docman/task,doc_download/gid,40/Itemid,44/
Flohr, D (2011) 2011 Almond Forecast http://www.hilltopranch.com/wp-content/uploads/2011/05/almond-industry-historical-data-from-nass.pdf
Harp, B, et al (2011) Economics of Almond Production. (Broken Link!) http://www.almondboard.com/Handlers/Documents/Economics%20of%20Almond%20Production.pdf
Klonsky, KA, et al (2011) Sample costs to establish an orchard and produce almonds (flood). http://coststudies.ucdavis.edu/files/AlmondFloodVN2011.pdf
Klonsky, KA, et al (2011) Sample costs to establish an orchard and produce almonds (microsprinkler). http://coststudies.ucdavis.edu/files/AlmondSprinkleVN2011.pdf
Ludwig, G (2009) Present & Future Beekeeping: “Almonds” http://www.usda.gov/oce/forum/2009_Speeches/Presentations/Ludwig.pdf
Mussen, EC (2006) Chaotic almond pollination. (Broken Link!) http://entomology.ucdavis.edu/faculty/mussen/JanFeb2006.pdf
Mussen, EC (2009) How much does it cost to keep commercial honey bee colonies going in California? http://projectapism.org/content/view/83/27/
Northcutt, G (2011) Quest continues for self-fertile almond varieties. Tree Nut Farm Press 3(5).
Rabobank 2011 https://www.rabobankamerica.com/content/documents/news/2011/us_tree_nut_sales_to_remain_strong_in_coming_years.pdf
Rucker, RR & WN Thurman (2012) Colony collapse disorder: The market response to bee disease. http://www.perc.org/files/ps50.pdf
Rucker, RR, WT Thurmon and Michael Burgett (2011) Colony collapse: The economic consequences of bee disease. http://economics.clemson.edu/files/ccd-paper-full-package-apr14-2011.pdf
Sheesley, B and B Poduska (1970) strong honeybee colonies prove value in almond pollination. California Agriculture. August 1970: 4-6.
Sumner, DA and H Boriss (2006) Bee-conomics and the Leap in Pollination Fees. http://aic.ucdavis.edu/research1/bee-conomics.pdf
USDA (2010) Federal crop insurance corporation adjustment standards product administration and standards division handbook 2012 and succeeding crop years. http://www.rma.usda.gov/handbooks/25000/2012/12_25020-1h.pdf
Waycott, R, moderator (2012) The Economics of Growing Almonds. (Broken Link!) http://www.almondboard.com/Growers/Documents/The%20Economics%20of%20Growing%20Almonds.pdf
[1] (Broken Link!) http://www.fresnobee.com/2012/01/10/2677557/animal-rights-activists-take-credit.html
[2] http://www.animalliberationpressoffice.org/communiques/2012/2012-01-10_harrisranch.htm
[2a] http://activistcash.com/biography.cfm/b/1459-alex-pacheco
[3] (Broken Link!) http://www.think-differently-about-sheep.com/Animal-Rights-Bees.htm
[5] http://prime.peta.org/2009/01/but-what-about-honey-is-it-cruelty-free
[4] http://www.veganpeace.com/animal_cruelty/honey.htm
[7] http://veglin.hubpages.com/hub/Why-Honey-REALLY-isnt-Vegan
[6] http://www.peta.org/issues/animals-used-for-food/honey-from-factory-farmed-bees.aspx