
Drones and Varroa: Part 1

December 30, 2023
Contents
Monitoring of the Mite Infestation. 3
How Best to Obtain a Representative and Consistent Sample?. 3
Drones and Varroa
Part 1
Randy Oliver
ScientificBeekeeping.com
First Published in ABJ October 2023
In the May issue of this journal, Dr. Zac Lamas asked “Why we aren’t we sampling drones” in order to monitor the mite infestation level of our colonies in the springtime? Since my sons and I perform a great number of mite washes, I found his findings and proposed hypotheses to be of great interest. So I pursued his suggestion that beekeepers compare the infestation rates of samples of hand-plucked drones to those of samples of bees shaken from the same or adjacent combs.
As a queen breeder, I’ve of course paid attention to the presence of drones (Figure 1).
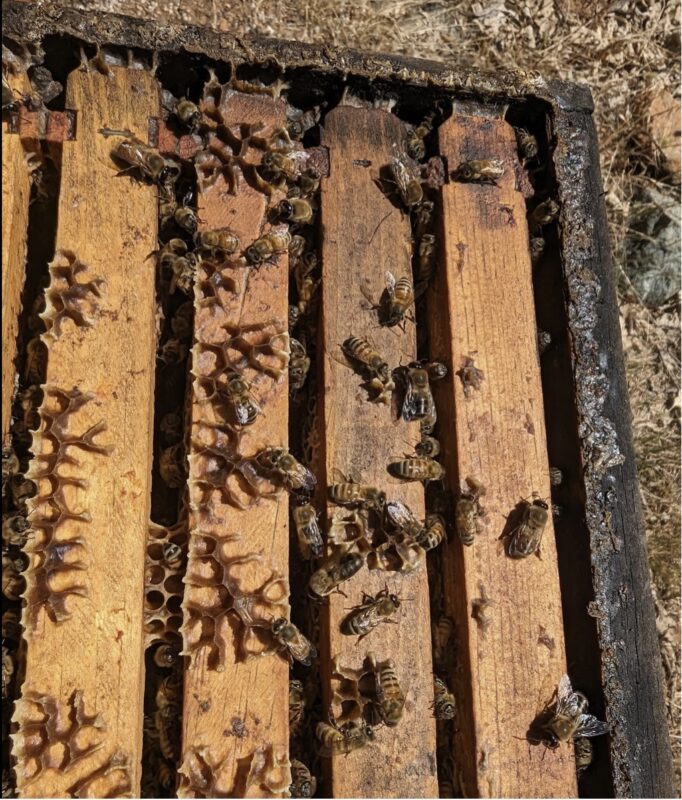
Fig. 1 Drones are abundant in our hives from the time we return from almond pollination until at least early July, but I’d never thought about the possibility of using them for varroa monitoring.
So of course I was very curious about Dr. Lamas’ research, but his thesis is embargoed ‘til 2024. Fortunately, he presented some of his very interesting findings on YouTube [[1]]. His data indicates that the infestation rate of adult drones is much greater than that of similarly-aged adult workers for the first several days of their lives, after which the difference appears to largely disappear.
The Proposed Hypotheses
Dr. Lamas proposed two intriguing plausible hypotheses:
- That for the purposes of varroa monitoring early in the season, samples of drones may better reflect a colony’s infestation rate than samples of (mostly) worker bees shaken from the combs.
- That the summertime shift of mites from adult drones to adult workers would appreciably increase the varroa infestation rate of the worker population.
Since I’ve spent a great deal of time evaluating various methods for monitoring varroa [[2]] and perform thousands of mite washes each season, I found Dr. Lamas’ findings and proposed hypotheses to be of great interest. So I followed his suggestion for beekeepers to use his protocol to compare the infestation rates of samples of hand-plucked drones to those of samples of workers shaken from the same or adjacent combs. After that, I explored the hypothesis that the midsummer reduction in the amount of drones in a colony would result in an appreciable increase in the infestation rate of the adult workers.
Monitoring of the Mite Infestation
In Integrated Pest Management, one monitors the infestation rate of the pest in order to determine whether and when to take action against the pest, weighing the damage caused by the pest vs. the cost of control. There’s a good discussion on pest treatment thresholds at [[3]]. In short, there are two commonly confused terms. In the case of varroa management:
The Economic Injury Level: The infestation rate of mites that will cause yield losses (in pollination value or honey production) equal to the varroa management costs (the level at which it becomes cost effective to apply treatment).
The Economic Threshold (treatment action threshold): The varroa infestation rate (pest density) at which management action should be taken to proactively prevent the increasing mite population from reaching the economic injury level.
The key concept is to be proactive, since we can predict the rate that a varroa infestation will increase in a non-resistant colony (Figure 2).
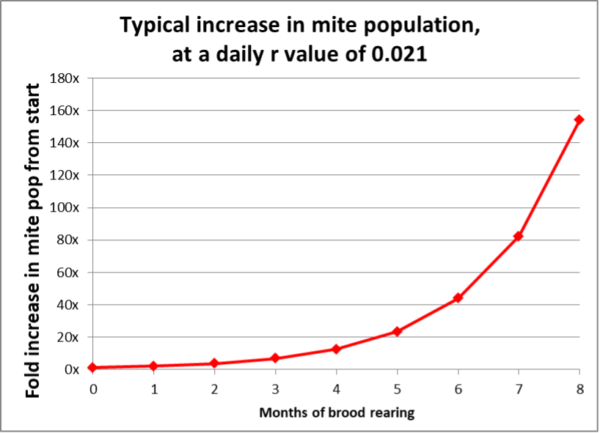
Fig. 2 The expected increase in a colony’s varroa population over time. I used the commonly observed intrinsic rate of population increase (r value) of 0.021 [[4]]. The thing to keep in mind is that with exponential increase, early intervention is critical.
Practical application: The most economically-successful beekeepers that I know attempt to maintain varroa levels well below the economic injury level at all times of the year — they don’t wait until they see high mite counts!
How best to obtain a representative and consistent sample?
The thing to keep in mind is that there’s only one way to precisely determine the mite population in a hive — that is to kill all the bees and brood, and then count every single mite (something that a number of researchers spent tedious hours doing in the early years of varroa research [[5]]). On the other hand, for monitoring purposes we attempt to take a representative sample of adult bees or pupae, and then extrapolate the average infestation rate of the bees in the hive.
Of equal importance, samples must be reliable and consistent — two or more samples taken from the same hive should come up with close to the same number.
Due to the inherent variation of the infestation rate from bee to bee, to extrapolate a colony’s average infestation rate from a sample, the sample must contain enough bees to overcome that variability, typically by using the Poisson distribution of probabilities to come up with the minimal required sample size [[6]]. For a mite wash, Dr. Katie Lee determined that a sample of 300 bees was adequate [[7]].
I’ve spent a great deal of time evaluating various methods for monitoring varroa and determining what would be the best representative sample [[8]], and have found that shaking bees from a frame adjacent to brood and allowing the older bees to fly off, would provide a sample representative of the colony as a whole. But I collected that data late in the season when there were few drones — I need to replicate the study in the springtime.
So even though a shook bee sample is representative of the mite infestation rate of the adult bees in the colony, it must be evaluated relative to the adult bee-to-brood ratio at the time it was collected. Take a look at Figure 3.
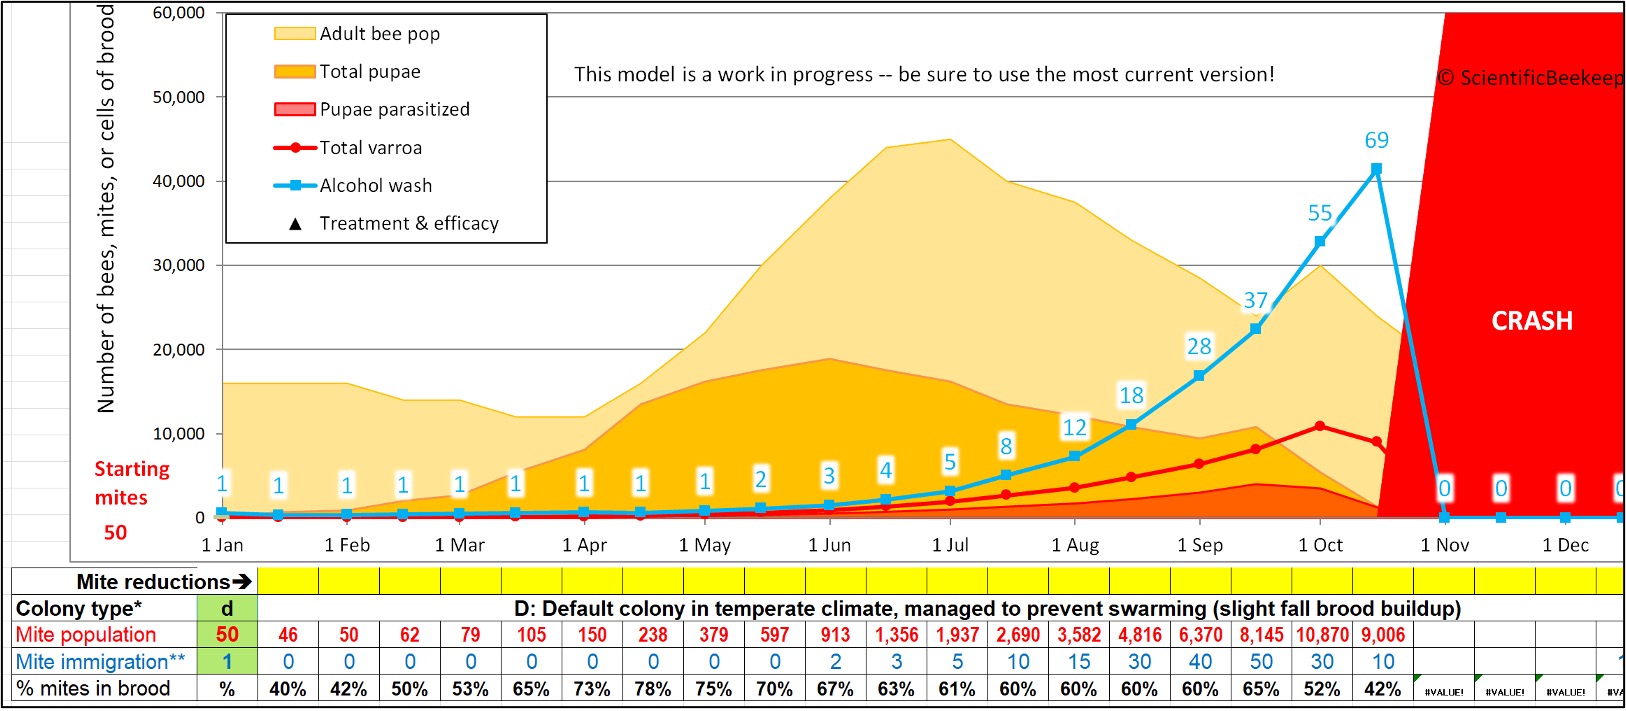
Fig. 3 My varroa model [[9]] calculates the estimated mite wash count based upon the inputted varroa population in the hive. And based upon the inputted amount of adult bees and brood (the vertical ratio of light orange to dark orange), it estimates the percentage of mites that are hidden in the brood (bottom row), as well as the expected mite wash count (blue figures). Note that during swarming season (when there are nearly as many pupae as there are adult bees), 4 out of 5 mites can be in the brood — and thus not on the adult bees (whether workers or drones). This means that one must interpret the mite wash count appropriately.
The thing to keep in mind is that any sampling of adult bees early in the season will underestimate the infestation rate of the colony as a whole. Note in the figure above how the infestation rate of the adult workers is low clear through the beginning of June (3 mites per half cup of bees), then appears to explode by the end of August (increasing over 9-fold to a count of 28).
Practical application: As illustrated in Figure 3, a mite wash count over 1 in April indicates that action should be taken before the honey flow, otherwise the colony’s infestation rate will have already allowed for DWV to go rampant by the time you pull your honey in mid-August.
Testing Hypothesis #1
Dr. Lamas questioned the efficacy of sampling worker bees to monitor the varroa infestation level of a colony early in the season. His proposed hypothesis is that taking a sample of 40 drones from a brood frame might provide a more representative assessment of the mite infestation rate of a colony as a whole than would using the standard method of taking a half cup sample of workers. So I roughly followed Dr. Lamas’ suggested protocol to compare the infestation rates of samples of hand-plucked drones to paired samples of workers taken from the same or adjacent combs. Helped by Jennifer Radke, Rose Pasetes, and Corrine Jones in late April and mid June, we dove into some high-mite colonies that I had moved home for experimentation, and took matching samples of drones and workers to compare their infestation rates (we used high-mite colonies so that we’d get enough mites in each sample to get good data to work with).
Field Observations
Most beekeepers notice that drones are more prevalent in frames to the sides of the broodnest, but when I actually started looking for drones to pluck off, it surprised me to see just how much they clumped together (Figure 4).
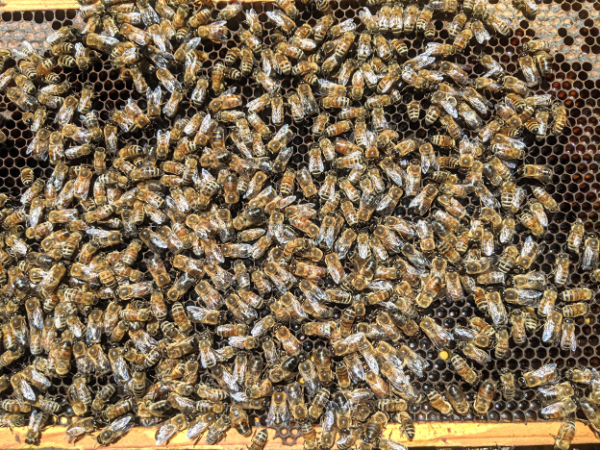
Fig. 4 A typical comb full of drones outside of the broodnest. It soon became apparent that it was often difficult to find the 40 drones on a brood frame as suggested by the protocol (since drones avoid this area), and that any sample of shook bees from an outer frame might contain a large percentage of drones.
I soon noticed that it was unusual to find a drone without at least one more drone nearby, so if I plucked one, I’d move the forceps right back to that area, and usually find at least a couple more. I found most of the drones on one or more of the outer frames, sometimes only on one side of the hive, as well as on the bottom board to the back of the hive (Figure 5).
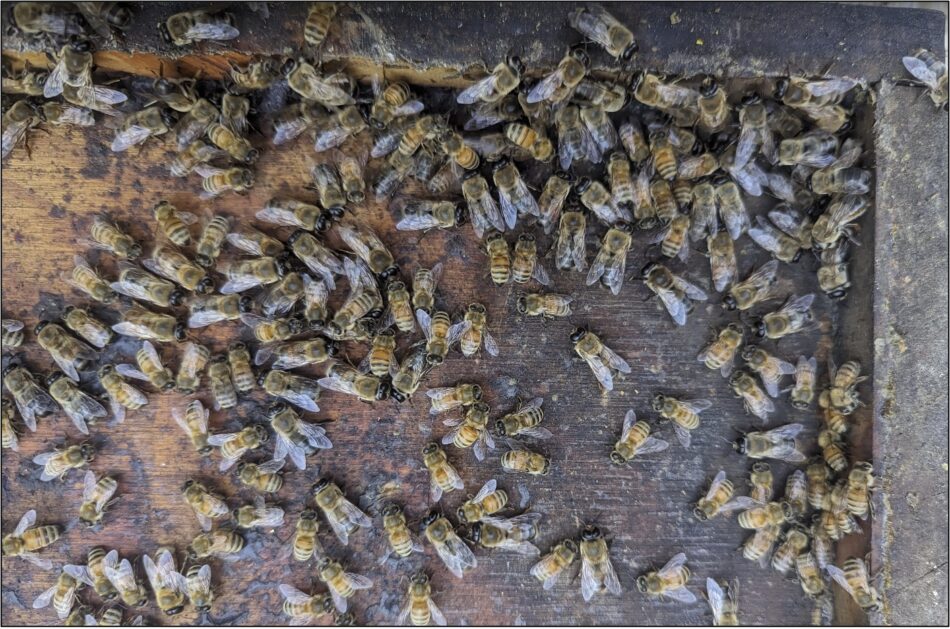
Fig. 5 During the hot weather when we took the samples, drones were often clumped at the back of the bottom board.
A question: After observing how drones tend to clump together, it occurred to me that this appeared to be independent of temperature (I’m not discounting that they prefer cooler temperatures away from the brood nest). Since this clumping takes place in darkness, it is reasonable to assume that drones are attracted to the odor of other drones. Could this explain the common observation that some colonies (especially those without a laying queen) appear to be magnets for drifting drones?
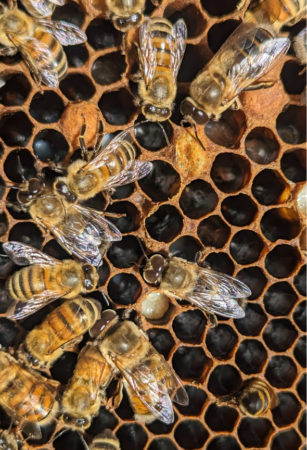
I also noticed that there was often a large difference in the sizes of the drones in the same hive. I often notice this in colonies that have gone laying worker and produce stunted drones in extended worker cells, but this was in “normal” hives (Figure 6).
Fig. 6 Note the differences in sizes between the four drones on this comb. This amount of variation was normal.
It immediately became apparent to me that few beekeepers would have the patience to pluck 40 drones from a brood frame — firstly because there are often very few drones on a brood frame, and secondly because I found that it would take an inordinate amount of time to find, pluck, and successfully place in alcohol 40 drones.
Practical application: I quickly dismissed the practicality of collecting 40 drones for a sample, so arbitrarily took samples of 25 (which most beekeepers would still likely find to be too tedious). Even at a count of only 25, it was often difficult for me to collect more than a few drone samples from the twenty frames in each of the seven double-deep colonies from which we collected the paired samples. And if a drone managed to fly off when dropped into the collection cup, we sometimes had to recount — which would have been a real pain for a sample of 40!
I took as many paired samples of drones (Figure 7) and shook bees from the same or adjacent frames as we could spot drones on, taking the paired samples from combs throughout the hive (drones first, then shaking or brushing bees into a tub). The shook bee samples often contained a few drones (which would be typical for the half-cup of shook bee methodology), but we did not remove them.
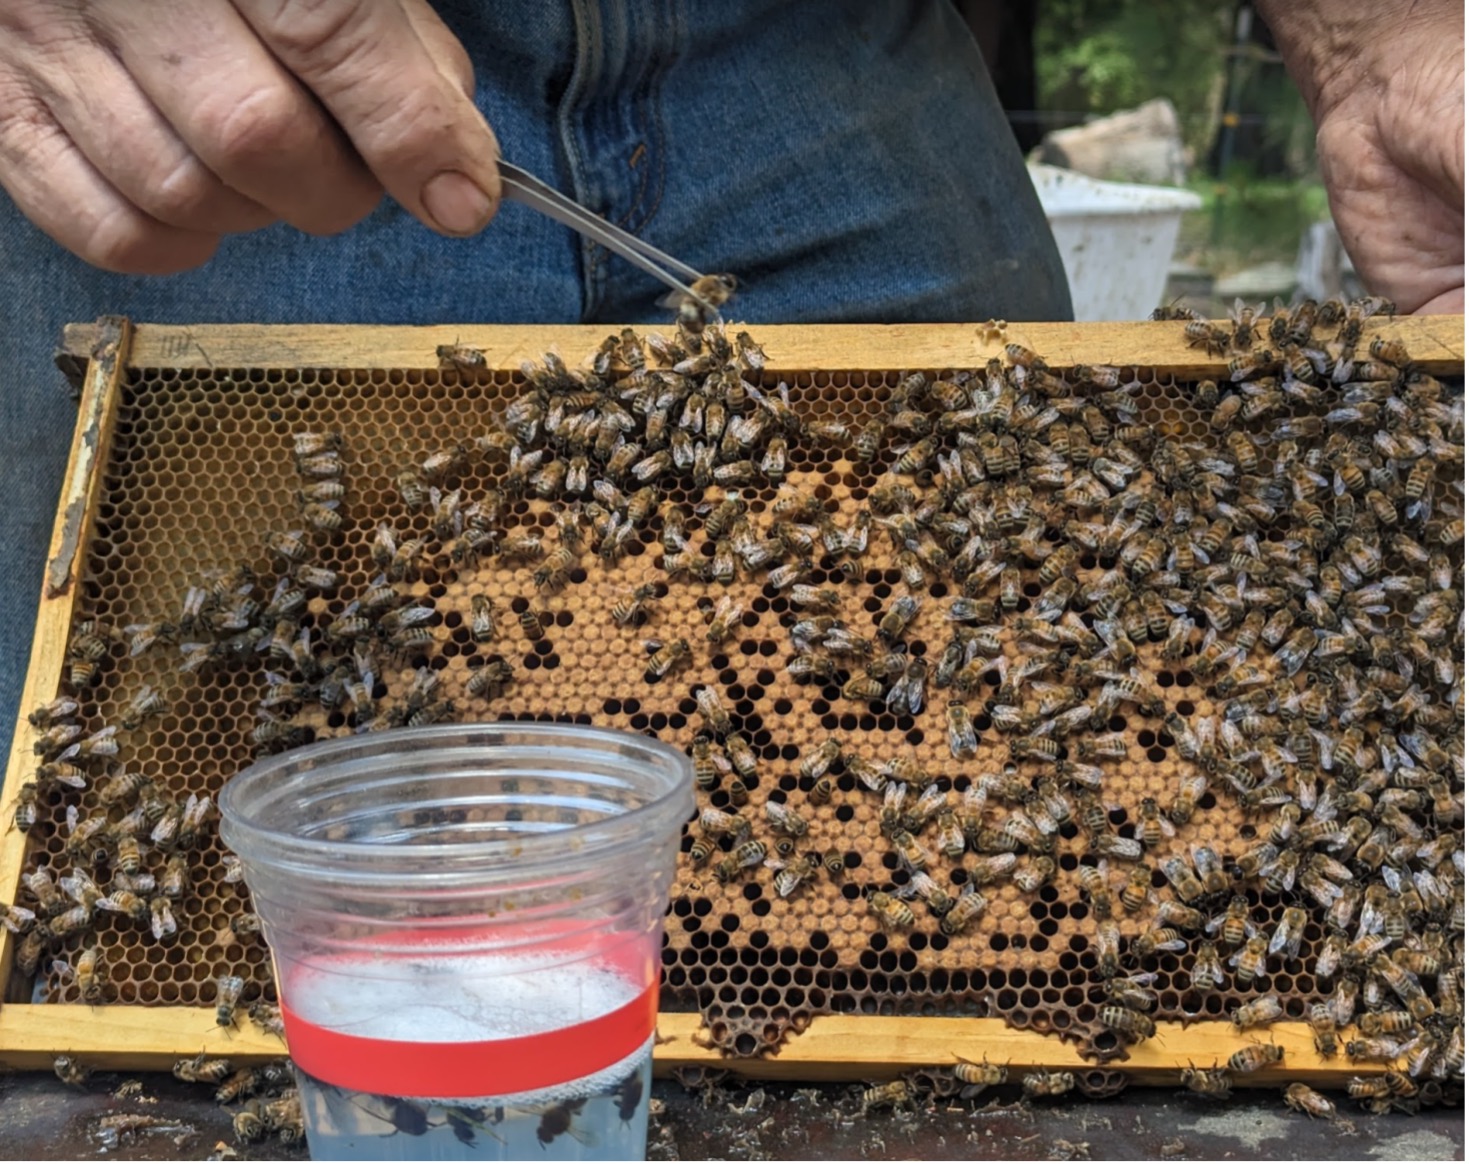
Fig. 7 I plucked the drones off the combs with insect forceps and threw them into a Dawn detergent solution for washing (we double washed to confirm full mite recovery). I then shook or brushed bees (predominantly workers) from the same or facing comb into a tub, and then scooped up a level half cup of bees (roughly 315 workers) for the matching paired sample.
Since drones were relatively rare on brood combs, we checked all the frames in each hive for the presence of drones, in order to obtain as many paired samples from each hive as possible.
Results
Let’s take a look at the results of first hive from which we took paired samples (Figure 8):
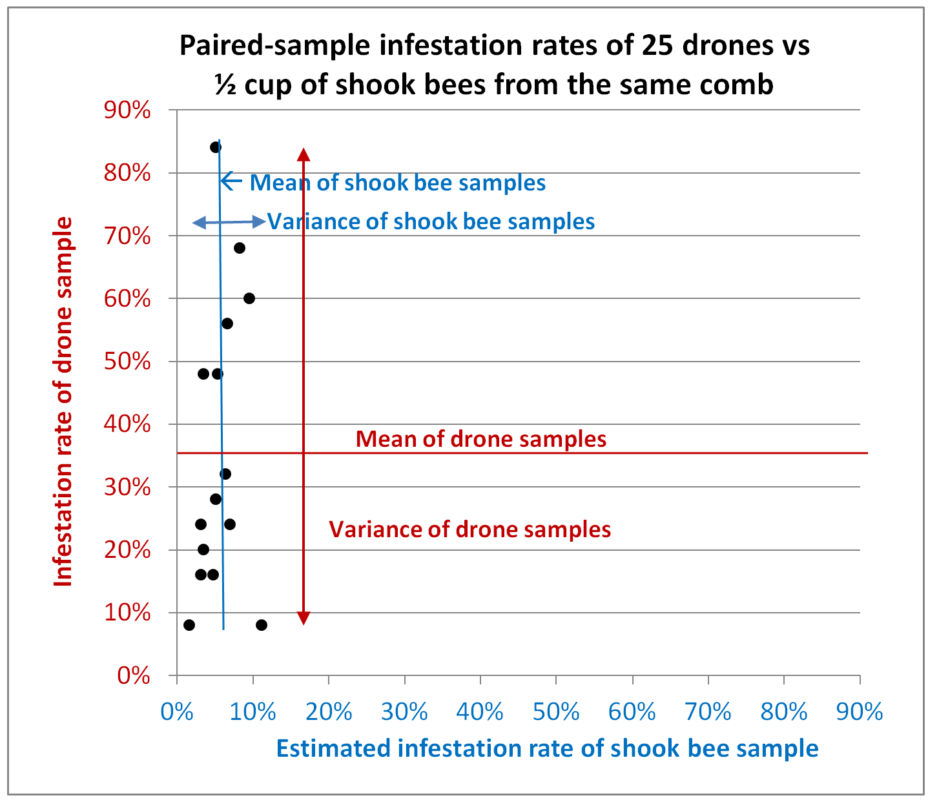
Fig. 8 Results from Hive A. All paired samples were taken from the same combs (or brushed from the interspace between adjacent combs). Each data point represents the infestation rates of two paired samples taken from a single colony, with the infestation rate of the shook bees on the blue x-axis, and that of the drones on the red y-axis. The average values for the two types of samples are indicated, and in this chart I’ve also indicated the variance for each type.
Interpretation: In this colony there was indeed a correlation between the infestation rates of the two types of samples (that of the drones being over 6x higher), but with a very low correlation coefficient (not shown) due to the far greater deviations from the average of the drone samples relative to those of the worker samples (compare the red variance arrow for the drone samples to the blue arrow for the shook bees).
We would expect variation in the worker infestation rates, since they are typically higher in samples taken from combs containing brood, but we’ll need to wait until Dr. Lamas publishes his results to see whether the same holds true for drones. The larger degree of variation in the drone samples is likely partially due to the smaller number of bees involved, but it is unrealistic to think that any beekeeper would hand pluck 315 drones for mite monitoring.
We continued sampling six more hives, some loaded with drones, some containing only a few (the differences in the amounts of drones in similar colonies sitting side by side surprised us). I collected as many paired samples as possible from each hive, sometimes with all of our eyes searching for enough drones to make up a sample of 25 (Figures 9-14).
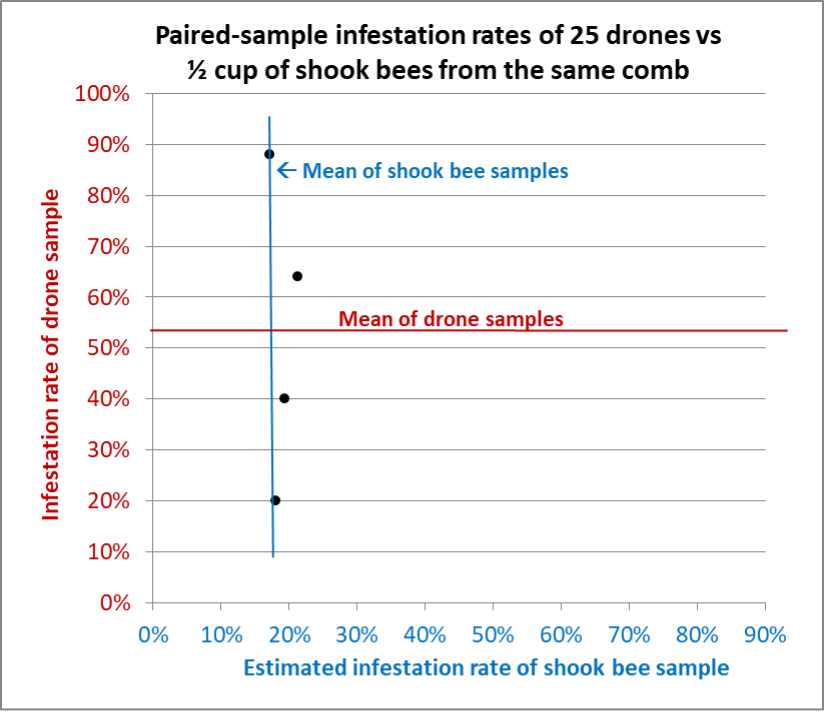
Fig. 9 Results from Hive B. Although we could only spot enough drones for four samples, similar to Hive A there was far greater variation in the drone samples than for the shook bee samples. Any one of the shook bee samples would have been representative of the whole-hive varroa infestation rate — something that could not be said for the drone samples.
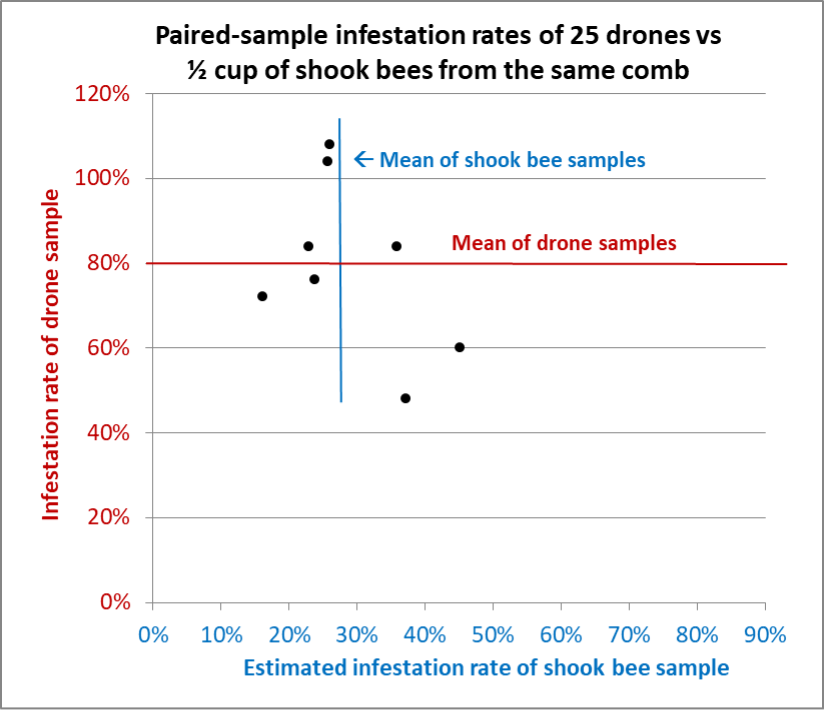
Fig. 10 Results from Hive C. This poor colony had an extremely high mite infestation rate, and a greater degree of variation in the shook bee samples than in other hives. Nevertheless, the standard deviation for the drone samples was over twice that of the shook bee samples. For those paying attention, the infestation rates of the drones that exceeded 100% mean that there were more mites than drones.
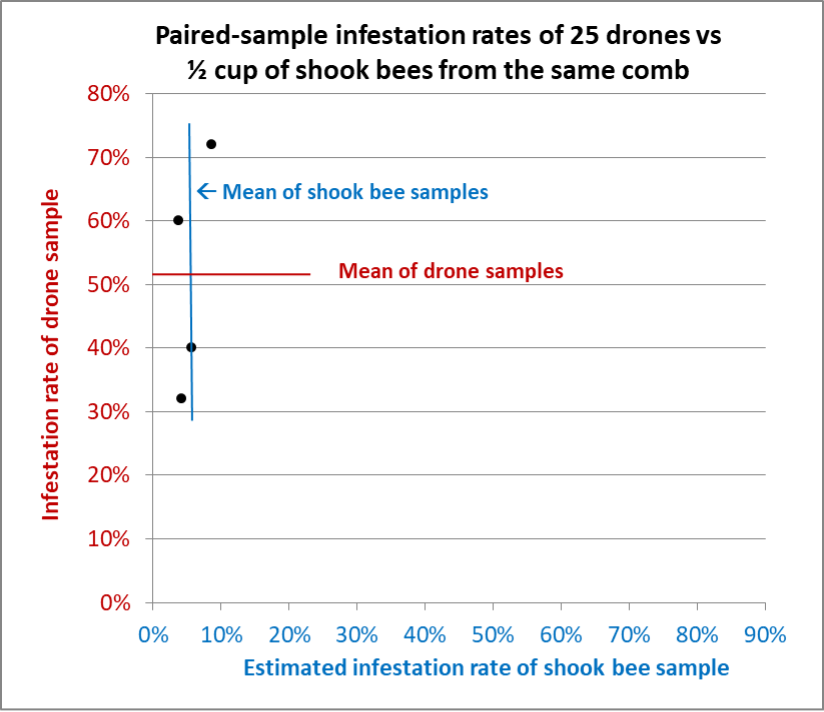
Fig. 11 Results from Hive D. Similar to the other hives, a single sample of 25 drones would not have been a reliable indicator of the colony’s overall infestation rate. On the other hand, the shook bee samples were remarkably consistent.
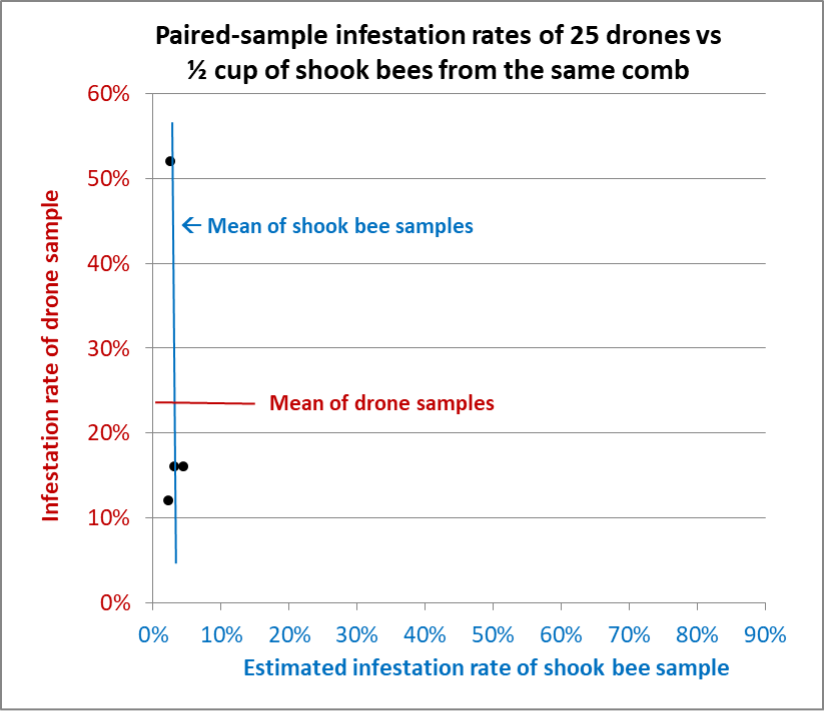
Fig. 12 Results from Hive E. Again, the shook bee samples all fell in the same range, compared to the drone samples, which varied widely.
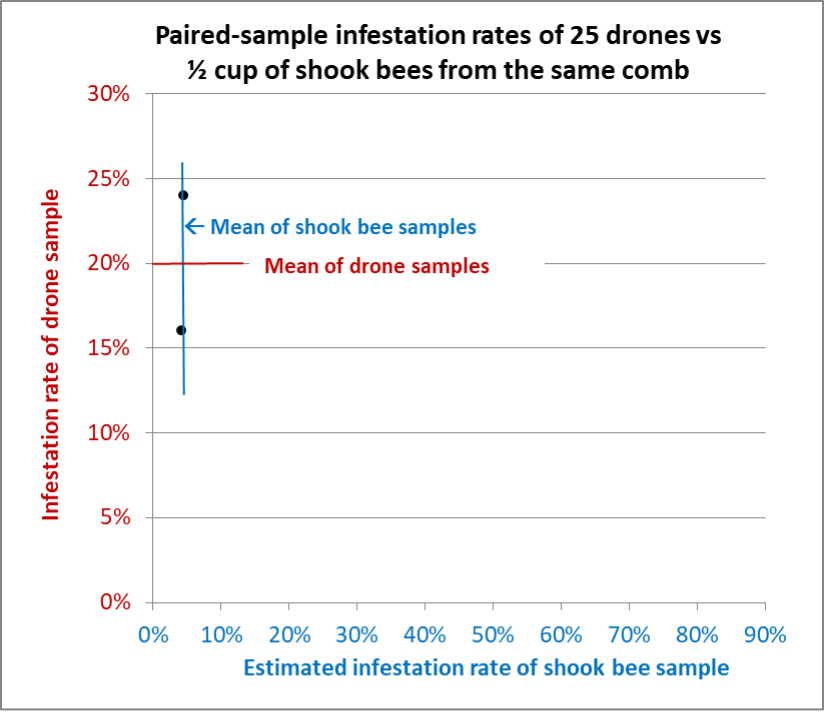
Fig. 13 Results from Hive F. We could only find enough drones for two paired samples. The infestation rates of the shook bee samples were nearly identical, compared to drone samples that differed by 20% to either side of the average.
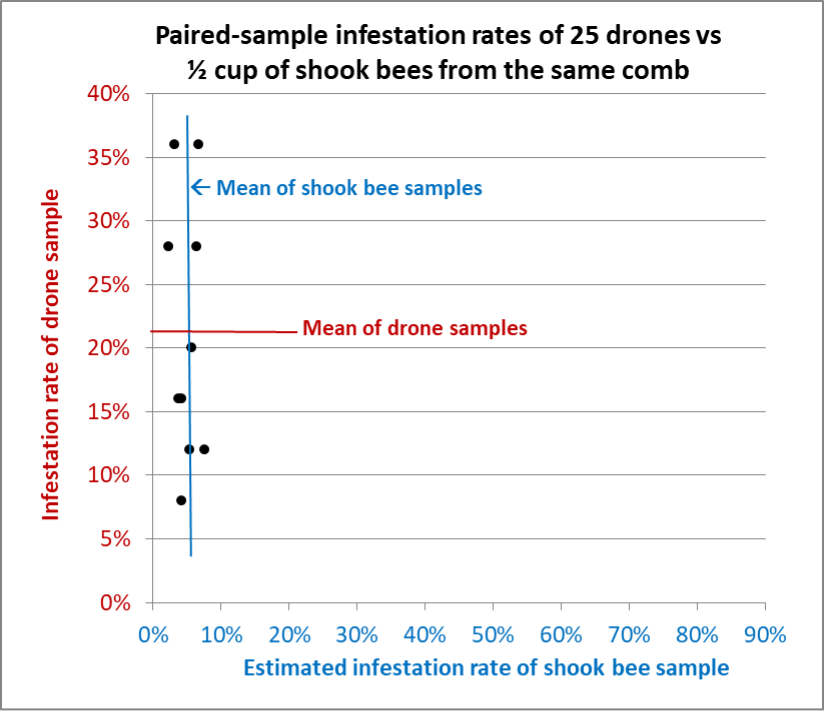
Fig. 14 Results from Hive G, from which we were able to take 10 paired samples (two exactly overlapped). Again, the shook bee samples varied only slightly, whereas the drone samples were all over the place.
The Take Home
Dr. Lamas’ findings about the distribution of mites on drones of different ages are of great interest, and may help us to better understand varroa and virus dynamics in the hive. But as far as using samples of drones that aren’t age marked in order to monitor a colony’s varroa infestation rate, we e found that taking a sample of even 25 drones was far more difficult and time-consuming than shaking a sample of a half cup of bees. Our findings from the seven hives from which we took paired samples in late April through mid-June indicated that a sample of 25 drones would not be a reliable indicator of the overall infestation rate of the adult bees in the hive, whereas a shook or brushed sample of a half cup of mostly worker bees generally would. In fact, inadvertently including a few young drones in such a sample might skew the mite count appreciably upward.
Practical application: For varroa monitoring purposes, we’re sticking with mite washes of a half cup of bees shaken from a comb adjacent to the broodnest.
The main thing to keep in mind is that early in the season most of the mites are in the brood, so it’s no surprise that the infestation rate of the workers will appreciably increase later in the season. So a mite wash of shook adult bees must be interpreted in that light — in our operation, we’d proactively treat if our colonies exhibited infestation rates of more than a single mite in a half cup of bees in April or May.
Next month I’ll detail how I tested Dr. Lamas’ second hypothesis, since it might help to explain the surprisingly sudden increase in infestation rates in August and September.
Citations and Notes
[1] SBGMI Presents: “Why don’t we sample drones?” https://www.youtube.com/watch?v=mAsXFPakumU
[2] Reconnaissance Mite Sampling Methods and Thresholds https://scientificbeekeeping.com/fighting-varroa-reconnaissance-mite-sampling/ (first published in March 2007 ABJ)
Re-Evaluating Varroa Monitoring:
Part 1- Methods https://scientificbeekeeping.com/re-evaluating-varroa-monitoring-part-1/ (first published in March 2020 ABJ)
Part 2- Questions on Sampling Hives for Varroa https://scientificbeekeeping.com/re-evaluating-varroa-monitoring-part-2/ (first published in April 2020 ABJ)
Part 4- What About Letting the Shook Bees Fly Off? https://scientificbeekeeping.com/re-evaluating-varroa-monitoring-part-4/ (first published in June 2020 ABJ)
[3] https://cropwatch.unl.edu/economic-injury-level-and-economic-threshold-ipm
[4] The r value is slightly higher in the spring, and lower later in the season. See column AZ65 on the Current Version tab at https://scientificbeekeeping.com/randys-varroa-model/
[5] My hat is off to John Harbo, Jeff Harris, Lilia De Guzman, José Villa, and Bob Danka for their work!
[6] https://scientificbeekeeping.com/re-evaluating-varroa-monitoring-part-2/ (first published in April 2020 ABJ)
[7] Parasite Monitoring https://scientificbeekeeping.com/sick-bees-part-11-mite-monitoring-methods/ (first published in August 2011 ABJ)
[8] Re-Evaluating Varroa Monitoring:
Part 1- Methods https://scientificbeekeeping.com/re-evaluating-varroa-monitoring-part-1/ (first published in March 2020 ABJ)
Part 2- Questions on Sampling Hives for Varroa https://scientificbeekeeping.com/re-evaluating-varroa-monitoring-part-2/ (first published in April 2020 ABJ)
Part 3- How Does Mite Distribution Vary Frame-to-Frame in a Hive? https://scientificbeekeeping.com/re-evaluating-varroa-monitoring-part-3/ (first published in May 2020 ABJ)
Part 4- What About Letting the Shook Bees Fly Off? https://scientificbeekeeping.com/re-evaluating-varroa-monitoring-part-4/ (first published in June 2020 ABJ)
[9] https://scientificbeekeeping.com/randys-varroa-model/


