


Extended-Release Oxalic Acid Progress Report #4 – 2018 California Field Trial
Extended-Release Oxalic Acid Progress Report #4
2018 California Field Trial
Randy Oliver
ScientificBeekeeping.com
Published in ABJ in November 2018
I’ve handed my beekeeping operation, still headquartered at my home, over to my sons Eric and Ian, with the provision that I have the hives at my disposal for research during my “retirement.” This season I was overly ambitious, running two field trials on oxalic acid, one on improving the formulation of pollen subs, and one on the drift of bees and mites associated with collapsing colonies. That in addition to the roughly 1400 mite washes involved in my selective breeding for varroa resistance, plus my formally testing of a bee health product for the manufacturer. I’ll be publishing the results of all but the last as I get them written up. I’ll start with an update on my progress with extended-release oxalic acid.
Disclaimer: I’m collaborating with the USDA-ARS to register this application method for oxalic acid, and have a Pesticide Research Authorization from the State of California. The method described here is not yet registered in the U.S. But since my research is funded by donations from beekeepers, I feel that I owe a progress report to those donors. I in no way encourage the unregistered application of any pesticide—please wait until this method is approved by the EPA and your State before using it in your own hives.
Questions yet to answer on extended-release oxalic
We beekeepers are in desperate need of a mid-to-late-summer varroa treatment that is effective when there is brood in the hive and there are honey supers on, and that can be used in hot weather. Ideally, it would also not contaminate the beeswax, nor require a face shield or gas mask for safe application. An extended-release formulation of oxalic acid may fit the bill.
My previous updates on this research are at my website [[1]], in short, I found one experimental formulation of oxalic acid dissolved in glycerin (OA/gly) to be highly efficacious at reducing mite levels during the summer in my California test yards. But I needed to know whether other formulations might work even better. So I ran incubator trials last winter, testing a range of ratios of OA to glycerin, as well as different degrees of saturation of the cellulose matrix (using Scott® shop towel towels), an alternative solvent/dispersal agent (propylene glycol), and the effect of humidity.
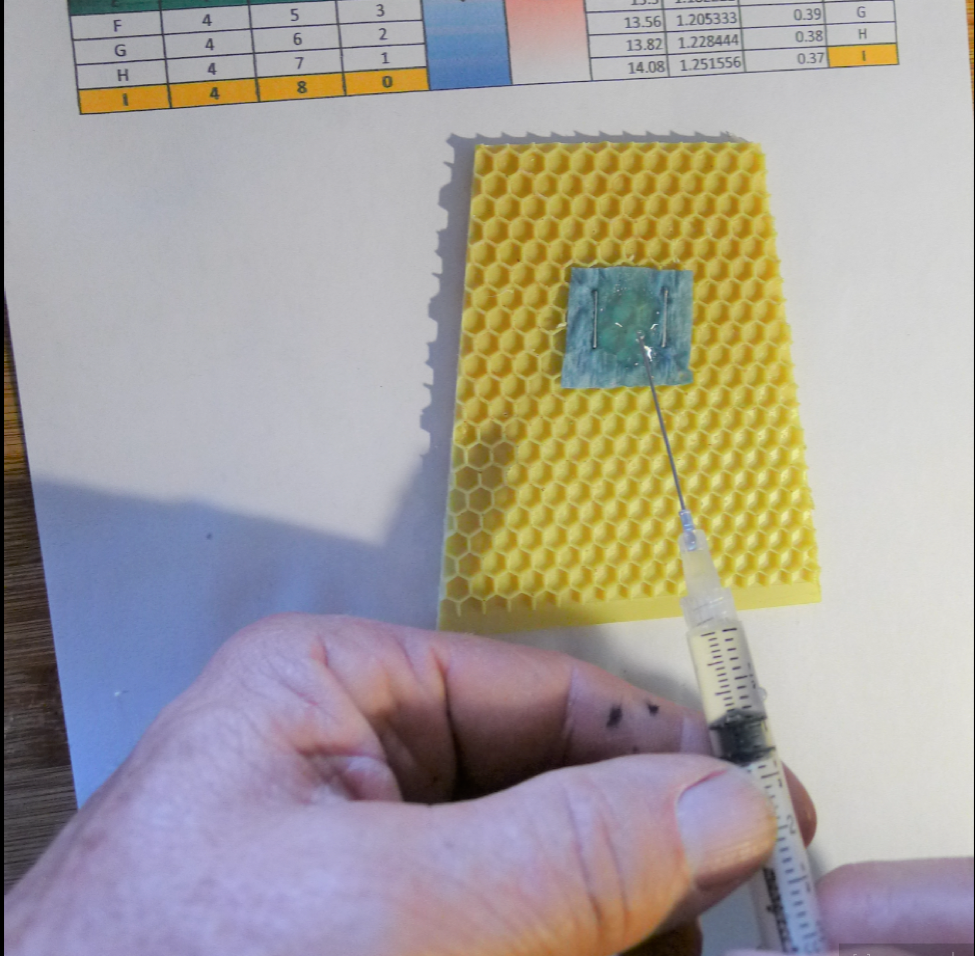
I attempted to duplicate bee and mite exposure in a colony by attaching a measured square of shop towel to a piece of beeswax-coated plastic foundation and adding a carefully-measured amount of different OA/gly formulations to the towel (Fig. 1).

Figure 1. Adding a measured amount of a test formula to a 1-inch square of shop towel.
I then added roughly 150 young adult honey bees (measured volumetrically) to each cup cage. The bees moved about on the piece of foundation, mostly clustering towards the top, and thus were exposed to the OA/gly similarly to how they would be in a hive (Fig. 2).
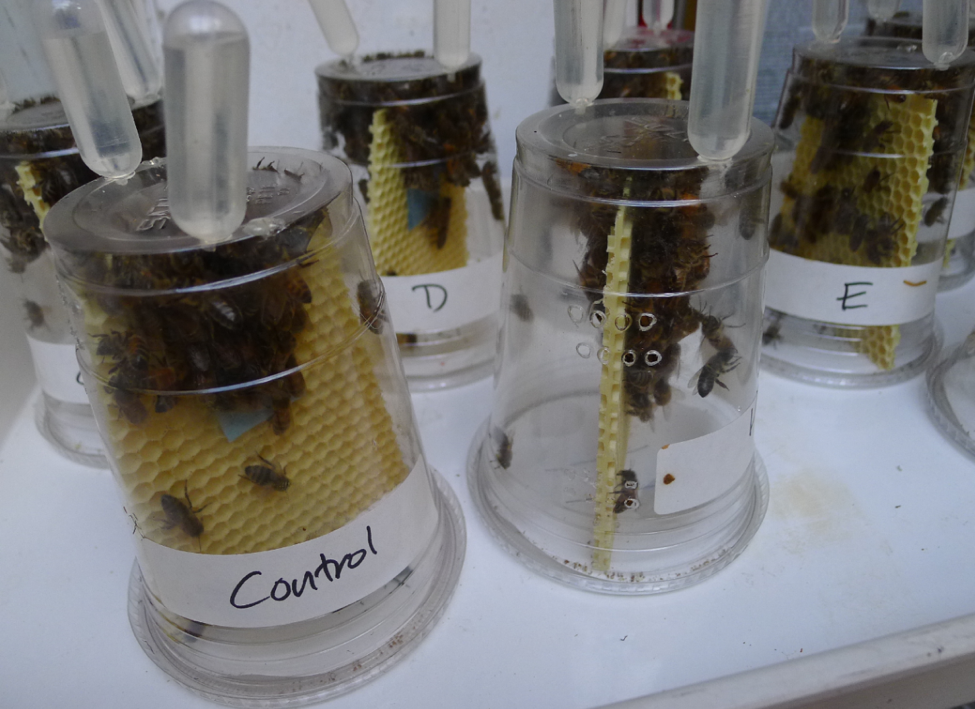
Figure 2. I maintained the caged bees in a dark incubator at 32°C and roughly 60% RH. In some tests I used bees from high-mite colonies and added a screen to the bottom, so that I could calculate mite mortality due to the treatment.
I ran eight incubator trials in all, performing nearly 200 chemical titrations to quantify the amount of OA residues on the bees’ bodies. I was frustrated that exposure to even a small piece of OA/gly towel often killed all the bees in the cage.
In brief I found that it took very little OA to kill the mites, but that it took some amount of glycerin to expose the mites to the OA. On the flip side, too much glycerin on the towel caused excessive “wetting” of the bees, and jaw-dropping overexposure to OA, causing agitation and death (but not from glycerin alone). There was also some suggestion that this adverse effect was exacerbated by higher humidity.
But I needed to end my cage trials when we put the incubator back into service for holding queen cells, and decided to run a springtime field trial in actual hives instead. I did run that trial and will write about it later (since I still need to perform hundreds of titrations of frozen bee samples). But before I could finish the springtime trial, which I hoped would narrow down the 8 formula options that I was considering, it came time to start the summer field trial. So I bit the bullet and tested them all.
So where I stood then was that I needed:
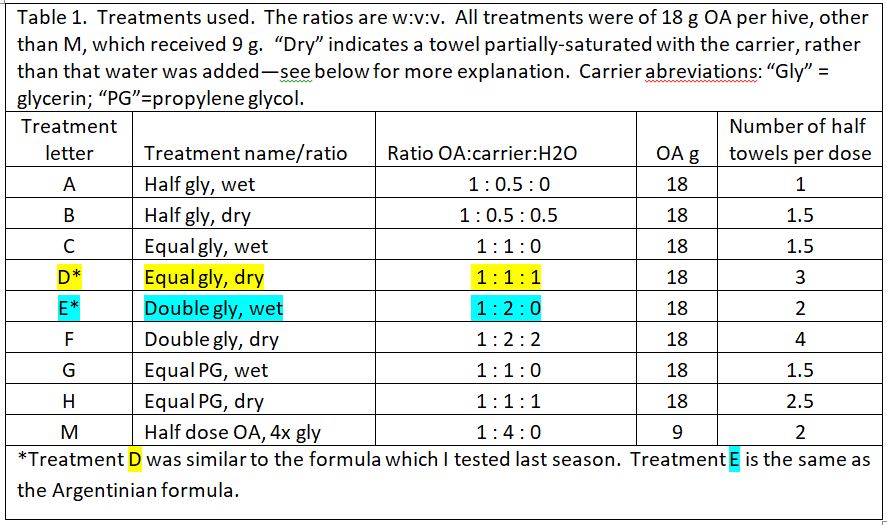
- To compare the performances of various ratios of OA to glycerin, as well as different saturations of the shop towels, in order to determine whether we should pursue last season’s formulation, the Argentinian formulation [[2]], or other ratios or saturations.
- To test using propylene glycol instead of glycerin as the solvent/carrier for the OA.
- To attempt to replicate the efficacy results from last season’s two trials, under even more field-realistic conditions, in a number of yards, on a mixture of colony strengths, with additional hives present in the yards, and with exposure to some mite drift from collapsing colonies.
- To compare the extended OA treatment to repeated OA vaporizations.
Experimental Design of the Summer Trial
The Test Colonies
We ran the summer trial in 14 different yards, containing from 24-75 colonies in 2-3–story hives, headed by second-year queens. The colonies had been last treated for varroa the previous December with an oxalic dribble and then run to almonds. In order to allow the mites to build up, in early April, we split each second-year queen off into a nuc to prevent swarming, and allowed her colony (and the mite population) to grow to decent strength by the start of the trial. In order to get enough test hives, we needed to also include one yard of colonies started this season with fresh queen cells, which had last received an oxalic dribble in April. Our selection of the test and control hives is further described later.
No hives had been treated with synthetic miticides previously, nor exposed to ag chemicals other than possible exposure to fungicides in almonds in March.
By mid-June, colony condition varied considerably, as it would in a typical apiary, with some colonies being quite strong and productive, others weaker; but we did not include any colonies that appeared to be sick, queenless, or failing. At the start of the trial, the colonies were full of brood, and our main honey flow was underway.
The Treatments
We prepared 9 different formulations to test, as below (Table 1). Based upon last season’s results, all treatments applied 18 g of oxalic acid to the hive, other than treatment M, which tested whether a low OA, high glycerin application would be efficacious.
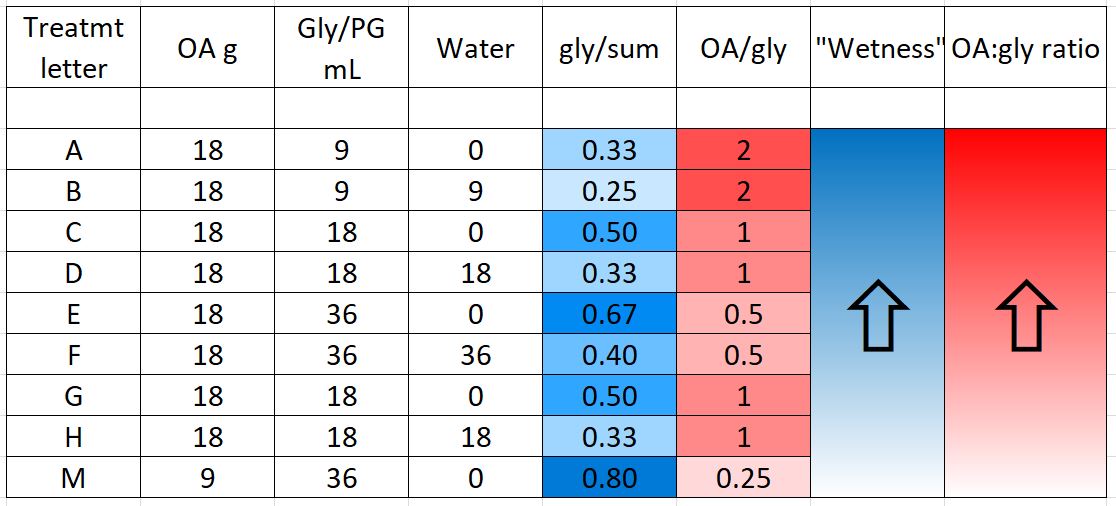
“Wetness” in the table above (indicated by blue) indicates how saturated the final towel was with glycerin, since I’ve noticed that bees tend to avoid highly saturated towels (they are also sloppy to handle). The concentration of OA to glycerin is indicated by red.
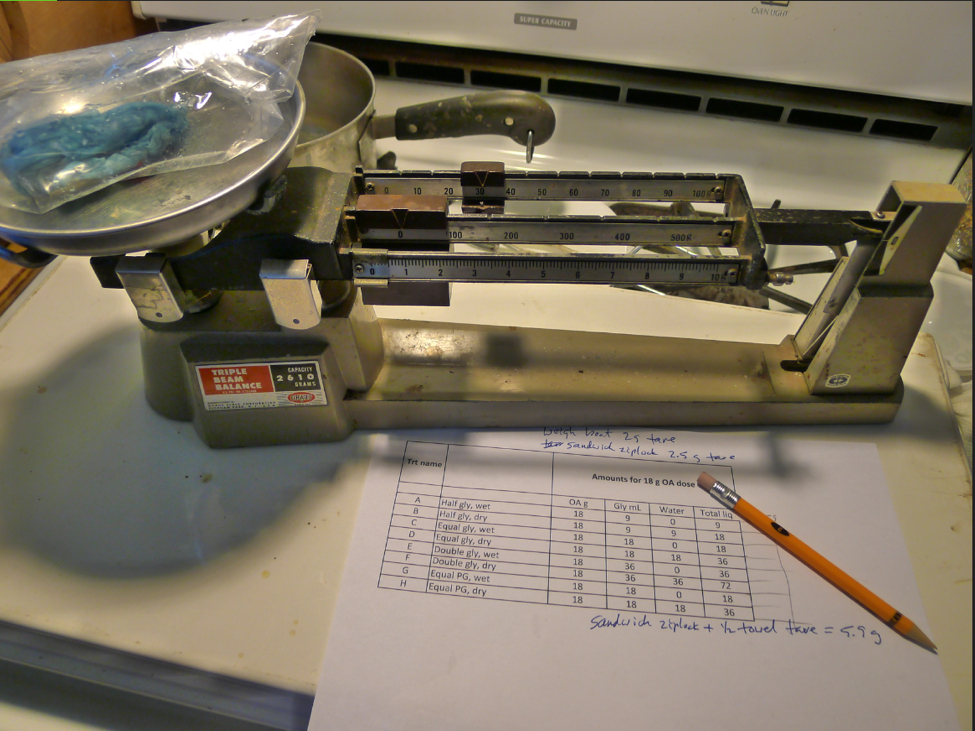
Figure 3. Prior to testing, we mixed a batch of each formulation, allowed it to absorb into a towel, and then held the towel until it ceased dripping. We then weighed the towel in order to determine how many towels would be required to hold 18 g of OA for each formulation. Note: when I post this article to my website, I will include more photos of preparation and field application.
Field Log
From 21 June through 3 July, we took baseline alcohol washes from every hive in each yard, and applied treatments yard by yard, selecting hives for treatment that had varroa counts in the range of 5–20 mites (all mite counts in this article are per level half cup of bees—typically 320-340 bees), although as we ran short on colonies, we included some with starting counts of up to 28 mites. In each yard we assigned treatments in alphabetical order, starting where we left off at the last yard, so that we arbitrarily applied each treatment to approximately 25 hives (other than Treatment M, which was an afterthought), evenly distributed between yards (Figs. 4-6).
Update: We now prefer absorbent matrices other than shop towels, which have many disadvantages. Please refer to my more recent reports on extended-release oxalic acid.
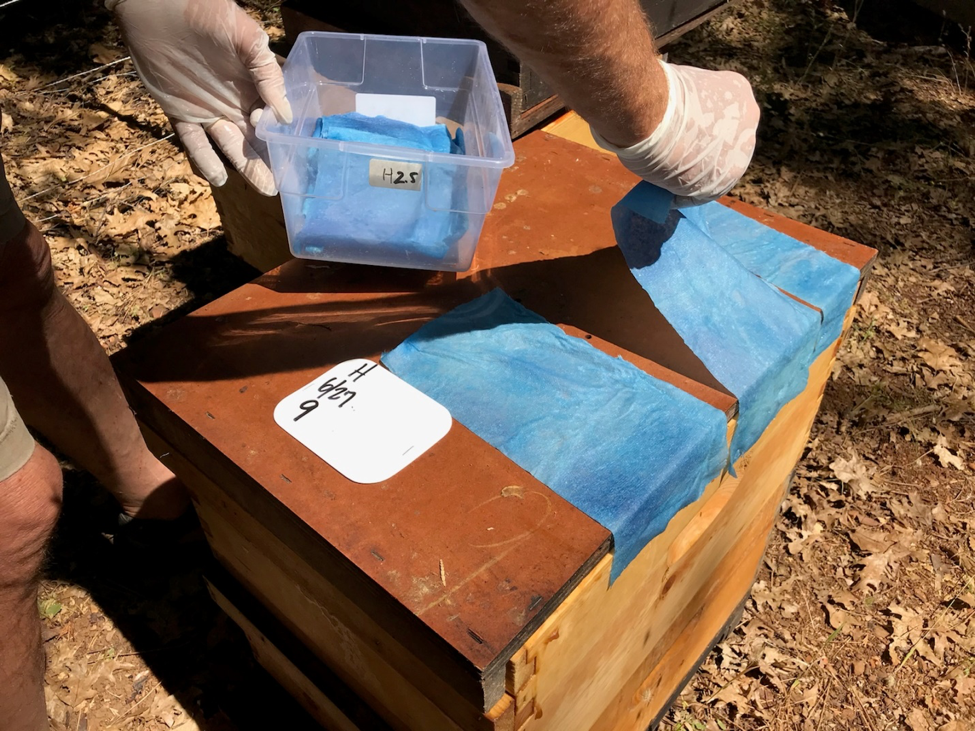
Figure 4. Each formulation required the application of a different number of towel halves or quarters, so we laid them out in advance on top of each test hive. We’ve learned that it’s best to designate one person to wear nitrile gloves and handle the towels; another to smoke the hives and open them.
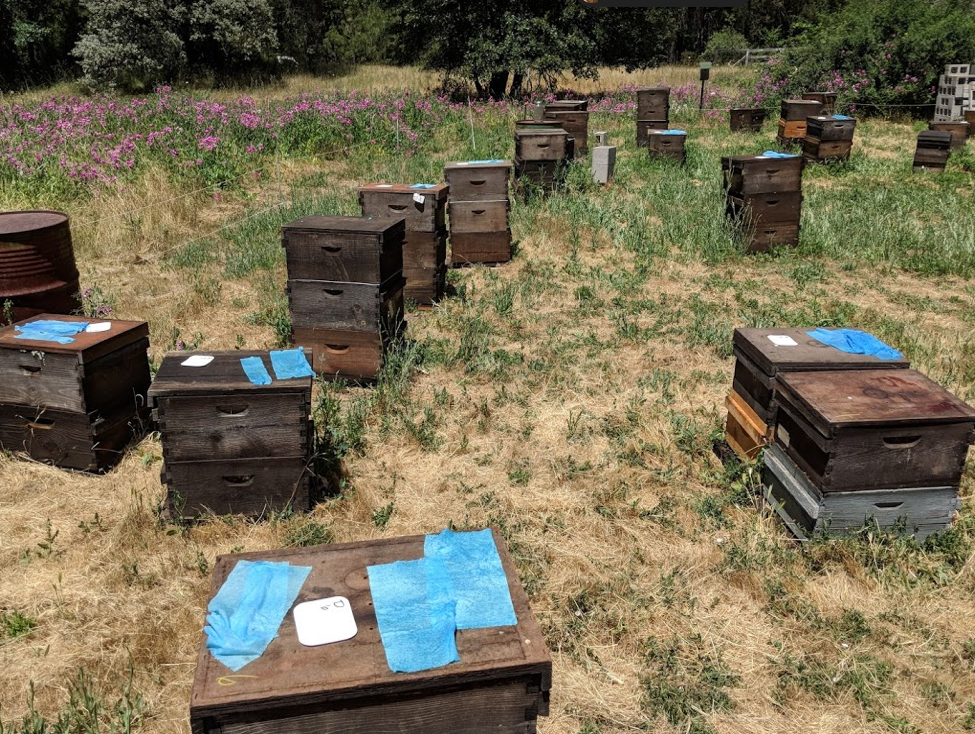
Figure 5. In each yard, we went down each row of hives, assigning treatments in alphabetical order. Here we’d laid out the towels and were ready for a double check on proper hive labeling and towel count prior to application. Most of the test hives were drawing foundation in the second box, some in a third. The towels were applied across the top bars of the lower brood chamber, with no queen excluder, since we’ve found that for good efficacy, that the towels are best applied in the middle of the cluster. Note in this photo that we excluded any hives with issues from the trial.
Our experience is that it is extremely safe to handle oxalic acid in this application method (especially compared to formic acid or oxalic vaporization), as there is no danger of splashing or inhalation. But the glycerin does make it stick to anything it touches (that’s why we add it), and you must remember to always wear nitrile or other resistant gloves (Fig. 6)
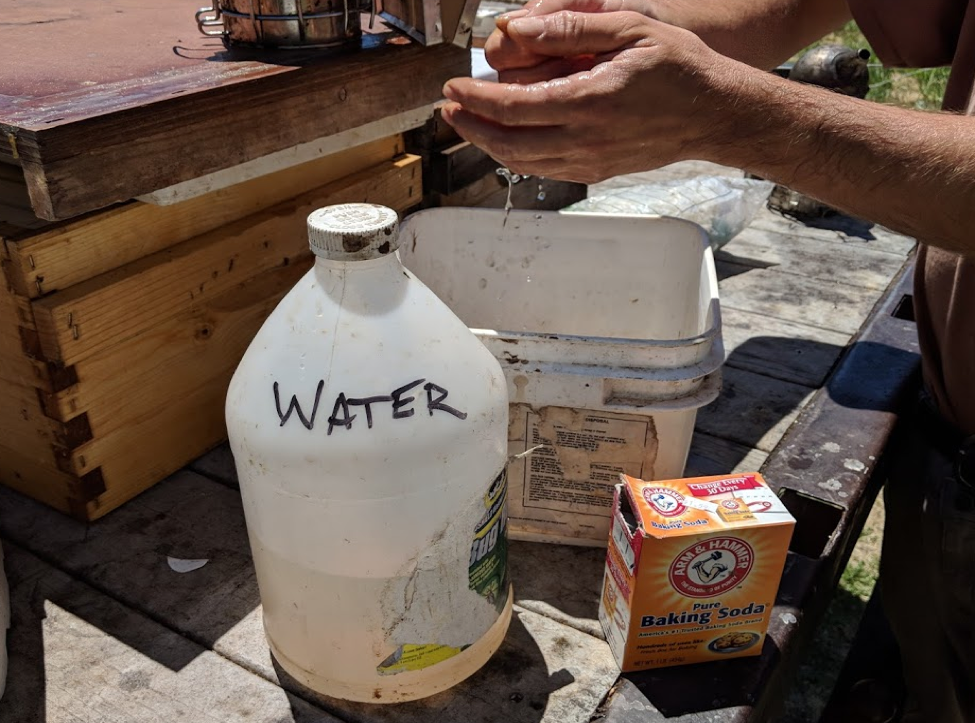
Figure 6. If you get OA/gly on your skin, you won’t notice for a while. So after any chance of exposure, we rinse our hands, hive tools, and smoker with a solution of baking soda, which immediately neutralizes any acid residues. A tip: we dust our hands with baking soda before pulling on the nitrile gloves (this also makes it much easier to slide your fingers in), and are careful not to touch anything else so long as we have gloves on.
During application of the towels, we noticed that some formulations were much easier to handle and apply than others (Table 2). This will be a consideration as we figure out the best way to apply this treatment.
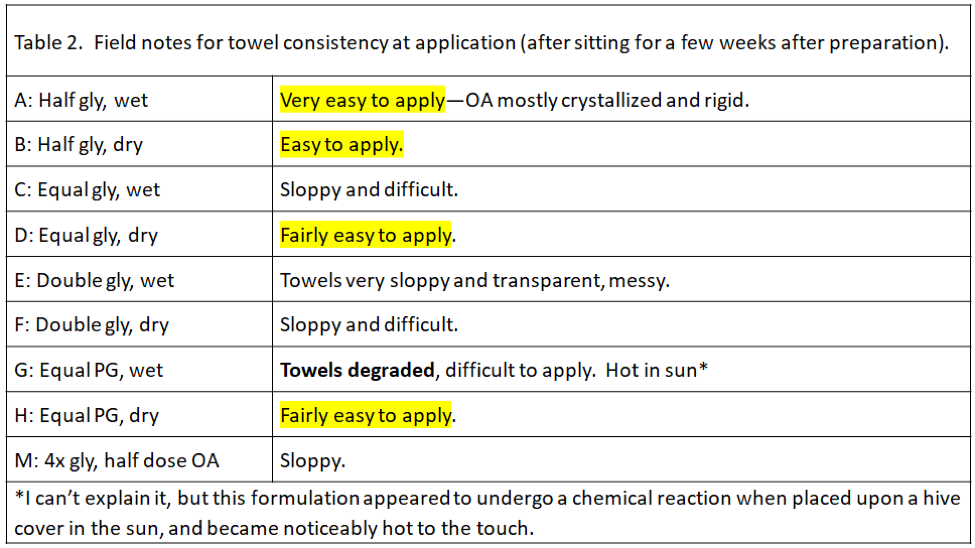
Any colonies in the yards that tested at a mite count of over 20 (or 28 in the last yards) were passed over, but given a strong formic acid treatment to reduce their mite counts to nearly zero, in order to avoid excessive drift of mites in the yards.
We left untreated 19 colonies with starting mite counts from zero to 13, to serve as Controls (and as potential mite-resistant breeders), again distributed through several of the yards. We did not use Control colonies with high mite counts, since they might later collapse and corrupt the trial due to mite drift. Note that the Control hives, due to their low starting counts, might have been the most mite resistant, which, if anything, would later underestimate the efficacy of the treatments.
After approximately 50 days, we took ending mite counts, again progressing through the yards in the same order. A few colonies had dwindled, and some were in the process of varroa/DWV collapse. Two yards appeared to have experienced substantial mite drift.
Results
We’ve already collected enough data on efficacy, lack of adverse effects, and lack of honey contamination to submit to the EPA, so all that I’m now trying to figure out is the optimal formulation and application method.
Analysis of the Data
I read a great number of scientific papers. I often get the impression that the researchers so want to get their paper accepted for publication, or to make their results appear important, or to support some product, that they’re unable to hide their bias. Since my research is funded solely by beekeeper donations, and since I’ve got nothing to sell, I’m going to go over these results with a very critical eye. My only vested interest is that I want a midsummer treatment that I can use in my own operation.
Honey bee field data is often messy, and a number of factors can affect mite buildup in a hive. What I’d like to show you is some of the ways that I looked at the data, in order to see what I could learn from this trial.
Midpoint Results
Both last year’s trial and my springtime trial indicated that OA/gly treatment may not cause mite wash counts to drop appreciably until after 3 weeks duration, so I didn’t want to waste time performing midpoint mite washes on all 225 test hives. Instead, in order to confirm that the same thing was occurring in this trial, at Day 21 after applying the towel treatments, we went to our largest yard (containing 60 test hives), and took mite washes from three normal-looking strong colonies from each treatment group (I skipped over weak hives, since they would have had greater OA exposure per bee; there were no M’s in this yard).
The results are perhaps best displayed by simply dividing the midpoint mite count for each hive by its starting count, which gives the fold change relative to baseline (e.g., 1.5 means that the average mite count went up by 50%; 0.5 means that the ending count was half the starting count) (Fig. 7).

Figure 7. Fold change in mite wash counts, per each hive, at Day 21 after application of treatments. Columns below the “no change” value of 1 indicate a reduction in the mite wash count (missing columns indicate no change). Note that the equal glycerin treatments had in only one hive reduced the mite counts by this time, although half had gone down in the double glycerin treatments. Note how this correlation flips by Day 50 in the next graph. At this point in time, neither the half-glycerin nor the propylene glycol treatments were impressive.
Endpoint Results
We waited to take endpoint mite washes until about 50 days (range 47 -56 days) after applying the towels. I took field notes on ending colony strength, disease, productivity, and number of hive bodies, in order to see whether there were consistent issues with any of the treatments. Nothing stood out.
I also wanted to make sure that the data wasn’t skewed by the results of a single yard. Since most of the 14 test yards had roughly the same distribution of treatment groups, I checked to see whether the results in any single yard stood out–none did (not shown). However, in nearly every yard the C and D treatments (1:1 OA:gly) most consistently prevented mite counts from increasing.
In all but 1 of the 19 Control hives (remember, we considered most of the Controls as potential mite-resistant breeders), mite counts increased–on average, fivefold. So two ways to look at the data would be (1) to see the average fold increase or decrease in mite count in each treatment group, and (2) to calculate the percentage of hives in each group in which mite counts went up (these could be considered as inadequate mite control). I’ve displayed the results in Table 3.
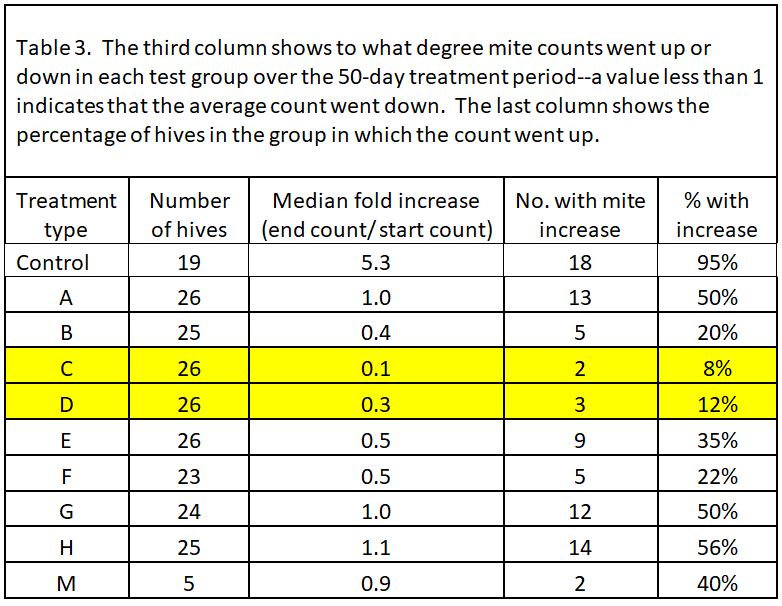
Note that most of the formulations resulted in some degree of mite reduction—but that some sure did a better job, and that’s exactly what I was interested in finding out. The yellow-highlighted 1:1 OA:gly treatments were the standouts.
Practical application: even the best OA/gly treatments did not prevent mite counts from increasing to some extent in about a tenth of the hives. So what should we make of those “outliers”?
Dealing with The Danged Outliers
A big problem with data analysis of mite treatments is the “outlier” values. No matter how effective the mite treatment, you’re likely to find some colonies in which the mites were not controlled. In this trial, the yards were surrounded by woods and residences with recreational beekeepers, so it’s likely that some of the test hives picked up extra mites from robbing or drift. As an example, let’s take a look at the pooled data for the C test group (Table 4).
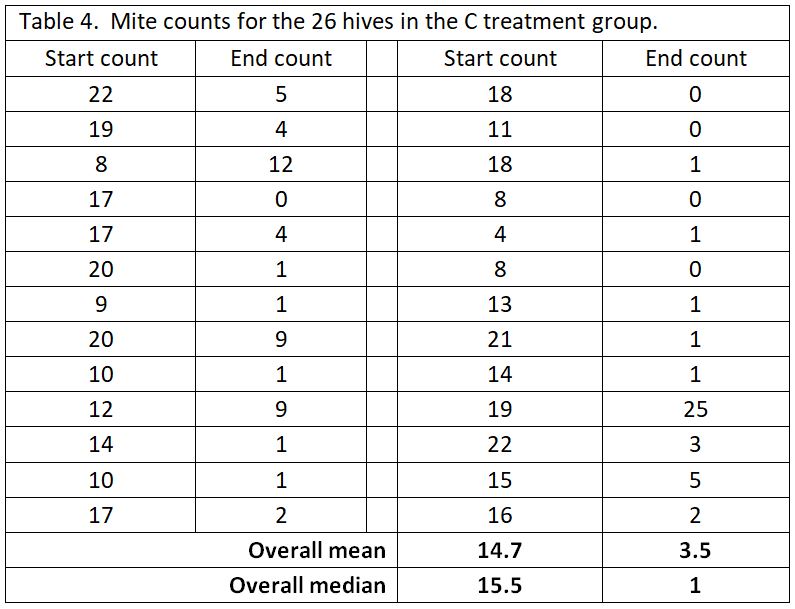
As you can see in the above table, most of the C hives had their mite counts reduced from high counts to very acceptable counts. But then there’s those danged outliers (such as where the 19 count went up to 25). We can’t tell whether the treatment did not work in that one hive, or perhaps that hive robbed out a collapsing hive, or something else. But that outlier value has undue influence if we use the arithmetical mean to represent the “average.”
For that reason, with mite count data, I prefer to look at the median value, since it is more resistant to the influence of outliers [[3]]. The median represents the midpoint value of the data set. You can compare the differences of the two sorts of averages at the bottom of the table.
Graphs are Easier to Visualize than Tables
It’s far easier for the human brain to detect patterns in graphical form than by just looking at a bunch of numbers. This is why we use charts—to put numerical data into a more visually-understandable form. Below (Fig. 8), I’ve graphed the fold increases by simply “normalizing” the data (by dividing each group’s starting and ending counts by its starting count), which then makes all groups start at a value of 1, and easier to compare.
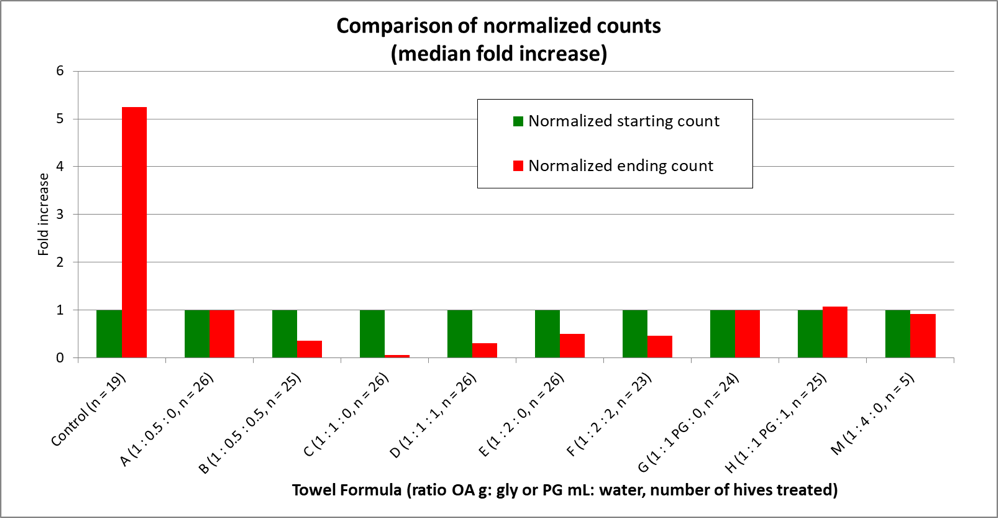
Figure 8. By normalizing the data to all start at a value of 1, it’s then easy to compare the changes in mite infestation rate for each treatment group over the course of the trial. Note the huge difference between the Control and C groups—we’ll return to that later.
Any treatment that prevents varroa levels from increasing would be good, but what most of us are interested in are treatments that actually reduce the mite count. So next I calculated the percentage of hives in each treatment group that reduced the mite count to less than a quarter of the starting level (Fig. 9).
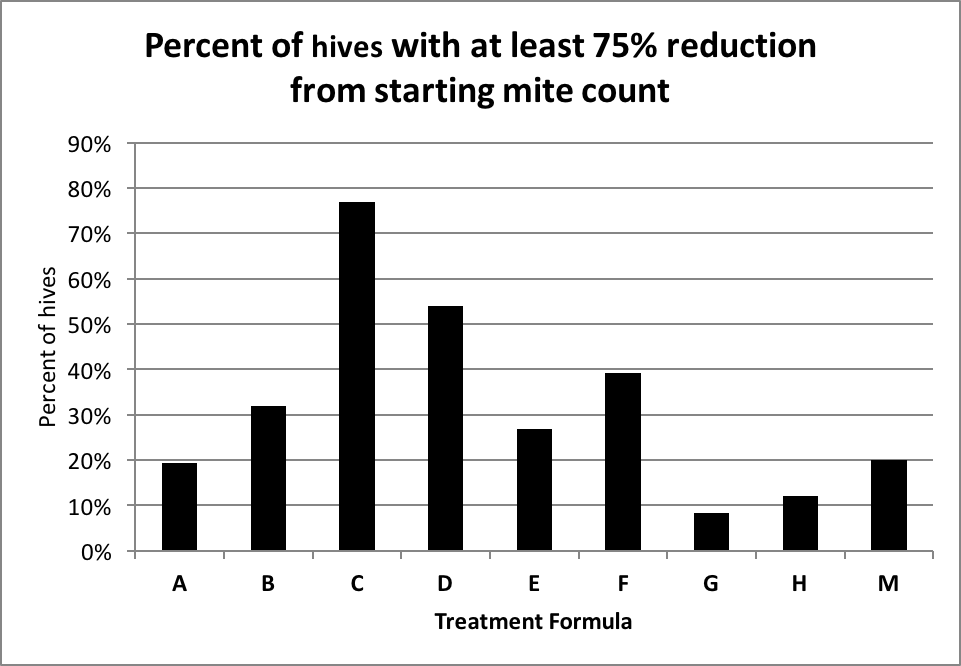
Figure 9. The percentage distribution of hives exhibiting at least a 75% reduction in mite count. The chart indicates that in 77% of the C hives, and 54% of the D hives, the mite count was reduced by at least three quarters (it may take a minute to get your head around this chart).
But simple reduction of counts at the time of year that the trial was run doesn’t tell the whole story as far as efficacy of treatment compared to the Control group, since alcohol wash mite counts would have been expected to greatly increase at this time of year, not only because the mites had had nearly two months to build up, but the colonies had also gone from early honey flow buildup into dearth, with a resulting shift of mites from the broodnest to the adult bees, not to mention the immigration of mites from collapsing high-mite hives in the neighborhood. I’ve illustrated this with a snip from a simulation by my mite model for the Control hives in this trial (Fig. 10).
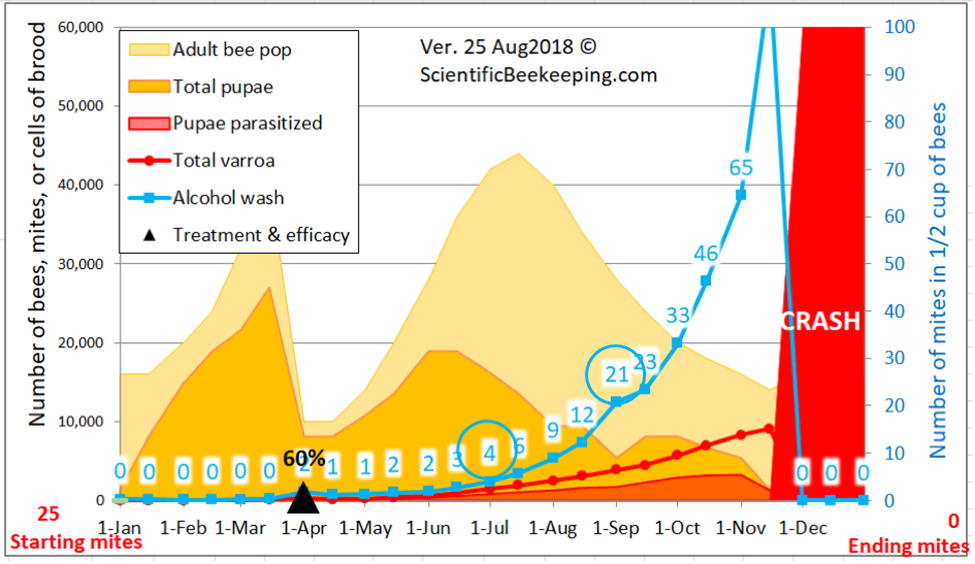
Figure 10. A simulation [[4]] for the mite buildup in the Control colonies. I’ve circled the predicted counts; the actual median field counts for the 19 Control hives were 4 and 21— hard data which helps to validate the model.
So the reduction of mite increase by each treatment must take into consideration that the mite counts, without treatment, would have been expected to increase fivefold (refer back to Fig. 8). This is taken into consideration by the various methods for calculating the efficacy of a treatment. I prefer using the Henderson-Tilton formula [[5]], using median values in order to minimize the effect of outliers. I’ve graphed the results below (Fig. 11) with the median values for the starting and ending mite wash counts shown as columns, and the calculated efficacies of treatment in boxes above the columns.

Figure 11. This chart shows the actual median starting and ending mite wash counts for each group, with the calculated overall efficacy of treatment above each red column. Error bars indicate the median absolute deviations. Compared to the huge increase in mite counts in the Control group, all the treatments exhibited good efficacy. The standouts were the C and D 1:1 ratio formulations, with up to 99% calculated efficacy.
The above chart is the sort of overall representation of the data that a scientist would want to see, since it includes error bars, which indicate how well the calculated median values actually represent the raw data with those danged outlier values. What one looks for is whether the error bars for any pair of columns overlap each other.
It appears that I got close to choosing the best ratio to test last year, since in this summer’s trial, formula C was the clear winner, at 99% efficacy, and no overlap of error bars. It was immediately apparent as we took final samples that the C- and D-treated colonies generally looked the best, as far as health and honey production, although there were good and poor colonies in each treatment group. However, the C formula creates a soggy towel that is difficult to apply—a formula halfway between C and D might be optimal, and would require one full shop towel per hive.
The low-glycerin A and B treatments didn’t fare well, nor did G and H, which used propylene glycol, which is also food grade, but with much less viscosity and surface tension than glycerin—but there didn’t’ appear to be a benefit. Surprisingly, the low oxalic/ high glycerin M treatment managed to attain 82% efficacy, despite only containing only 9 grams of acid. The original 2:1 Argentinian formula did pretty well at about 90% efficacy. Based upon this single trial, I’d hesitate to declare a clear winner, but there are other considerations.
Discussion
Of interest is the performance of the Argentinian ratio of 1 g OA to 2 mL glycerin. In my springtime trial (in prep) this formulation stood out since it resulted in what appeared to be (I’ve yet to confirm by titration) an immediate transfer of OA onto the bees, causing agitation and increased mite drop over the first few days, with formula C being next behind. This confirmed what I observed in my cage trials (and in last season’s field trials)—that towels dripping with glycerin rapidly dispersed the acid onto the bees and mites (which may account for the Day 21 performance of the E and F groups). But that rapid dispersion can result in adult bee agitation and brood kill in the first week. I have not investigated this with the hanging strip application method, and am not critical of it. However, based upon the results of this trial, when applied via shop towel across the top bars, it appeared that the lower glycerin ratio gave better overall performance.
I’ve now run four separate controlled field trials on OA/gly towels, under California conditions, in different yards, in two different years. In all four, I obtained at least 90% efficacy after 42-50 days, using formulations in the 1:1 range. I’m pretty excited about getting this application method approved.
Surprisingly, we get this efficacy at about 1/5th the dose of oxalic acid necessary with the Argentinian strips—18 g per hive vs. 80 g. That 18 g is equivalent to about 9 OA dribbles or vaporizations, although some of the OA remains in the towel residues.
Comparison to Oxalic Vaporization (Sublimation)
I was curious as to how the effect upon varroa from extended-release application of 18 g of oxalic acid in glycerin would compare to repeated oxalic acid applied by vaporization. In my springtime trial I had tested two models of vaporizers on one colony each, so I extended those repeated vaporizations through the summer trial. In all, I applied to those two hives a total of 9 treatments of 2 g of oxalic acid each (resulting in the same total of 18 g), at roughly 10-day intervals over a period of 102 days. I’ve plotted their mite wash counts below (Fig. 12).

Figure 12. The results of repeated vaporizations of hives with brood. I switched the Varrox hive to using the ProVap 110 in July (to save me the trouble of using two different electrical sources). I plan to run a more formal trial next year to compare repeated vaporizations to dribbles. Thanks to Larry at OxaVap.com for the donation of the vaporizers.
It’s surprising to me how well the bee colonies handle regular exposure to oxalic acid. In my towel-treated hives, the brood looks great at 50 days. Ditto for those hives that received 9 vaporizations (Fig. 13).
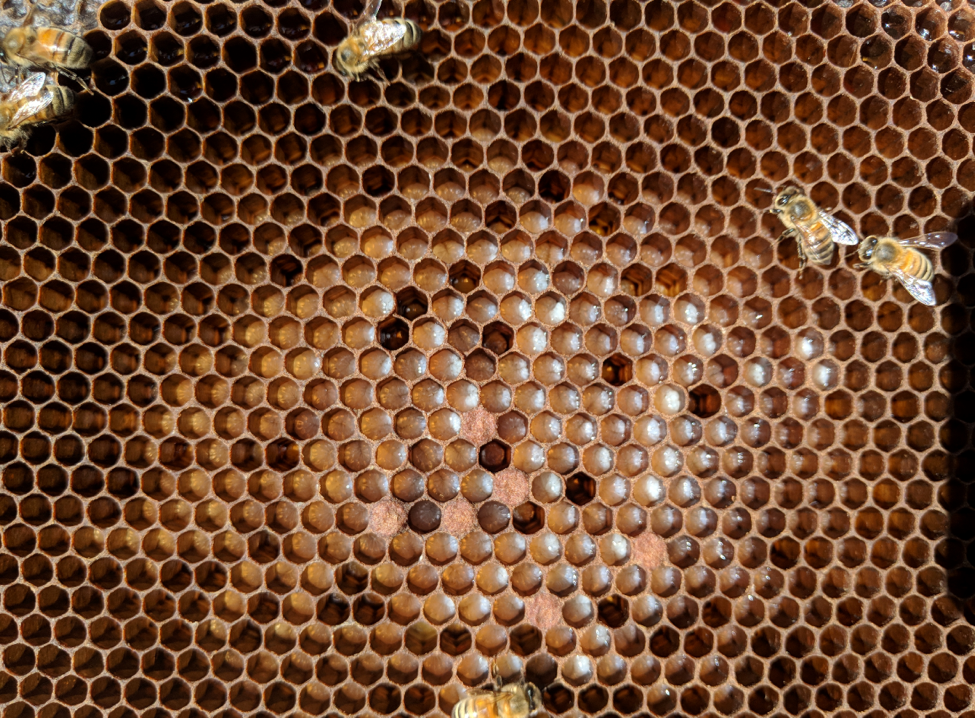
Figure 13. This photo illustrates the high rate of brood survival in the ProVap 110 colony 10 days after its 9th vapor treatment. My informal observations indicate that colonies can handle repeated or continual exposure to oxalic acid quite well. I’d hesitate to treat colonies continually all year, but oxalic certainly has its place in our arsenal of mite control tools.
The bottom line is that the above data indicate that a single application of an OA/gly towel may give as good results as multiple vaporizations, but without the need to wear a respirator and eye protection. Vaporizers have the advantage of being able to apply the treatment without cracking the hive, not leaving any remnants to remove, and some, such as the ProVap 110 are pretty quick. But those with any sort of pressure chamber should be used with caution (Fig. 14).

Figure 14. My friend Bill Hesbach in Connecticut was using a vaporizer, and inadvertently pressed the vapor exhaust tube against an end bar. The vaporizer blew its lid—splattering his face shield with molten oxalic acid. Bill could easily have lost his vision. Be careful when using vaporizers!
Pros and cons
The main pros of extended-release OA/gly are:
- It has high efficacy even when brood is present (at least in California),
- It appears to exhibit minimal or no adverse effects on the colony,
- It can be applied while honey supers are on,
- It can be used in hot weather,
- It’s very easy and safe to apply,
- It shouldn’t contaminate the beeswax,
- It’s very inexpensive, and
- It’s considered “organic.”
That’s a lot to love! But there are also some shortcomings and things to still work out (besides getting it registered by the EPA).
One problem with OA/gly towels is that some colonies remove every bit of the applied towels (Fig. 15), whereas others barely touch them (Fig. 16)—meaning that you need to scrape out the acidic residues with a hive tool (they are corrosive, but readily decompose on the ground). The towels also make inspection of the lower brood chamber more difficult, but most of us don’t inspect that chamber during the honey flow anyway.
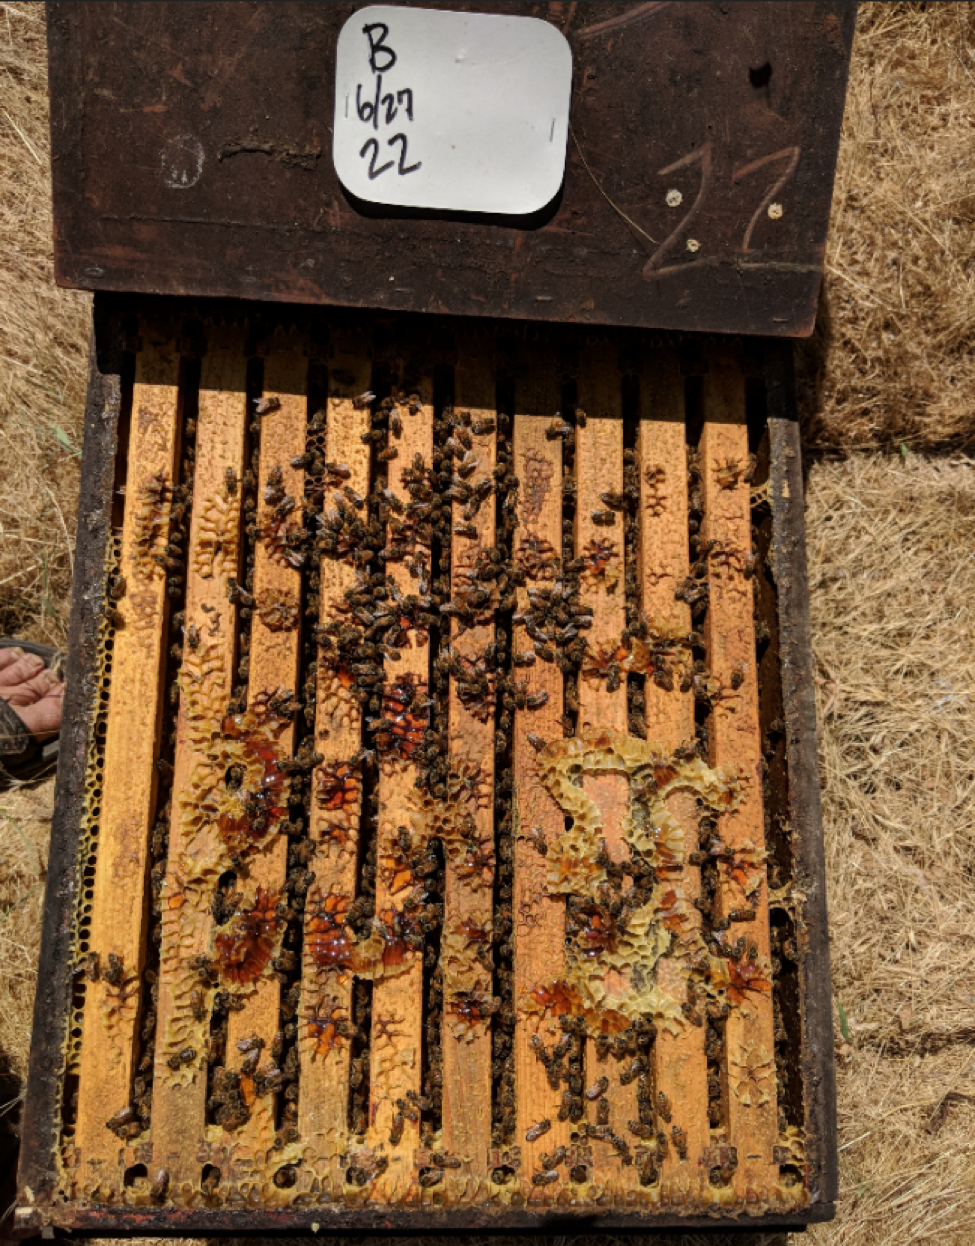
Figure 15. Some colonies completely removed every trace of the towels by Day 50. I only wish that this were true for all hives.
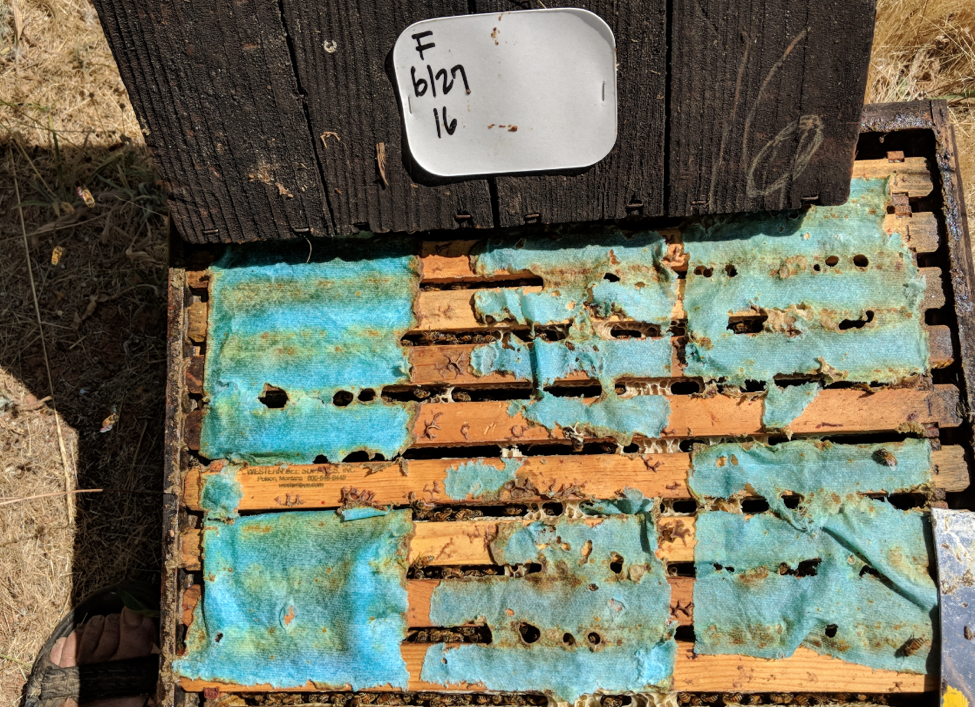
Figure 16. Alas, some colonies apparently have little interest in house cleaning, and barely remove any of the towel treatment. These residues scrape off easily, but are still acidic, so your hive tool needs to be rinsed afterwards.
The other shortcoming is that it takes at least 6 weeks to realize the full effect of the treatment. This is a treatment best used proactively, rather than after mite counts have already climbed to high. Don’t expect this treatment to quickly take care of high varroa infestations late in the season.
My feeling is that if we manage to get this application method approved for putting into our hives just before we add honey supers, it could be a godsend to us in our battle against varroa.
Moving on from Here
Let me be clear–I’m not stuck on the shop towels. Using vertical cardboard strips was simply too labor intensive for a large-scale beekeeper, but could be fine for a hobbyist. Another beekeeper outside the U.S. reported to me that they get better absorption with another brand of paper towels. I’m wide open to experimenting with other towel types or completely different matrices to hold the OA/gly solution.
As of now, it appears that the most promising formulation might be 1:1:0.5 (OA g: glycerin mL: water mL). This formulation would be a compromise between the efficacy of the C treatment and the handling characteristics of the D treatment, and would require 1 fully-saturated shop towel per hive. I have not yet tested this formulation.
For permitted researchers only
I’m getting requests from researchers worldwide about my methods. I’m including them here so that other researchers with proper permits can replicate my experiments. These instructions are only for the use by those with government approval to test this experimental application method.
Updated 28 July 2019–after preparing and applying 2000 towels this month.
We love the formula below as far as the texture and ease of applicability of the towels in the field! They peel off the roll nicely.
I’m also getting reports that this formulation may not work as well in humid areas. If you’re in a humid area and want to run a controlled experiment, please let me know.
Although there is great interest from beekeepers, this extended-release oxalic acid application method is not yet registered for use in the United States, and thus I do not condone or promote its use, other than for experimental purposes by those who have received written permission by their State Lead Agency. The formula that I plan to experiment with in 2019 is:
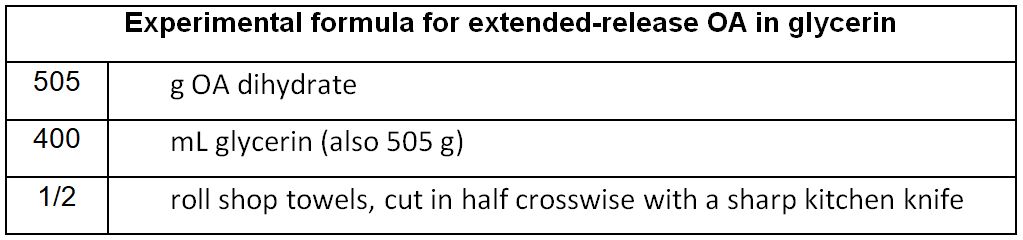 Note that the above ratio is equal parts of OA to glycerin, weight:weight.
How to prepare one or more half rolls at a time in an appropriately-sized saucepan. Each half roll will treat 27 hives. Use a small pan to prepare a single roll at a time, or a larger pan to prepare multiple rolls at one time. You can prepare as many rolls per batch as the saucepan can hold standing up in a single layer without crowding.
Safety: wear protective eyewear and nitrile gloves. The glasses are most important, since splashes do happen! If you get any solution on your skin or clothing, wash it off with warm water. A solution of baking soda in water will immediately neutralize any spills. In practice, we find it very safe to prepare towels by this method, using normal kitchen safety technique.
- Prepare the rolls of towels: cut the rolls of towels exactly in half (5 1/2 inches) with a sharp kitchen knife. Not necessary, but you can cut pieces of 1-1/4″ PVC pipe to slide into each towel roll.
Use a stainless saucepan/pot that has a copper bottom embedded in the stainless steel, which prevents hot spots — I suggest using a dedicated saucepan since it may discolor from the acid. Weigh/measure out as many multiples of the above formula as the number of half rolls that can easily fit in a single layer on the bottom of the saucepan (you want enough room that the rolls can be easily manipulated). You can of course prepare a single half roll at a time. Remove any towels from the saucepan before adding any ingredients.
Add the OA: to avoid splashing, first carefully pour the measured amount of OA into the pan.
Add the glycerin: then pour in the glycerin (the glycerin can be carefully pre-warmed to around 170°F in a microwave).
2. Turn on heat under the pan, and wearing safety glasses, stir gently until the OA crystals dissolve (use a dedicated stainless steel or plastic spoon). Make sure that you have a plate to act as a trivet next to the pan, onto which you can rest acidified utensils.
Tip: A potato masher helps for breaking up the clumps of OA as you are dissolving it.
Once the crystals are nearly all dissolved, turn down the heat to prevent overheating. Do not allow the temperature of the solution to exceed 170°F (77°C). Overheating causes an unwanted chemical reaction that produces bubbles – if you see bubbles starting to bubble up, it’s too hot!
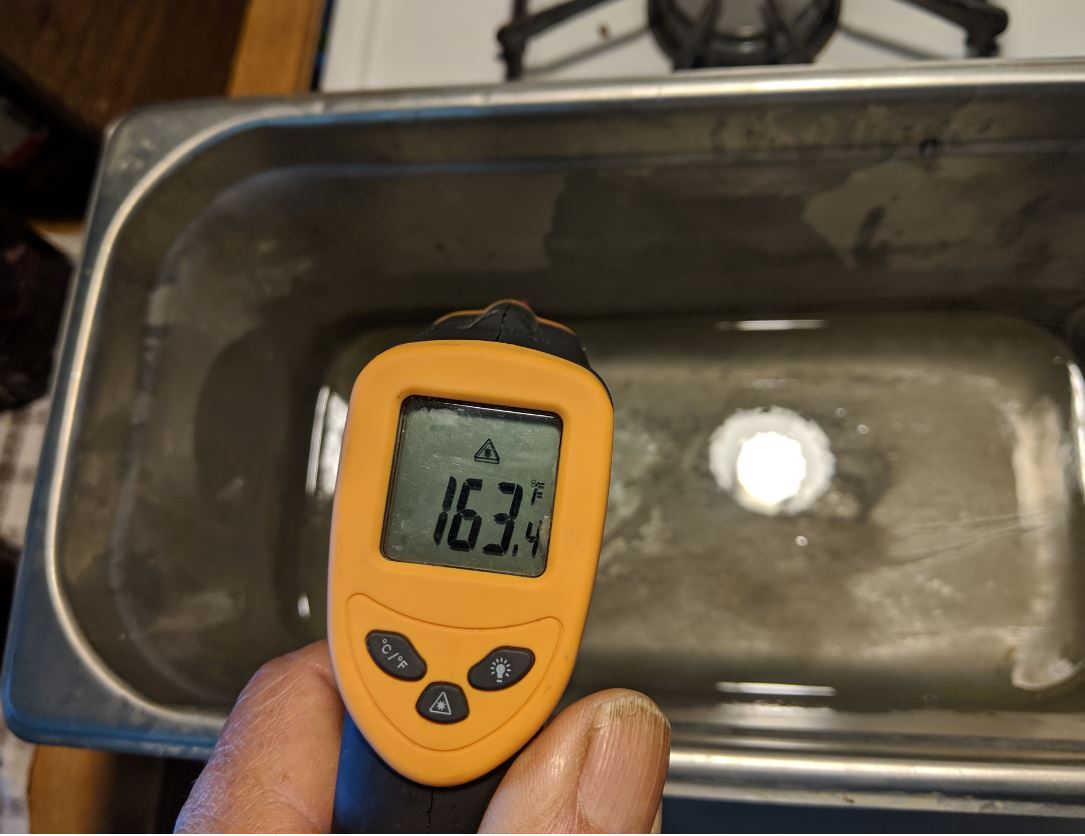
A digital infrared thermometer works great for keeping tab on the temperatures.
3. Once the crystals are completely dissolved, and the solution is crystal clear, bring it up to around 170°F and turn off the heat.
4. Preheat the rolls of towels: Place the half rolls of towels in a microwave for 30 seconds to preheat the towels (no longer than 30 seconds, as the microwave will char the inner towels, or perhaps cause them to burn). This formulation requires both the towels and the solution to be quite warm in order for the towels to fully absorb the liquid.
5. Place the roll(s) into the solution: Carefully stand the rolls on end in the pan–I use the potato masher to hold them in place. Be careful to avoid sudden movements or splashing!
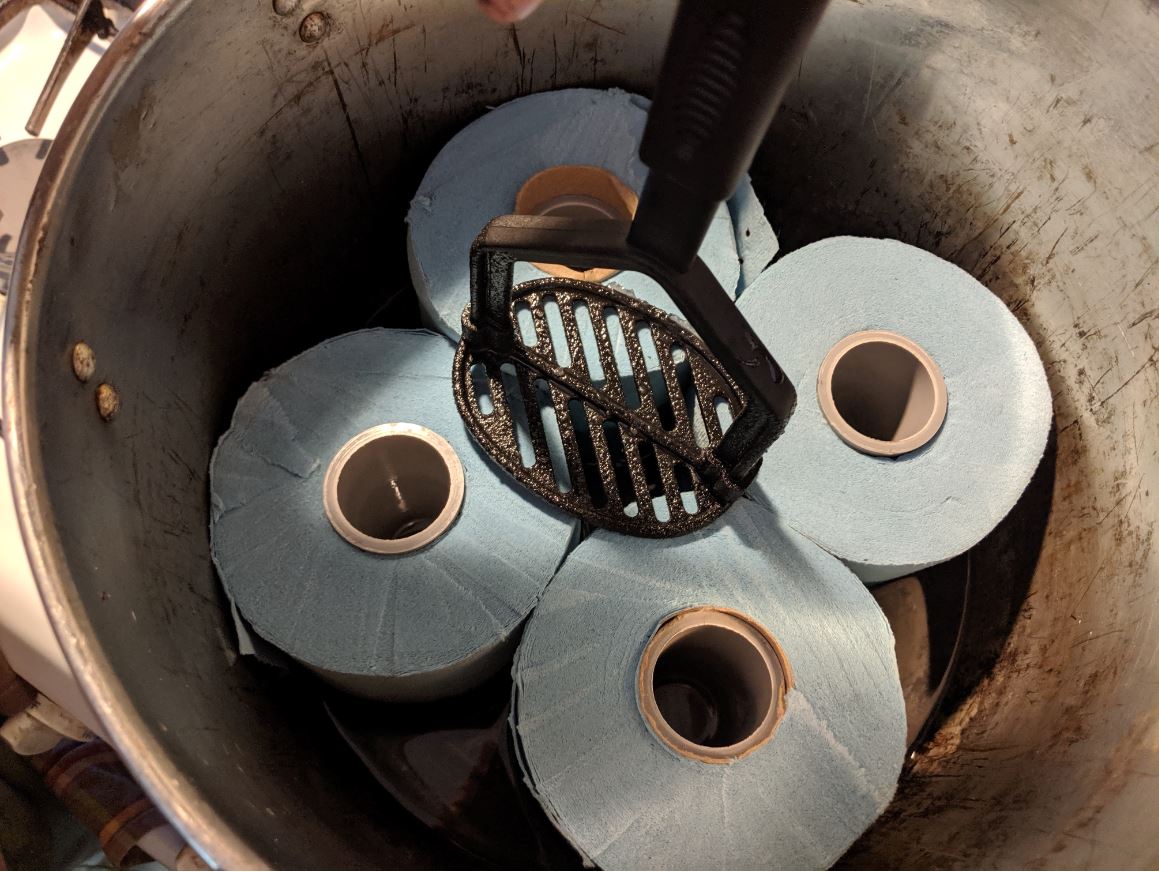 Here are four rolls placed into a pot of hot solution. This pot is too small, which makes the rolls difficult to manipulate or flip over.
Allow the rolls to absorb the hot solution: the OA/gly solution will wick up into the rolls, reaching 3/4 of the way up in a couple of minutes. At that point, we use kitchen tongs to carefully flip the rolls over to absorb the rest of the solution.
Optional: keep low heat on the pot during absorption, but don’t forget to keep an eye on the temperature, not allowing it to exceed 170°F.
Drain the towels: Once all the solution is absorbed, use tongs to place the rolls on a grid to drip off for about 30 seconds, then place the rolls on end in plastic tubs. At this time use the tongs or other utensil to make the rolls as round as possible, for easier removal of towels in the field.
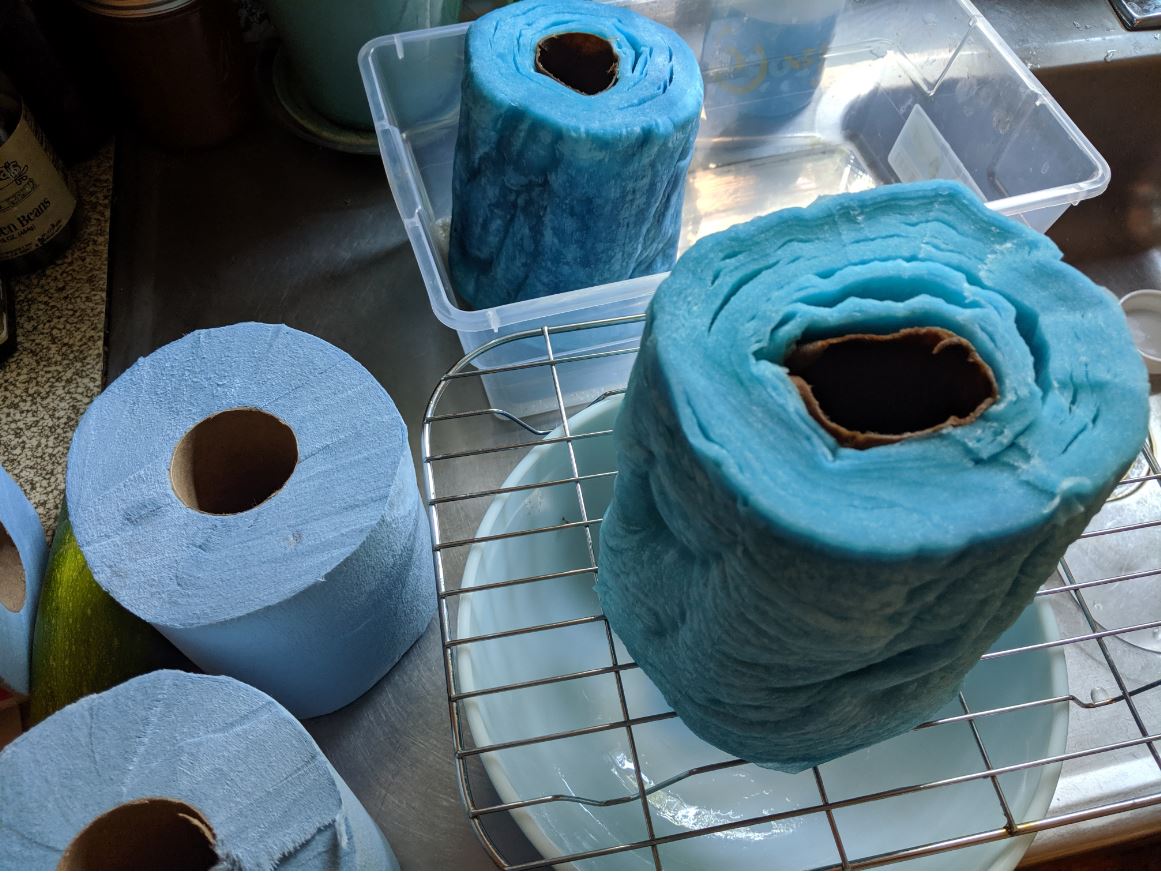
Here’s a towel draining on the rack (very little drips off) before placing it in a plastic tub for firming up, and then transport. I measured the gained weight of a number of rolls, and they were consistent enough for my purposes. This “saturate and drain” method is very fast.
I’ve been looking for a larger pot in which to prepare the rolls. Yesterday, Stephanie and I stopped at a yard sale, and bought a large Frigidaire Radiant Wall Broiler Grill and 2 Racks (for a dollar). These vintage pans are readily available on EBay.
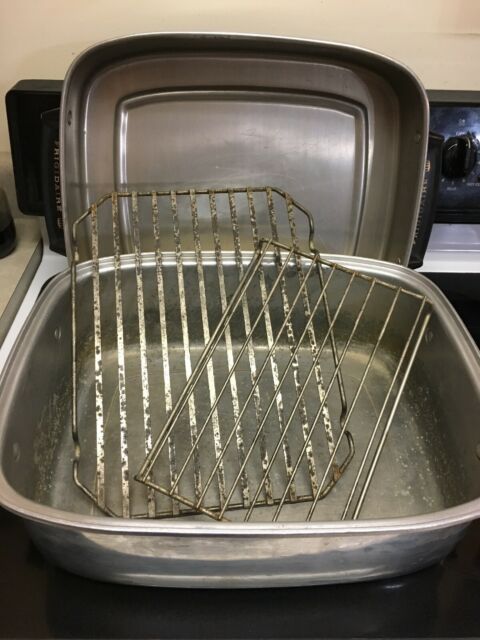
I was curious as to whether the acid would damage the aluminum, and whether the thin aluminum would apply even heat to the oxalic/glycerin solution, so I heated up some leftover solution:
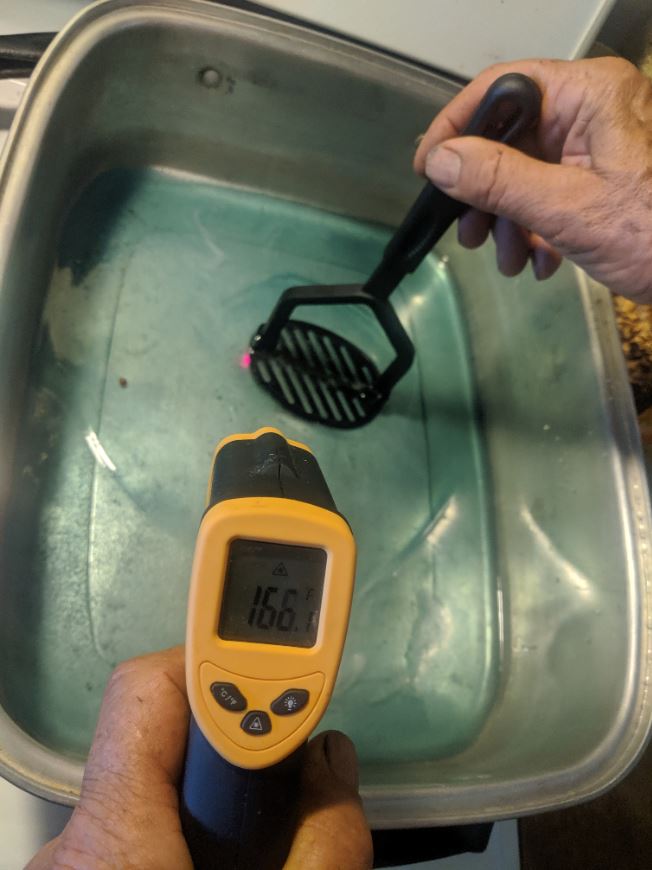
Wow, very impressed! Even heat distribution when placed over two gas burners. I held the solution at around 170°F for several minutes (note the plastic potato masher for dissolving lumps of OA). There was minimal discoloration to the pan, so apparently scant chemical reaction. I don’t need to make any more towels for a while, but plan to use this pan in the future. The pan will hold 8 rolls at a time, and the lid and rack will make a great drain pan.
Flip and firm up the towels: allow the rolls to sit for a few hours or overnight. After a few hours, the OA will recrystallize, improving the texture of the towels for application in the field (they get more stiff and less “oily”). At this point, flip the towels over, and the remaining uncrystallized solution will equalize in the towels. See photo below.
Note the blue pigment line down the center of the towel above, indicating even distribution of solution from both ends of the roll. Also note the small brown circle of char typical from preheating the dry roll in the microwave.
Field application: Apply 2 half towels per dose between the brood chambers, leaving a bee space between the towels. This will apply a total dose of 18 g of OA.
Don’t expect immediate results—full mite control will take 6-7 weeks. Treatment can be repeated at 6 weeks.
Acknowledgements
Thanks to Maggi group for their initial work on this application method, to all the beekeepers who have donated to my research, to my sons and crew, my assistant Brooke Molina (who handles getting things done on the right dates, plus the mountain of data sheets), and my ever supportive wife Stephanie.
References
[1] https://scientificbeekeeping.com/beyond-taktic/
https://scientificbeekeeping.com/extended-release-oxalic-acid-progress-report-2/
https://scientificbeekeeping.com/extended-release-oxalic-acid-progress-report-3/
https://scientificbeekeeping.com/the-varroa-problem-part-15/
[2] Maggi, M, et al (2015) A new formulation of oxalic acid for Varroa destructor control applied in Apis mellifera colonies in the presence of brood. Apidologie 47(4): 596–605.
[3] In order to minimize the effect of outliers, we can use robust statistics, in which for “average” values we calculate the median instead of the arithmetical mean, and use the median absolute difference instead of the standard error of the mean.
[4] Using https://scientificbeekeeping.com/randys-varroa-model/
[5] I’ve created a handy calculator for the use by other researchers or citizen scientists at https://scientificbeekeeping.com/henderson-tilton-calculator/