
Mite Control While Honey is on the Hive

February 21, 2021
Mite Control While Honey is on the Hive
Part 1
First Published in ABJ November 2020
Randy Oliver
ScientificBeekeeping.com
During our hot, dry California summers most of our nectar flow may be over by early July, but if we’re lucky, our hives may still put on some harvestable honey. In any case, to control varroa at this time of year we can only use mite control products or methods that won’t taint the honey. I’ve been experimenting with extended-release oxalic acid, and wanted to try a new delivery matrix, as well as to compare its efficacy to that of the two miticides currently approved for use when honey is on the hive.
Introduction
Varroa mites build up at a relatively predictable rate in untreated, nonresistant, hives. You can use my open-access model [[1]] to predict the buildup of mites, as well as the effects of treatments (Figure 1).
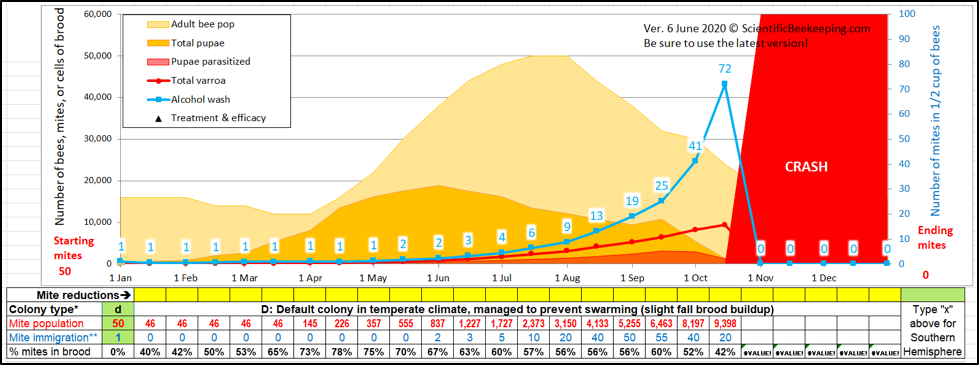
Fig. 1. A simulation starting with 50 overwintered mites in the hive in January (a relatively low level). Note that mite wash counts might not seem to be of concern until late summer, despite the varroa population exponentially building up to nearly 10,000 mites in the hive. In order to survive the winter, this colony needed to receive a treatment by mid-August at the latest, while harvestable honey might still be on the hive.
Beekeepers often speak of varroa “exploding” in the hive, but if you take a look at the red line representing the total mite population of the hive, you can see that no explosion actually took place, despite the simulation accounting for a gain of 245 mites coming in via drift. The problem is that we humans have a poor understanding of the implications of exponential growth. It may help to clarify three concepts:
- The relative rate of increase of the mites
- The mite infestation rate of the bees
- The absolute change in number of mites in the hive
The relative rate of increase of the mites
This rate is the proportional gain in mites by the end of a time period, relative to their population at the beginning. For modeling purposes, the r value is calculated, which represents the instantaneous rate of change of population size (per individual). For varroa, the r value is typically greatest when a colony has a high proportion of brood relative to adult workers, and contains the most amount of drone brood.
Until I began modeling varroa population dynamics, I thought that the bee population buildup left the mites behind in the spring, with the mites “catching up” late in the season. But I now understand that I was wrong – the mites lead the race from the get go (Figure 2).
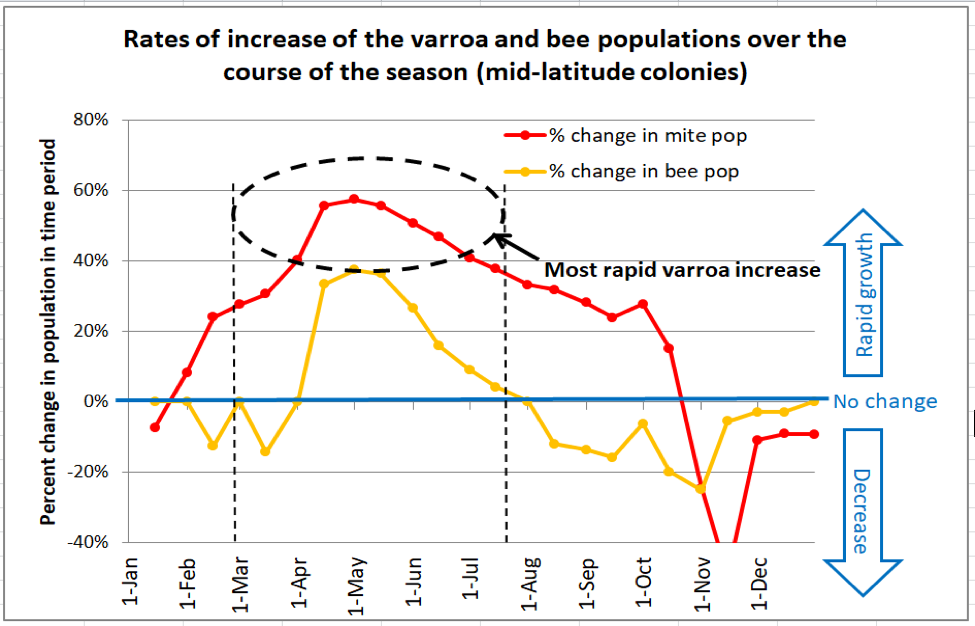
Fig. 2. This chart (from the same simulation as Figure 1) compares the relative rates of increase of the adult bee population in the hive (orange line) to that of the varroa population (red line). The horizontal blue line would indicate no population change over that 15-day time period. As you can see, the mites outpace the bees for nearly the entire season, but increase at the most rapid rate during the spring [[2]]. A simulation for hives taken to almonds (not shown) indicates that the rapid growth phase of the mites occurs even earlier in the season – during February and March.
This is an additional chart showing how varroa starts to build up even earlier in colonies going to almond pollination.
Practical application: Don’t let low mite wash, sugar shake, or stickyboard counts early in the season fool you – this is when varroa really gains a foothold in the colony.
The mite infestation rate of the bees
The mite population in the hive increases exponentially over the course of the season, whereas the adult bee population tops out in midsummer. Of even greater import is that the amount of brood (mite food) starts to decrease early in the summer – meaning that there will be less brood for more mites, resulting in an increasing proportion of pupae being parasitized (the red-shaded area in Figure 1). Once about a quarter of pupae or adult bees become parasitized, the colony generally doesn’t have long to live, due to Deformed Wing Virus (DWV) going epidemic in the hive.
Practical application: A relatively fixed population of bees and brood, coupled with an exponentially-growing population of mites, is a recipe for disaster.
the absolute change in number of mites in the hive
The above relative rates of increase only begin to tell the story. Although the rate of increase of the mites is high in the springtime, there are so few mites in the colony (compared to the number of bees), that even a doubling of the mite population is barely noticeable, and may not have a noticeable effect upon the colony.
But it’s a different picture when, for the same simulation, I plot out the absolute (net) gain in mites in the hive for each 15-day time period (Figure 3).
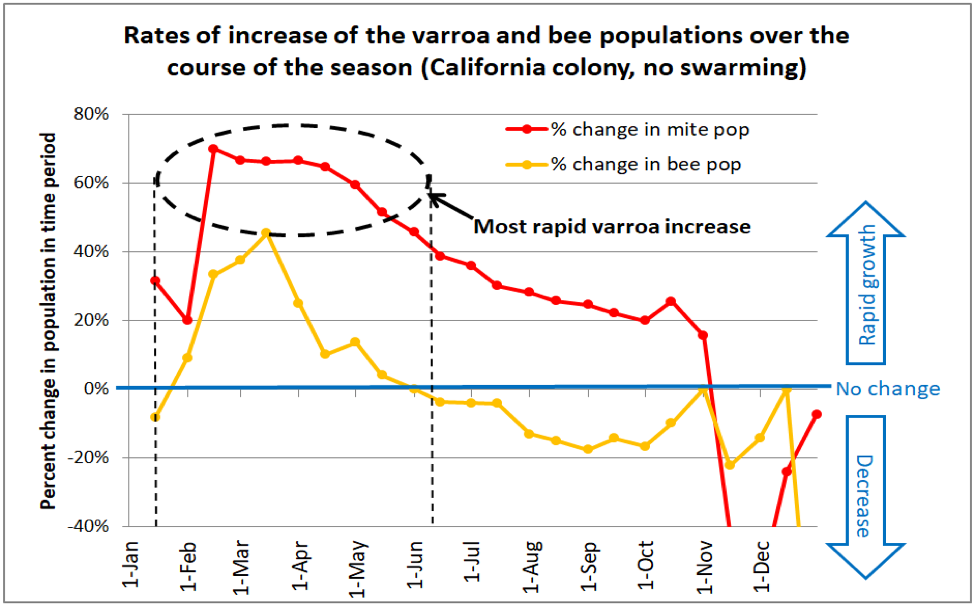
Fig. 3. The simulation above starts with 50 mites on January 1st. By the first of May the in-hive varroa population was increasing by 200 additional mites every 15 days. But by the first of July the increase was over 600 mites in 15 days, and by August they were building up at a rate of over 1000 mites every two weeks.
Practical application: If a colony goes into May with a sizeable mite population (as indicated by a mite wash count of over 1 mite per half cup of bees), the mite population will increase tremendously during the honey flow, building up to a dangerous level by September. Take home message: get the mite population down early in the season.
So let’s run the same simulation, but this time reduce the mite population by 80% with a treatment on the first of May (Figure 4).
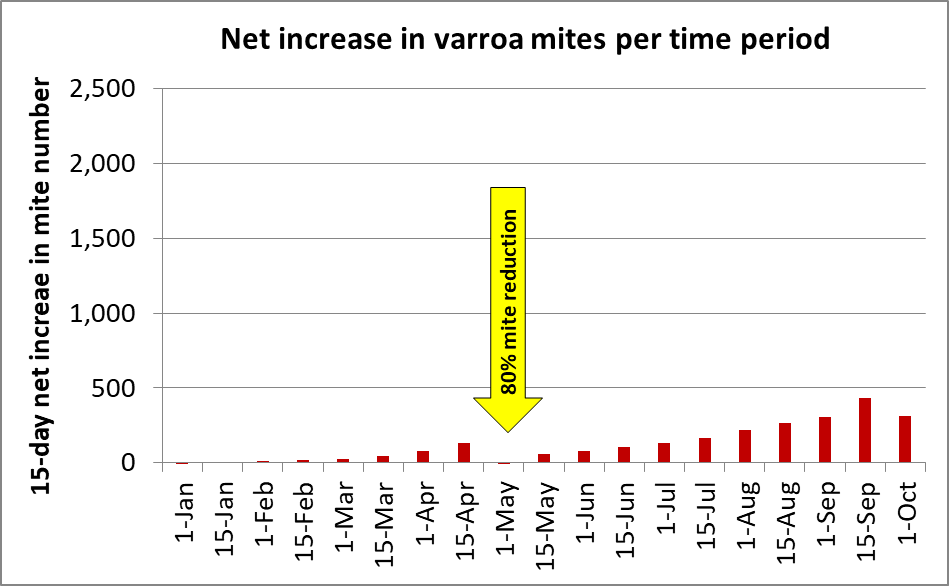
Fig. 4. In the same simulation as in Figure 3, I included a mite treatment on May 1st that decreased the total mite population by 80%. Note how that treatment prevented the mites from ever increasing again at a high absolute rate.
Practical application: Early-season mite management is critical in order to keep your colonies healthy and productive – many beekeepers make the error of waiting until the horse is already out of the barn. But we can be caught by surprise, and may need to reduce the varroa population during summer. Our problem is that there are currently only two mite-control products that are registered for application during that time period, or while harvestable honey may be on the hive (Figure 5).
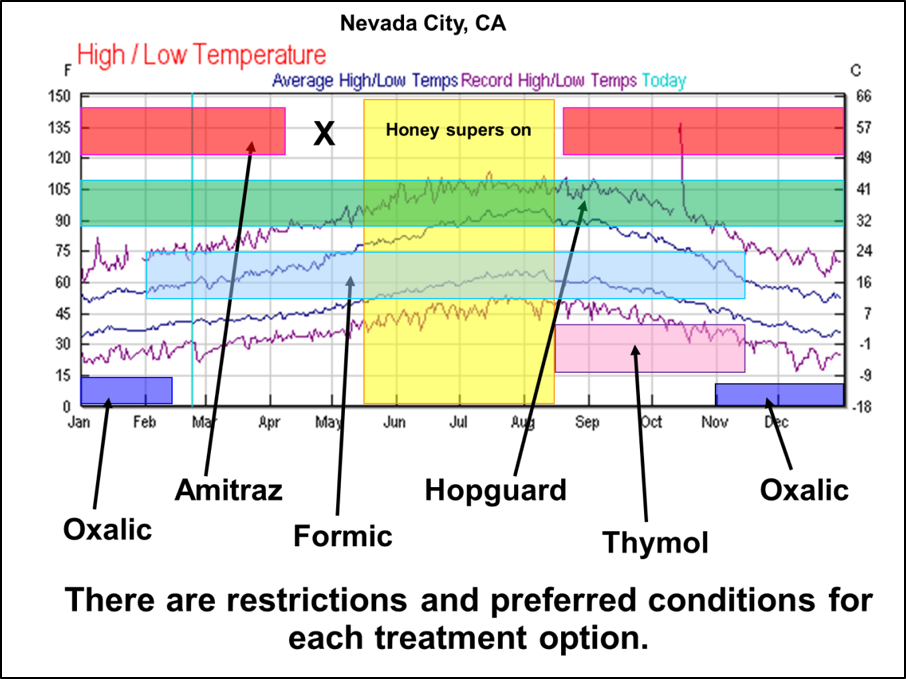
Fig. 5. There are several varroacide choices available [[3]]. But each has allowable or preferred treatment windows, based upon season, temperature, whether brood is present, and whether there is honey to be harvested on the hive. Apivar, for instance, needs to be applied 8-10 weeks before you place honey supers [[4]], and oxalic acid is only approved for use in “late fall or early spring when little or no brood is present.”
New Products on the Market
Two established companies have come out with new versions of their products (Figure 6).
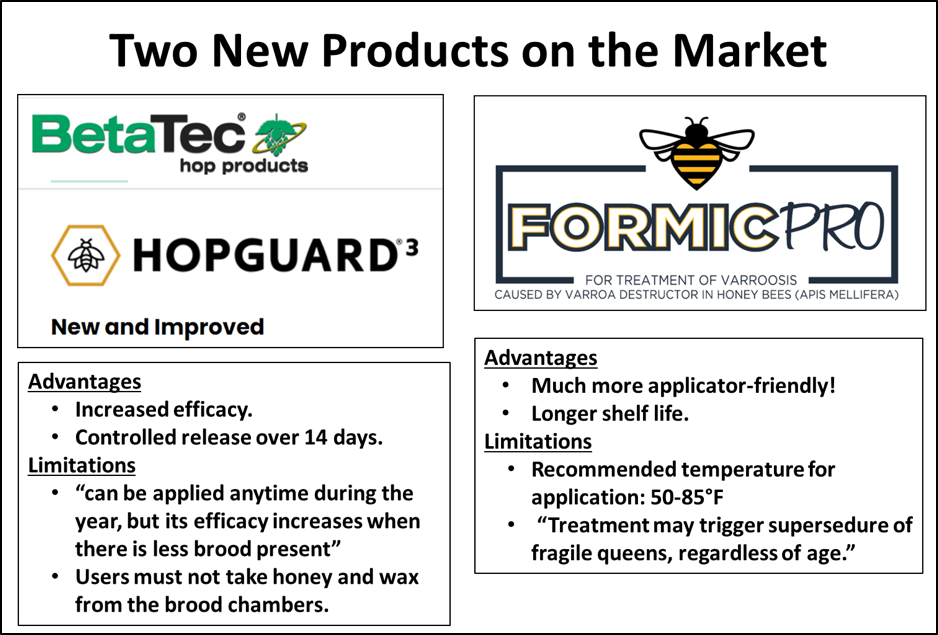
Fig. 6. The new versions of these two well-established miticides were ripe for testing. How would they perform in hot weather when brood was present?
Practical note: I find that the labels for mite control products are often confusingly written (and with typos), difficult to understand, and lacking in important information (such as the amount of active ingredient per dose). Oddly, for Formic Pro, there is no mention of any preharvest interval — the wait time between a pesticide application and when a crop (the honey) can be harvested.
Can one use oxalic acid?
The current registration for oxalic acid states: “Use only in late fall or early spring when little or no brood is present…Do not use when honey supers are in place to prevent contamination of marketable honey.” So that rules it out for application during summer. However, there is now plenty of data that oxalic acid treatment does not taint the honey – it has just not yet been submitted to the EPA in order to change the label. Even so, oxalic acid vaporization or dribble are not very efficacious when a colony contains sealed brood [[5]]. For that reason, I’ve been putting a great deal of effort in trying to figure out the best methods for applying extended-release OA in glycerin for mite control during the honey flow (hoping that we can eventually get it approved).
An Application Method in Development
I’ve published my previous investigations of extended-release OA in glycerin, using chipboard or shop towels as the delivery matrix. This season I wanted to test using a different matrix — the Swedish cellulose sponges recommended to me by several beekeepers in other countries.
Notice and Disclaimer: Let me make clear that the OA/glycerin application method is not yet approved by the EPA. I am collaborating with the Registrant (USDA-ARS), and have a Pesticide Research Authorization from the State of California for running my experiments. I publish the details of my materials and methods solely for the benefit of other researchers who have obtained experimental use permits (so that I don’t have to answer so many emails). I do not in any way suggest the use of OA/gly by other beekeepers until it is approved by the EPA.
Preparation of the OA/gly pads
For my field trials this season, I prepared application pads by cutting Swedish sponge cloths lengthwise into roughly 3½” x 8” strips, and allowed them to absorb a measured amount of a heated 1:1 w:w OA dihydrate:glycerin solution. We prepared the pads by placing 1000 g of OA dihydrate plus 1000 g of vegetable glycerin into a steam table insert [[6]]. We then heated the mixture (using a potato masher to break up the clumps) to 170°F, by which point all the OA was dissolved and the solution was clear. We then removed the pan from the heat and placed 40 sponge strips (shuffled curved sides back-to-back for better absorption) on edge into the hot solution (Figure 7).
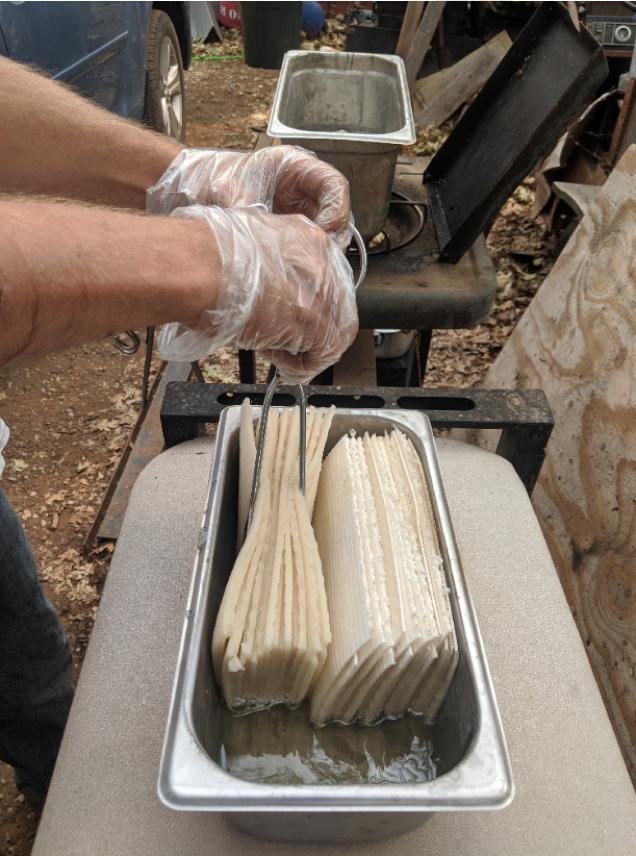
Fig. 7. Preparation of the OA/glycerin sponge pads. We tried various methods, and found this one to produce pads containing a consistent dose. This photo was taken of a primitive setup on the driveway –it would likely be better indoors with a steam table or double boiler.
Since the sponges swell to twice their starting thickness, a “third-size” insert allows room for 40 strips to fully absorb the solution. Once the solution was 2/3 of the way absorbed, we used kitchen tongs to carefully flip the strips over to absorb the last of the solution (on occasion we needed to pour remaining solution over the strips as they cooled in order to obtain full absorption). Once absorbed, the strips had consistently increased in weight by 50 g [[7]], indicating that each contained 25 g of OA dihydrate. As the strips cool, they stiffen as some of the OA recrystallizes. We placed the cooled strips in plastic food containers for transport to the apiaries.
Practical applications for other researchers: During preparation there is always the chance of a drop of solution to splash. We ALWAYS wear safety glasses. The OA/gly solution sticks to everything it touches. If it gets on your skin, there is no immediate effect, and you may not notice any burning sensation for some time, so wearing gloves and an apron are important. We keep a baking soda solution (10 heaping tablespoons/gallon) on hand (during preparation and in the field) for neutralization of hands and tools, and use it liberally.
Of interest, the bees don’t tend to chew or propolize the saturated sponge cloths as they do OA/gly applied on paper towels (Figure 8).
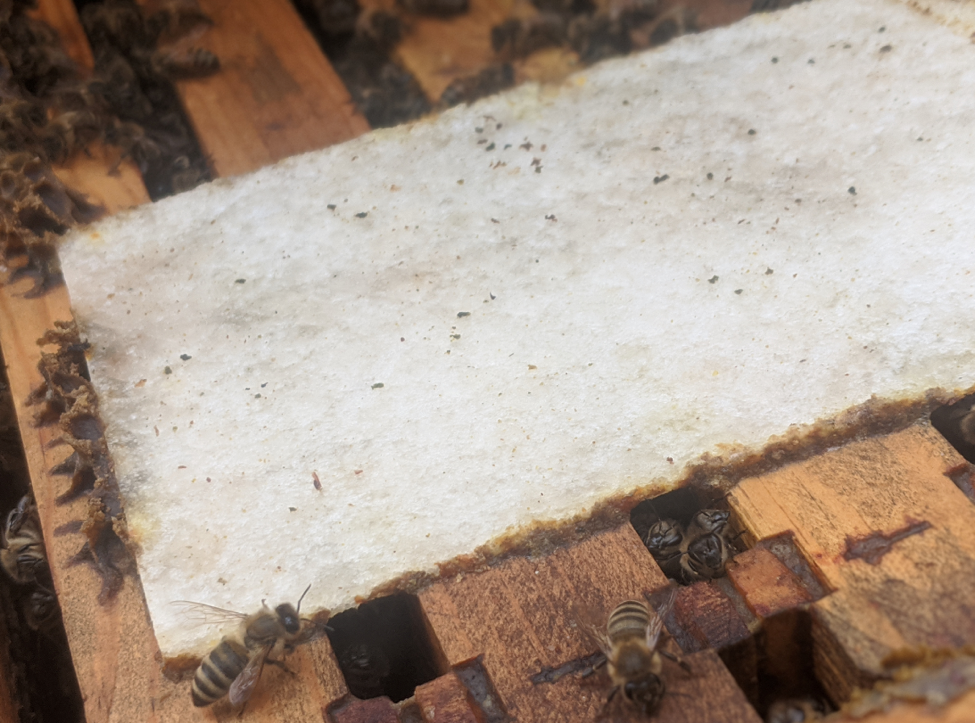
Fig. 8. Notice how the bees tend to put a ring of propolis around the edges of the OA/gly-saturated sponge cloths, but do not chew, remove, or cover them with propolis (as they do with Scott Shop Towels). The sponges do a better job of holding the solution, and often feel “wet” with the mixture even after two months or more in the hive (at least under our dry California conditions). I have not yet measured, but even then a substantial portion of the OA “dose” remains in the sponge.
Experimental Design and Setup
Starting mite levels
Since it’s hard to tease out meaningful measurements of the efficacy of mite treatments at low infestation rates, I intentionally set up this trial using a number of colonies with high mite counts (Figure 9).
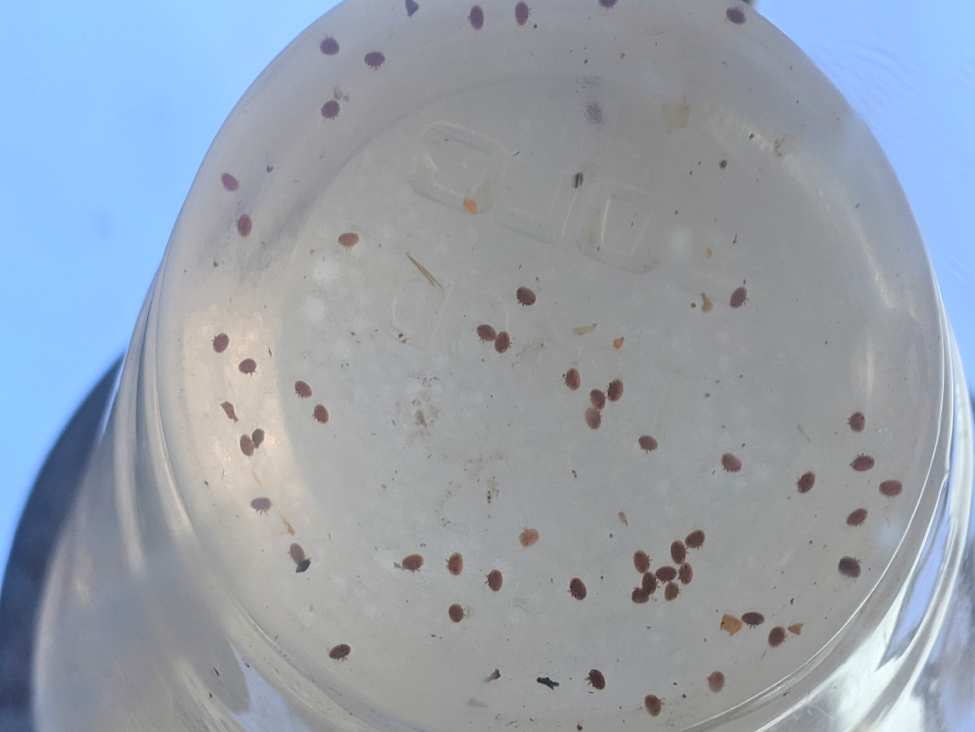
Fig. 9. You can’t learn much from a test in which mite counts go from, say, 3 to 1 (since even a single mite would account for 33% of the starting count). But you get meaningful efficacy data from counts that go from, say, 30 to 1.
The test hives
We set up the test yards with singles started from nucs containing 2nd-year queens returned from almond pollination – such colonies normally build up rapidly for us and draw a deep of foundation. We intentionally allowed the mites to build up in these hives for the trial. Frustratingly, the weather thwarted colony buildup, and by mid-June many of the colonies were still in singles, with only 8-10 frames of bees. So we added a second brood chamber to the singles (some with foundation only), and a super to the doubles, and hoped for a late flow. Although I had expected to be starting with stronger colonies, I wasn’t as concerned about honey production as I was in seeing how well the various treatments worked to bring mites under control.
Practical application: Since our test hives were generally not particularly populous, I don’t know how the findings of this trial will apply to strong hives stacked high with honey supers.
We ran the trial with hives in seven yards at different elevations and forage types (Figure 10).
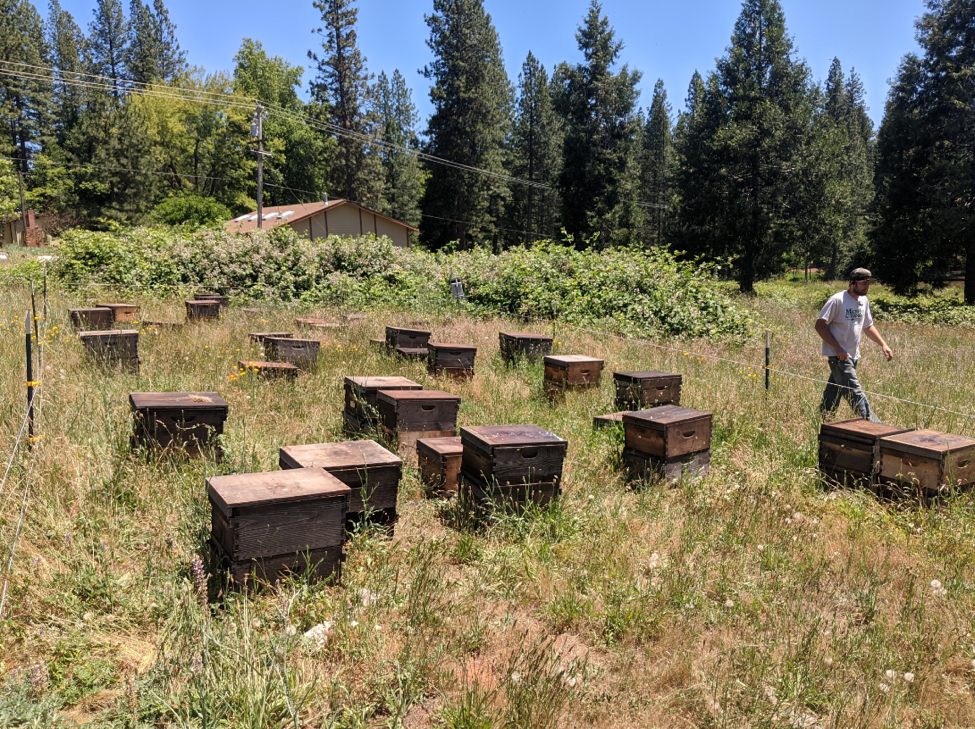
Fig. 10. A typical test yard at the start of the trial. Blackberry is nearing end of bloom in the background.
Despite the hot, dry weather, to our surprise we did experience a brief nectar and pollen flow during the latter half of the trial (Figure 11).
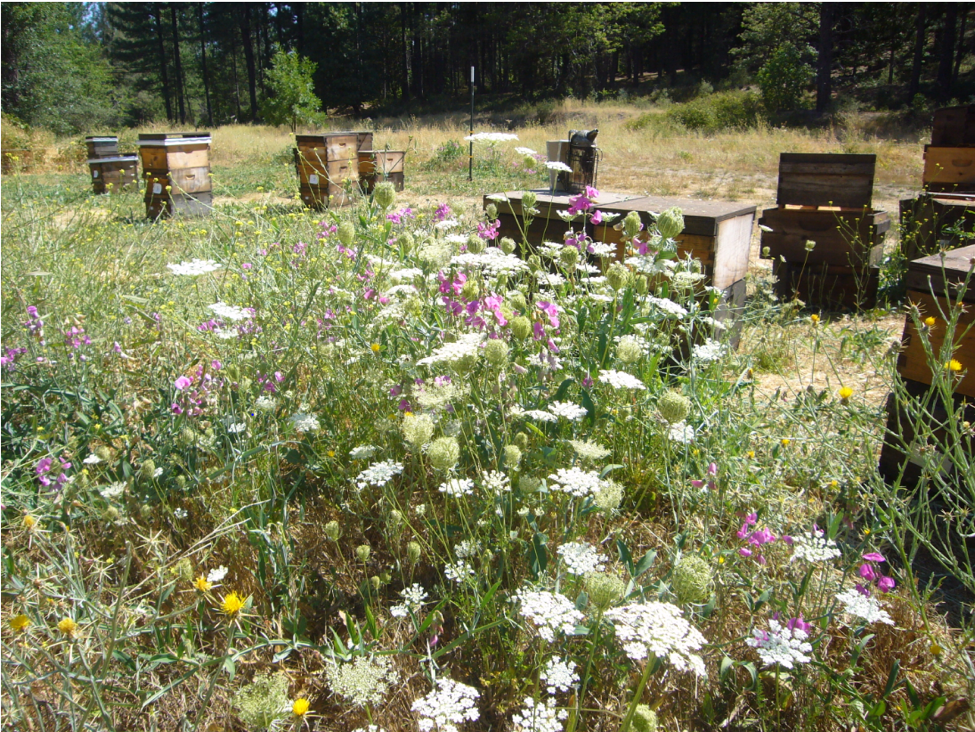
Fig. 11. Although attractive, the Queen Anne’s Lace and Everlasting Pea are of little interest to honey bees. It was the Yellow Star Thistle (left foreground) that kicked in once the temperature exceeded 95°F.
Practical application: The nectar flow was telling — strong colonies with low mite levels were able to put on around 50 lbs of honey, while those with high mite levels stagnated.
Treatment assignment
First we took mite wash counts from every hive (from a frame adjacent to brood), using mechanical agitators. Since I didn’t want any colonies to collapse from varroa/DWV before the end of the trial, I excluded hives with starting counts above 70 mites. And since I didn’t want any of the untreated Control colonies to perhaps include mite-resistant stock, or to have their mites build up to collapse level, for the Control group I only used colonies with mite counts between 10 and 20 mites per half cup of bees (roughly a 3-7% infestation level). I then assigned the remaining hives in each yard in a non-random design by blocks stratified by starting mite level [[8]]. The key parameters of the trial, and treatment assignments are summarized in the following two boxes:
| 2020 FIELD TRIAL OF VARROA TREATMENTS DURING A HONEY FLOW
· 263 hives, in 7 yards at different elevations. · Trial from 23 June – 6 August (42 days treatment duration). · Daily high temps from upper 80s to high 90sF, RH 15-30%. · All colonies starting with 2nd-year queens, 8-10 frame strength, in Langstroth deeps, with recently added second brood chambers (some with foundation only). · Intentionally wide range of starting mite levels. · Erratic weak nectar flow, fed some sugar syrup. |
The Treatments
Three of the treatments are shown in Figure 12.
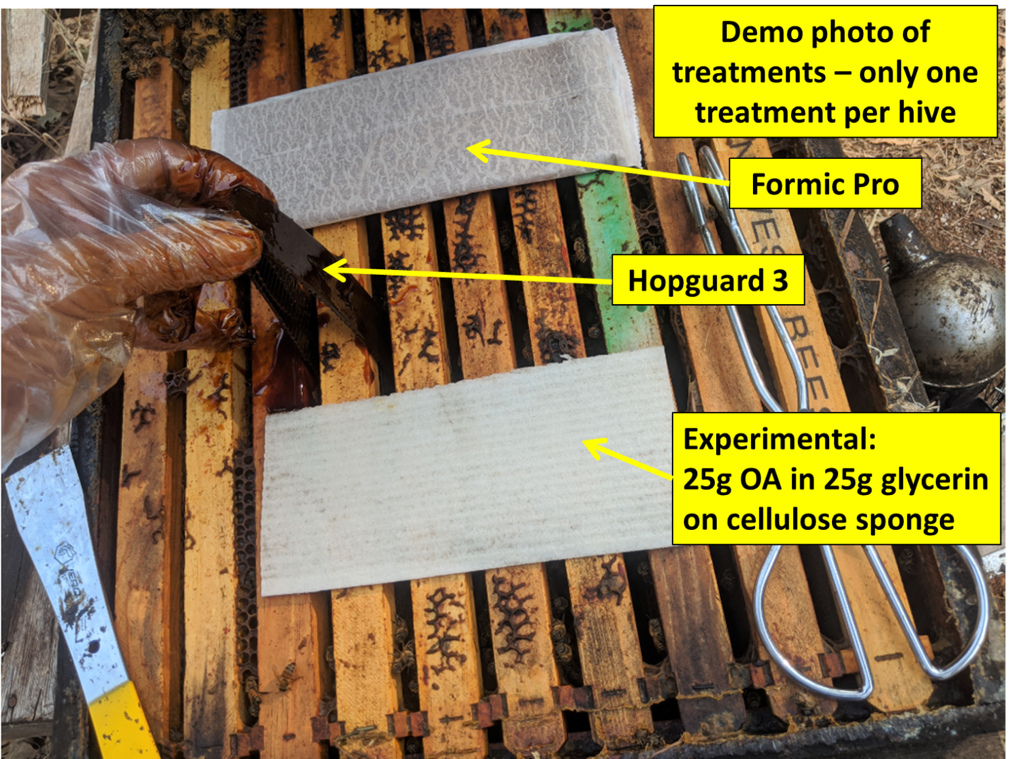
Fig. 12. This is a demonstration photo of three of the treatments to show their comparative sizes. Note the disposable polyethylene food-handling gloves [[9] ], which work nicely for Hopguard application. They are much easier to put on and off than nitrile, and cheap enough for even a penny-pinching beekeeper such as myself to discard without hesitation after use (however they are not suitable for hard work).
Practical application: The different products require different Personal Protective Equipment (PPE). For Hopguard 3, one must wear “appropriate protective eyewear, such as face shield or goggles, long sleeved shirt and long pants, waterproof gloves and shoes plus socks” (don’t forget the socks!). For Formic Pro you also “must wear coveralls over a long-sleeved shirt,” and “acid resistant gloves (PVC, neoprene, or nitrile).” The current EPA label for oxalic acid dribble is ridiculously excessive in its requirements, requiring > 14-mil chemical-resistant gloves, plus a “half-face respirator with cartridge and/or particulate filter” (for a chemical that does not evaporate, and only a minor irritant to the skin).
Not shown is the Shop Towel treatment, which can be viewed at [[10]].
All treatments were applied according to label instructions, with most Hopguard hives receiving two strips, but those with any cluster in the upper hive body receiving three. The Formic Pro strips were applied during the day at temperatures above label recommendations, with the single-strip application repeated at 10 days.
Experimental note: I intentionally ran this trial during hot weather (Figure 13), since I wanted to test the treatments under California summer conditions. I also intentionally used 2nd-year queens, since I wanted to see how well they survived formic acid application via Formic Pro strips in hot weather.
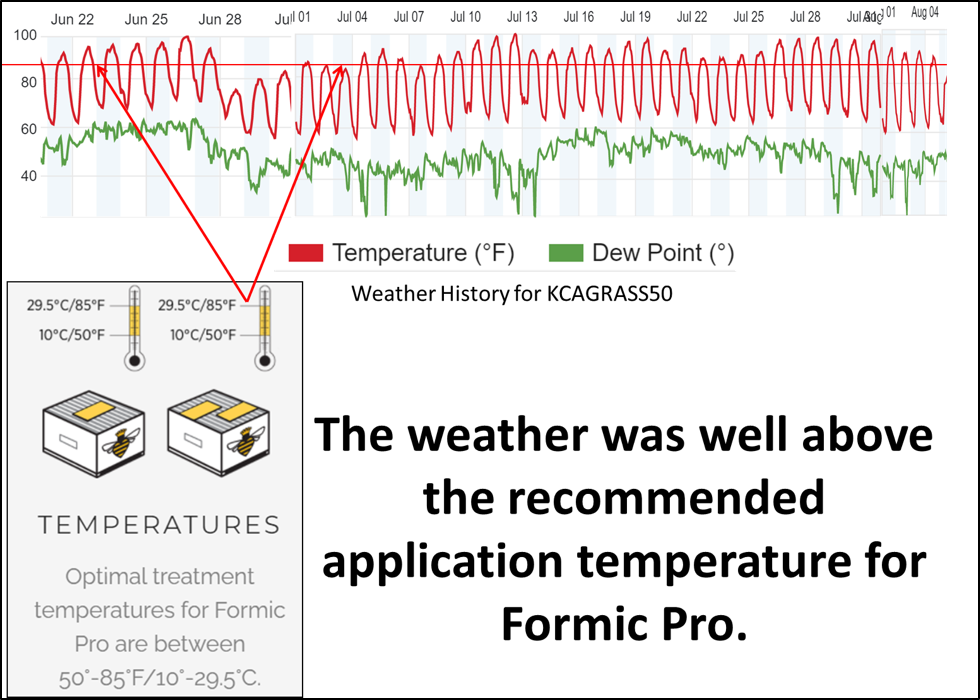
Fig. 13. Many beekeepers are concerned about applying formic acid during hot weather. So I put the colonies and their queens through the “acid test” by applying the treatment when the temperature was above the recommended high limit (horizontal red line; application days indicated by red arrows), and then monitored the colonies for queen condition and overall recovery.
Monitoring
We applied all treatments on 23 June, and checked selected representative strong hives for each treatment in each yard for midpoint mite counts on 12-15 July (at which point I also started checking for queen condition in the formic-treated hives). Final mite counts and queen check were performed on 4-5 August. I also performed follow-up 72-day counts on some of the OA-treated hives.
Results
I’m out of space, so will continue next month.
Notes and Citations
[1] https://scientificbeekeeping.com/randys-varroa-model/
[2] The big drop in mites during November is from the loss of those riding on summer bees exiting the hive and not returning, coupled with reduced reproduction in the diminishing broodnest.
[3] Here’s the breakdown of products currently registered for use in the U.S. or Canada. Details for use of each one available at https://honeybeehealthcoalition.org/wp-content/uploads/2018/06/HBHC-Guide_Varroa_Interactive_7thEdition_June2018.pdf
Synthetic Chemicals
Apivar® (amitraz)
Apistan® (fluvalinate)
CheckMite+® (coumaphos)
Essential Oils
Apiguard® or Thymovar® (Canada only) (thymol)
ApiLife Var® (thymol + eucalyptol, menthol, and camphor)
Organic Acids
Mite-Away Quick Strips® and Formic Pro™ (formic acid)
Formic Acid 65% (only in Canada)
Oxalic Acid
HopGuard® II and 3 (hops beta acids
[4] Since it takes 6-8 weeks to reach full efficacy, and the strips must be removed at least two weeks before placing on honey supers.
[5] https://scientificbeekeeping.com/extended-release-oxalic-acid-progress-report-4/ See Fig. 12.
[6] Winco SPT4 1/3 Size Pan, 4-Inch,Stainless Steel,Medium.
[7] Confirmed by weighing samples after preparing them.
[8] I used a non-randomized block design to assign treatments so that each stratum of starting mite level was tested in each yard by each treatment (i.e., the seven hives with the highest mite counts in that yard each got assigned a different treatment, and so forth down the line).
A statistician would argue that I should have randomized each block, but I wanted to ensure that the highest-mite hives in each block received an OA/glycerin treatment, so assigned the treatments for each block in order of the list in the “Treatments Tested” box. When I got down to colonies with trivial mite counts, I assigned them a single OA/gly treatment (since my main interest was to see how this treatment would perform). Only as an afterthought did I include a treatment with two OA/gly shop towels for comparison to last year’s field trial, arbitrarily replacing two treatments at midrange mite levels in each yard. I’ll be the first to say that the treatment assignment could have been better.
[9] Kleen Chef disposable food handling long cuff polyethylene gloves.
[10] See Figure 1 at https://scientificbeekeeping.com/extended-release-oxalic-acid-progress-report-2019/


