
Selective Breeding Progress Report 2023

December 30, 2023
Selective Breeding Progress Report 2023
Randy Oliver
ScientificBeekeeping.com
First published in ABJ September 2023
In 2017 I proposed a simplified method for commercial queen breeders to select for varroa-resistant stock, and then undertook a demonstration project to see if it would work. After six years of strong selection, we appear to be making substantial progress!
In 2017 I published the article “Bee Breeding for Dummies,” [[1]] lamenting that we’d been battling varroa for over three decades, yet most queen producers were still not offering mite-resistant stock. I described “Randy’s K.I.S.S. Recipe For Commercial Queen Producers,” and followed up in 2018 with “Selective Breeding for Mite Resistance: 1000 hives, 100 hours,” [[2]] in which I kept track of the amount of labor involved, the costs, and an evaluation of our results during the first year.
The Premise for Selective Breeding
Selective breeding is a direct way to determine if a specific trait can evolve in response to selection [[3]]. I like the way that E.W. Hill [[4]] describes breeding:
The basis of genetic improvement programs in any organism is selective breeding, where individuals are chosen that are expected to have offspring with desirable properties. This is directed evolution: fitness is defined by the breeder rather than by the individual’s ability to survive and reproduce in nature.
For selective breeding to be effective, there must be genetic variation present in the population, a way of identifying individuals for selection that are likely to transmit the desired properties to the descendants, and sufficient spare reproductive capacity so that the population can be bred from only the chosen individuals. For most traits there is considerable variation at the observed or phenotypic level, thus providing plenty of selective opportunity.
The premise for our own selective breeding program for varroa resistance is based upon several things (key words in boldface):
- That in any breeding population of honey bees, there are likely a few colonies in each generation that exhibit a combination of characters (uncapping behavior, hygienic pupal removal, grooming or biting, variations in their pheromones, social apoptosis, etc.) that in combination, confer the trait of “varroa resistance” upon the colony.
- That the combination of characters that confer that trait are heritable ― meaning that they can be passed to a new colony via the genetics (and epigenetics) of the queen and the sperm that she carries in her spermatheca.
- That one can identify which colonies exhibit the trait of resistance, by taking samples of a half cup of bees from a comb. Keep in mind that it’s not the queen that is resistant ― the trait is expressed at the colony level.
- That we can increase the prevalence of the trait of resistance in our breeding population by positive and/or negative selection of the queens of colonies expressing the trait of resistance (breed from those that head resistant colonies, eliminate those whose colonies show high mite levels).
Practical application: This article is mostly about my assessment of our progress, as determined by the increase in prevalence of the trait of varroa resistance in our breeding population
A Brief Description of our Methods
I am running this program as an experimental demonstration project (“walking the walk”) for the benefit of our commercial queen producers. I want to objectively see how much progress one can expect to make by using a highly-simplified “modified Bond” breeding program, in which no colonies need to be lost to varroa, and the only assessment used for the identification of breeders is mite washes [[5]].
We split all our hives into nucs when they return from almond pollination, requeening them with cells from breeders whose colonies exhibited full resistance the previous year. We apply an oxalic dribble at the brood break on Day 18 in order to start all the nucs with relatively low mite infestations.
Then in late June or July we take mite washes from every hive in our operation (which takes about 70 hours of labor per 1000 hives), identifying those that have mite counts of 0 or 1 as “potential breeders,” and treat the rest.
We then continue to sample those potential breeders over the course of the year (typically 4-5 times). Our most resistant colonies have records of 5 consecutive counts of zero (and to “make grade” must also be gentle and productive).
The next spring we then replace all of our queens with daughters grafted from larvae produced by queens that had headed colonies that kept mites to near zero for the entire year. Those virgins are then open mated with drones produced by the daughters of the previous year’s selected queens (whether their colonies exhibited resistance or not ― I’ll return to this shortcoming).
Each year I’ve published reports on our frustratingly slow progress to “fix” the trait of resistance in our breeding population.
Constraints of the Method
Our K.I.S.S. method intentionally avoids instrumental insemination, single-drone inseminations, marker-assisted selection, brood dissection, freeze-kill hygiene assessments, or tracking of bloodlines. Any of those methods could accelerate our rate of success, but again, this demonstration experiment is to determine what sort of progress we’ll make by “traditional breeding,” without those time-consuming or high-tech additions.
Another constraint is my intentional avoidance of excessive inbreeding, by not limiting our drone pool to only the drones produced by the current year’s breeder queens (which could not supply enough drones anyway), but rather by allowing the virgins to mate with drones produced by the daughters of the previous year’s queens ― all those daughters carrying the genetics of queens and drones from previous generations of selected breeders.
And we’re not just breeding for resistance ― we breed for stock that beekeepers would want to use. So we kick out any resistant colonies that are not gentle, strong, or productive.
The Low Heritability of the Trait of “Mite Resistance”
It’s relatively easy to selectively breed for color, hygienic behavior, or resistance to tracheal mite, but I have not found it so for the trait of “varroa resistance.” Mite resistance takes place at the colony level, and appears to have different alleles of multiple genes involved. A queen only supplies half the genetics of a colony, with the multiple drones that she mates with randomly supplying a mixture of different alleles.
Even after six years of intense selection, we haven’t yet seen a queen whose daughters mostly produced mite-resistant colonies. We’ve yet to “fix” the trait in any bloodline or our breeding population as a whole. This low degree of heritability [[6]] is disappointing, but that doesn’t mean that we’re not making progress.
Progress to Date
We started our program when I happened to notice “Queen Zero,” whose colony held a mite wash count of zero over the course of an entire year, without any treatments whatsoever. So at the start of our program, I’d identified 1 colony out of 1500 as exhibiting “full resistance” to varroa. So we started at 0.07% as our baseline prevalence of resistant colonies.
Since then we’ve requeened every one of our colonies each year with daughters grafted only from colonies exhibiting the ability to maintain mite wash counts at or near zero for an entire year, while surrounded with “normal” hives drifting mites into them (the potential breeders get no special treatment).
In recent years, we’ve averaged identifying around 70 “fully-resistant” colonies that have made the grade as breeders, grafting from the 30 with the best overall characteristics (this number in order to avoid bottlenecking our genetic diversity). Seventy out of 1500 works out to 4.5% — a 70x increase in the prevalence of identified fully-resistant colonies in our operation.
Have I Been Underestimating our Progress?
The key word is “identified.” In my update last year [[7]] I wrote: “I recently realized that we may have been inadvertently kicking a proportion of potentially-resistant colonies out of the program at our first mite wash assessment in June or July.” This is because I don’t know how many potentially-resistant colonies we fail to identify during the critical first round of mite washes, since we reject any colonies whose samples show more than a single mite (in a number of yards we even kick out any colonies with counts above zero). What I’ve observed is that a number of those rejected colonies are able to bring their counts back down to zero by themselves, but we wouldn’t know, since we treat them if they don’t make the cut on their first mite wash.
Not only that, but I haven’t been including the number of “moderately-resistant” colonies in my progress assessments — ones that might only need one or two treatments a year, as opposed to our normal regimen of four.
Practical application: “Mite resistance” is not a binary yes or no, but rather a range of degree. Many beekeepers would be happy with colonies that needed only a little help to fight the mite.
By luck, I had a chance this summer to investigate to what extent I’ve been underestimating our progress toward “resistant” stock ― including “overlooked resistant” and “moderately-resistant” colonies. I’ve now got revised numbers for the increase in prevalence of “resistant” colonies in our breeding population.
Tracking Rejected Colonies in their Second Year
Every February we take nearly all of our colonies to almond pollination, keeping only a few of our breeders behind (just in case something goes wrong). After return from almonds, we split all our colonies into nucs ― setting aside those queens that still made grade as potential breeders in splits (so that they don’t swarm). We requeen all our nucs with queen cells from the “best” breeders.
Later in the summer, I typically run a number of field trials to test the efficacy of various varroa treatments. For those trials, I need to use non-resistant colonies (for obvious reasons). So this spring I asked my sons, when they were splitting our hives, to save a few hundred second-year queens in nucs made with their own bees, giving them an oxalic dribble to reduce their starting infestation rates, and set them aside for me to evaluate later. They set up nine yards with those ostensibly non-resistant colonies (since they had never made the cut as potential breeders). In early June, the crew took mite wash counts to see to what degree varroa was building up in those yard (fearful that they’d be reaching dangerous levels). I sorted the results of their counts (number of mites per half cup of bees) in Table 1.
Table 1. These colonies were started in early March with splits containing the queens and bees of ostensibly non-resistant colonies that had been treated the previous season with some combination of formic, oxalic, or thymol treatments, and then given an oxalic dribble when we split them. They had by now mostly grown to 10-20 frames covered with bees (some up to 30), and their mites had been reproducing unchecked for 3 ½ months. I sorted their mite wash counts from lowest to highest, highlighting in red those colonies with dangerously high mite counts. Those high counts indicate how much the mite population could increase in non-resistant colonies over this period of time. Compare the high counts to those of the hives that still exhibited mite counts of zero to two, despite sitting in yards packed with those high-mite hives.
Interpretation

Row A (near the bottom of the table) is the count of hives in the yard.
Row B indicates the mean (arithmetical average) mite count for all the hives in that yard.
Row C indicates the median count (half the counts above, half below).
Row D shows the percentage of colonies in that yard that appear to demonstrate a substantial degree of mite resistance (exhibiting an infestation rate of less than 2%).
Bottom line: The above data really got me wondering whether I’ve been underestimating our degree of success in breeding for resistance!
Practical application: Aside from identifying potentially resistant colonies, as far as basing management decisions for treating for varroa upon monitoring via mite washes, is the difference between the mean and the median mite wash counts. From a management perspective, the median count is of more importance, since the mean mite count is skewed upward by a few non-resistant outlier hives with very high mite counts (typically around 10%, 13% red in the table above). We find it cheaper to take mite wash counts for every hive, than to waste money on unnecessary treatments. This one-time intense monitoring each season allows us to focus our attention on our “mite factory” hives.
The above data surprised me. At this point of time, out of the 496 hives above, it appeared that I’d have trouble coming up with the 250 demonstrably non-resistant colonies that I needed for my field trials! (Yes, we were laughing at ourselves for complaining about having too many hives with negligible mite counts!)
Practical application: It occurred to me that this data gave me an opportunity to estimate what the overall rate of “full to moderate” resistance was in our operation (since we sampled over 300 colonies from multiple mothers, in multiple yards).
So I allowed the mites to build up for another month. In mid-July we again took mite wash samples from four of the above yards to choose the 216 hives needed for one of my treatment trials, in order to record their starting infestation rates prior to applying the test treatments.
I arbitrarily decided to exclude any colonies exhibiting a mite wash count [[8]] that was still less than 5, since colonies with such a low rate of mite buildup after over four months of heavy brood rearing likely possessed some degree of resistance, despite not having been identified as potential breeders the year before.
Let’s first take a look at what an expected “normal” distribution (the “bell curve”) of mite counts for a yard if they evenly varied from the average. For Figure I used Excel to generate a normal distribution for 100 hives with an average count of 16 mites (similar to our actual averages per yard), and a standard deviation of 3 (to match our range of counts).

Fig. 1 This is a theoretical normal distribution — in histogram form, with each column representing the percentage of hives at each infestation level (all the columns in each graph add to 100%) — of the expected percentages of hives at each infestation level, for a yard with an average mite wash count of 16 (typical for our July counts). This shape of curve would be expected if all the colonies had the same degree of mite resistance, with random variation resulting in differences in measured mite counts [[9]].
So let’s compare the curve above to the actual distributions of mite counts for the four yards that we re-sampled in July.

Fig. 2 There was great variation in infestation rates in all the yards. Note how the curve for this yard is skewed to the left. Roughly 18% of the colonies had mite wash counts in the 0-5 range, suggesting relatively strong mite resistance, despite there being non-resistant colonies full of mites scattered within the yard.
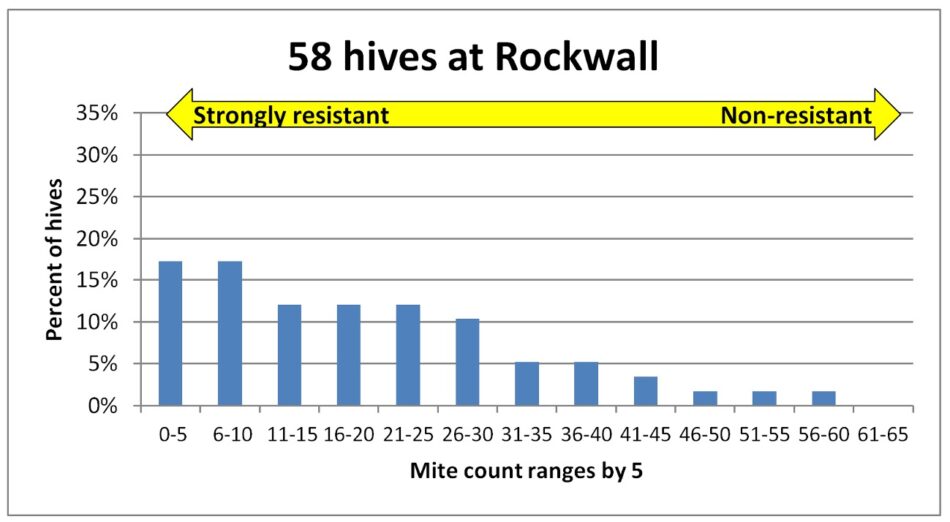
Fig. 3 The mite counts were similar in this yard, with some extreme outliers with very high infestation rates.

Fig. 4 In this larger yard, the distribution looked even more skewed toward resistance, with the majority of colonies exhibiting low counts, and around 28% suggesting strong mite resistance.
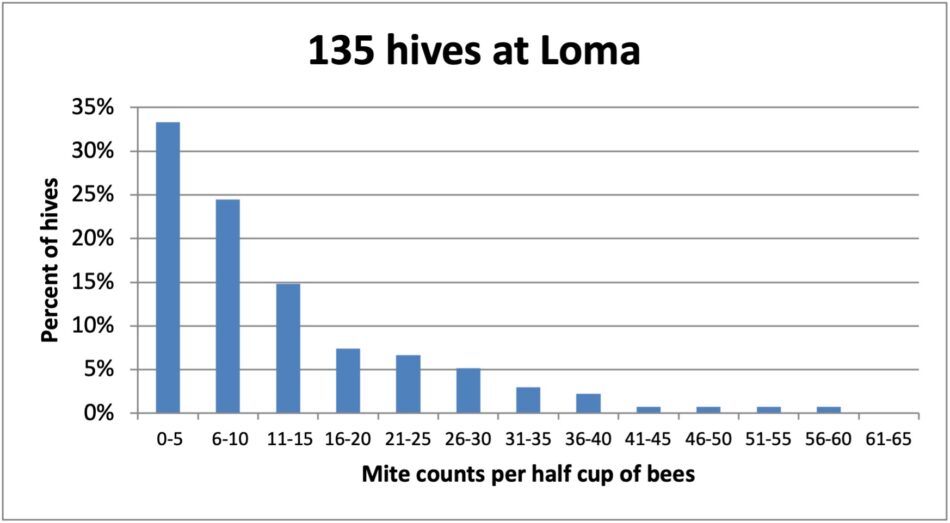
Fig. 5 Not only was this the yard with the most hives (staged from several locations). Over 30% of the colonies had mite wash counts of 5 or less, again with some clearly non-resistant “mite factories” scattered among them.
Practical application: Now add to the above figures the 4% of colonies that we’d already removed as breeders, suggesting that perhaps a third of the colonies in our operation (our breeding pool) are now exhibiting a goodly degree of mite resistance! This finding, to say the least, is very encouraging.
An Assessment of our Progress to Date
With only a third of our colonies exhibiting strong resistance, we’re not about to claim that we are yet producing mite-resistant stock — the heritability of the trait still remains low. But to chart our progress, we can compare the prevalence of resistant colonies to what we started with.
Going back to our starting baseline of perhaps a tenth of a percent of our colonies exhibiting resistance, the figures above suggest that after six years of selective breeding, we’ve increased the prevalence of mite-resistant colonies in our operation by 300x. So although slow, this is clearly progress!
Increasing the Selective Pressure
We’ve been practicing strong positive selection (breeding only from colonies able to maintain extremely low mite counts over the course of a year). We’re now going to increase negative selection ― replacing the queens of colonies that we identify with high mite counts to prevent them from adding their drones to next season’s drone pool when we mate out next year’s queens.
Wrap-up
Varroa is still our nemesis, but mite management is getting easier for us every year. Remember, we haven’t used synthetic miticides for 22 years now. My dream is that I’ll live to see the day when our bees “take care” of varroa by themselves (or with the occasional thymol or organic acid treatment).
Update
Since writing this article, we’ve taken our October mite wash counts. In some of our yards, it appears that we’re approaching 70% of the hives with mite wash counts not over 6 (less than a 2% infestation).
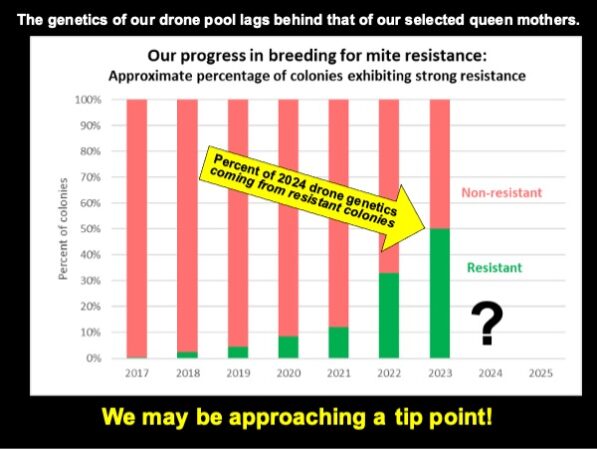
We may be finally reaching a tip point, where over 50% of our drone pool comes from resistant colonies.
We’ve been approached by our friend Ray Olivarez, who (after seeing the quality of our hives in almonds) asked whether he could sell production queens from our stock. He agreed to provide us a large isolated mating yard, which we could load with our own drone mother hives (allowing us for the first time to do so solely with resistant colonies). This is a win-win dream come true, since it may allow us to finally “fix” the genetics for mite resistance into our stock. Cross your fingers!
Disclaimer: I’m not running this program to promote our own stock, but rather to demonstrate to other commercial queen producers how to maintain a breeding program for resistant bees for their own or any other chosen stock, such as Harbo, VSH, POL line, Russian, Champlain Valley, locally-adapted ferals, or any other resistant stock (apologies if I didn’t include someone’s name). It’s time for our industry to shift to keeping mite-resistant bees!
Citations and Notes
[1] https://scientificbeekeeping.com/the-varroa-problem-part-6a/ (first published in American Bee Journal, March 2017)
[2] https://scientificbeekeeping.com/selective-breeding-for-mite-resistance-1000-hives-100-hours/#_edn1 (first published in American Bee Journal, March 2018)
[3] https://en.wikipedia.org/wiki/Selective_breeding
[4] Hill, WG (2001) https://www.sciencedirect.com/science/article/abs/pii/B0122270800011678
[5] https://scientificbeekeeping.com/the-varroa-problem-part-10/ (first published in American Bee Journal, September 2017)
[6] For a good read on the subject, see https://www.nature.com/scitable/topicpage/estimating-trait-heritability-46889/
[7] https://scientificbeekeeping.com/walking-the-walk-selective-breeding-for-mite-resistance-2022-update-part-1/#_Toc110874497 (first published in American Bee Journal, June 2022)
[8] Of a level half cup of bees, roughly 315 bees.
[9] I used a standard deviation of 3.


