


Sick Bees Part 18F9: Colony Collapse Revisited – The Bee/Pesticide Problem Complex
Sick Bees Part 18F9:
Colony Collapse Revisited – The Bee/Pesticide Problem Complex
Randy Oliver
ScientificBeekeeping.com
First Published in ABJ in January 2014
Examples Of Improved Technology
The “Bee/Pesticide Problem Complex”
Part 1
In my lifetime I’ve witnessed a wholesale shift in our attitudes toward pesticides. We’ve gone from the arrogant and unrealistic expectation that we could conquer all of our self-created “pest” problems via chemistry, to realizing that it’s a bit more complicated than that, and that we are going to have to learn to work with Nature. I came of age just as Rachel Carson published Silent Spring, which led to a complete overhaul in the way in which we regulate the poisons that we introduce into the environment. But our transition continues to be a work in progress; we still rely upon an ever evolving arsenal of toxic substances to solve our problems (our own industry being an exemplary case in point).
However, I’m heartened by the fact that society’s 21st century values are shifting toward a more sustainable model of environmental stewardship. Both industry and our government are being reluctantly dragged in that direction; none too soon for those species that are forced to eke out a living in areas of intense agriculture. The populations of many species of life, both plant and animal, are rapidly declining. Our current agricultural practices are often at odds with the needs of pollinators, which must forage in the “wild” for a safe and continuous food supply.
It is clearly time for environmental action; however, we are most effective when we base our arguments and protests upon facts and scientific data. Unfortunately, such facts are often difficult to sort from popular myths. For example, take the story of the unfortunate Chinese pear growers of Sichuan province [1] who are forced to hand pollinate their trees due to all the bees being killed off by pesticides—indeed a dreadfully grim image! In reality, this compelling story turns out to be an exaggeration of the facts, as detailed by Mark Grossman in an engrossing and thought-provoking essay [2] (I’m not going to spoil the story—read it yourself).
But I will quote excerpts from Grossman’s conclusion:
Many articles about declining bee populations have a theme and tone that reminds me of those old sci-fi movies from the 1950’s. Somehow, human technological tampering with nature is punished in some awful (and bizarre) way. You can almost read this theme between the lines of more than a few articles — an echoed suggestion that some technological tinkering has angered Mother Nature… And we are being punished by the disappearance of our bees. Then, domino-like, all of modern civilization will fall to ruins…
The inaccurate impression of the Sichuan Province as the scene of a bee extinction fits almost too neatly into an increasingly pervasive, though less than articulate, mythology — the mythology of the bee apocalypse…the mythology of our current bee die-off as divine retribution from God or Gaea, heaven or earth, conceals the actual problem by confusing it with our own most personal hopes and fears about both our technology and our future. Our bees and our agriculture — our food supply — are in real danger. This should drive us directly toward an understanding of the problem and, then, to a solution. And, most certainly, that solution will be technological and require more technology…
If we are to save our bees, we need to forget the myths and fables and remember the technology. Yes, in some way, almost every technological advance brings with it both a blessing and a curse. So, even if our technology is, in some measure, responsible for the problem of declining honeybee populations, that same technology will most certainly be the source of the solution.
The fact is that technological advances in agriculture have allowed the human population to explode. And it’s going to take more technological advances to deal with the consequences. There is no going back to “the old ways”—it is politically unpopular to allow millions of people to starve. As James McWilliams observes [3]:
Currently, there are two paradigms of agriculture being widely promoted: local and organic systems versus globalized and industrialized agriculture. Each has fervent followers and critics. Genuine discourse has broken down: You’re either with Michael Pollan or you’re with Monsanto. But neither of these paradigms, standing alone, can fully meet our needs.
So should we dismiss organic agriculture outright? Absolutely not. Organic may not be “the” solution to global food demand, but it can certainly be part of it. As Jason Clay, senior vice president of the World Wildlife Fund, writes [4], “I think we need a new kind of agriculture—kind of a third agriculture, between the big agribusiness, commercial approach to agriculture, and the lessons from organic and local systems.” With enhanced investment in agricultural research, there’s every reason to hope that organic yields will improve and that the organic model will become more prominent. The fact that we’re not yet there… doesn’t mean we should abandon the quest for agricultural systems that are both high yielding and as ecologically responsible as they can be.
Amen! By promoting a sustainable mixture of traditional practices and new technology we may be able to halt our indefensible destruction of the environment. And we are slowly making progress. The concept of agroecology is catching on, as well as integrated pest management, eco-friendly advances in biotechnology, and the development of “greener” pesticides.
Examples Of Improved Technology
It’s bad enough when one’s bees get killed by a careful application of pesticides. But it gets a beekeeper’s blood boiling when such a kill is due to carelessness or from the intentional disregard of label restrictions [5]. And this is where new robotic and GPS technology may help (Fig. 1).
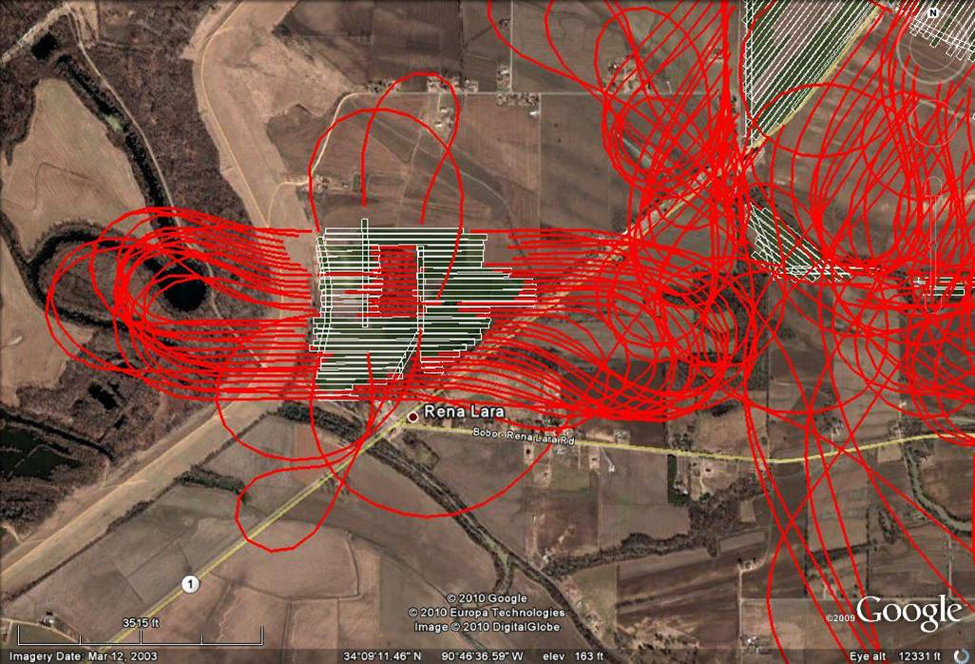
Figure 1. Beekeeper Steven Coy tells me that in Mississippi, cotton receives up to 14 aerial spraying a season! To that State Lead Agency’s credit, all aerial applications of pesticides require GPS tracking to confirm that the pesticide was applied accurately. In the image above, the red lines track the route of the applicator; the white bars where the spray valves were open. Such a record documents what actually took place! Image courtesy Tommy McDaniel, Director, Mississippi Pesticide Division.
But why stop at airplanes? Aerial applications have the great advantage of not needing to drive over the crop, are quick and relatively cheap. But most of an applied insecticide never hits its intended target insect, and any sort of wind results in pesticide drift off the field. The other problem is that pilots don’t want to fly at night, the best time to apply pesticides if one wishes to minimize their impact upon pollinators.
We now have the technology to build GPS-guided robotic sprayers that could accurately spray fields during the night, when there is little wind, and bees are safe in the hive. Such a device would allow growers to spray their orchards while they sleep [6].
This is not pie in the sky—the WeedseekerÒ is already on the market [7]. This device mounts on a tractor herbicide spray rig. It optically recognizes the difference between crop plants and weeds, and then spot sprays only the intended weeds. This reduces herbicide application by up to 90%, and, of more import to the grower, quickly pays for itself.
Despite a frenzy of protests, eco-friendly biotechnology is clearly the wave of the future [8]. Genetically-engineered crops got off to a bad start in the public’s eye due to their association with giant agribusinesses and the fact that the two flagship GM crops both have something to do with pesticides [9]. Engineered plant cultivars already in development stand to save the orange juice industry from citrus greening disease [10], and the world’s wheat production from a devastating fungus [11]—both would greatly reduce pesticide applications.
And all the major [12], and number of startup, pesticide companies are jumping on the “biorational” pesticide bandwagon. California-based Marrone Bio Innovations, Inc. produces state of the art naturally-derived biopesticides [13], including the bee-friendly insecticide GrandevoÒ and fungicide RegaliaÒ.
With all this talk of agricultural innovations, I can’t help but comment that other than the addition of motors to my vehicles and extractor, my own bee operation runs on technology that hasn’t changed since the 1850’s.
The Transition
The transition to agroecological practices won’t be easy—the chemical companies are very good at selling pesticides to farmers, and they have much larger budgets than do the extension agronomists who are doggedly attempting to promote IPM. American consumers have gotten used to cheap meat and grain, and cosmetically-perfect produce. Few farmers would willingly take the chance of losing their crop to some bug. The powerful farm lobby rewards those politicians who write the rules. I’ve come to accept that pesticides are going to be part of beekeeping for the rest of my lifetime.
A thoughtful perspective on pesticide issues can be found at [14], from which I’ll share a couple of excerpts:
…many people today think that pesticides are unacceptably dangerous to the environment or to man. Citizens want to know more about pesticides, their benefits, their risks, and the ways government regulates them. With good information, citizens are better able to analyze the arguments of both opponents and supporters of pesticide use. Pesticide policies should be formulated based on facts and reason instead of false perceptions and hysteria. Any rational approach to pesticide use should include a risk-benefit comparison…Pesticides are poisons and can be hazardous. Fortunately, research, education, and government agencies are constantly reducing the risk of using pesticides by producing “safer” chemicals, pest-specific pesticides, better application methods, and tougher pesticide laws. The result is a constantly improving risk-benefit ratio.
The above is good news for both bees and beekeepers. Beekeepers from every region tell me that pesticide issues have improved since the Bad Old Days of the 1960’s and ‘70’s. But that’s not to say that pesticides aren’t still widely applied, nor that they are not still a problem for bees in some areas. What is devilishly difficult to figure out is exactly why it is, that despite such exposure, bees can thrive in some ag areas, yet perish in others. Perhaps by carefully examining the kinds of pesticides to which bees are most exposed in each area, we can start to make some sense of it all.
The “Bee/Pesticide Problem Complex”
Although the bulk of chemicals are applied to the environmentally-devastating vast corn and soy monocultures in the Midwest, pesticides are often more of a problem for those beekeepers in other areas; such as for those being paid for pollination services, whether that be for melons in California, seed crops in Oregon, apples in New York, or pumpkins in Pennsylvania. These pollination-dependent crops are often grown in areas consisting of a patchwork of different crops, many of which are not dependent upon bees, but upon and around which one’s bees may nevertheless forage (Fig. 2).
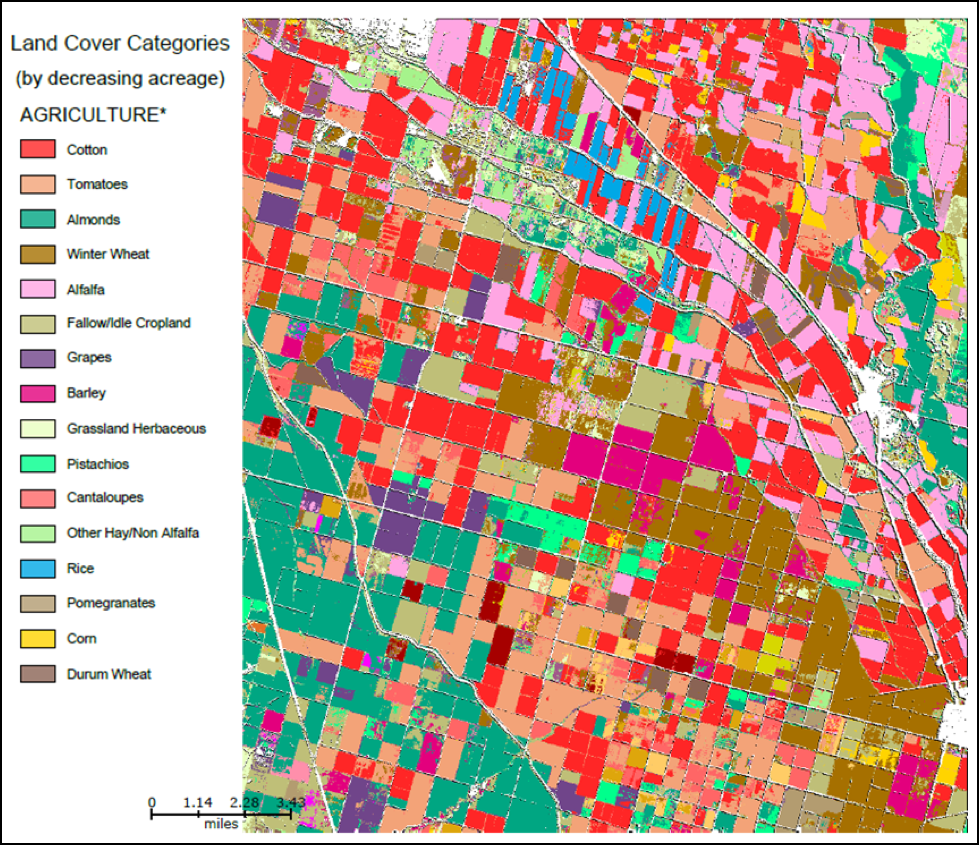
Figure 2. Look at this color-coded patchwork of different crops in California’s San Joaquin Valley. Note the scale of the map, and just how many different crops may be within flight range of any hive. When I ask beekeepers in the Valley which crops are most problematic, it is often not the crop for which they are being paid to pollinate (such as vine crops)–their bees instead get hit by pesticide applications on nearby corn, tomatoes, cotton, and alfalfa. You can download a similar map for any agricultural area from the NASS CropScape website [[i]].
[i] http://nassgeodata.gmu.edu/CropScape/
Since bees don’t pay attention to property lines, the beekeeper has no control over where his bees will actually forage. A number of times I’ve watched a grower write me a pollination check while he was watching the bees fly out of my hives and in a direction away from his orchard. Bees go wherever they get the best return on investment. If attractive flowers are blooming anywhere within flight range, then that’s where the bees will go. It is nearly impossible for the beekeeper to keep track of all the different pesticides that may be applied within that area, which could easily encompass anywhere from 12 to 50 square miles.
The result is that colonies are typically exposed to a greater diversity of pesticides than that applied to the crop upon which they are placed. The Ericksons [16] termed this stew of toxin exposure, coupled with environmental factors, “the bee/pesticide problem complex” (complex: a group or system of different things that are linked in a close or complicated way; emphasis on the word “complicated”).
The diversity of pesticides in pollen is staggering. The Fraziers [17] documented 52 pesticide residues from colonies placed on nine different crops; Pettis [18] found 35 in pollen taken from hives in 7 different crops; Stoner [19] detected well over 60 pesticides from 5 apiaries in Connecticut. An important observation is that two colonies side by side may bring back entirely different pollen loads, with different pesticide residues, none associated with the crop upon which they are placed!
And keep in mind that the Fraziers [20] found that residues may be detected to a greater extent in dead or dying bees as opposed to in the hive matrices. This finding suggests that colonies are losing their field force without leaving residues in the hive (the lesser of two evils), but suggesting that the impacts of some pesticides may be underestimated by samples taken from the combs–they found field forces to be significantly reduced in colonies pollinating cotton, corn, and alfalfa.
Dr. Jim Frazier explains that it is impossible for us to figure out how all the different combinations of pesticides interact with colony health [21], especially when we throw in any contribution from the unlabeled adjuvants, which can be even more toxic to bees than the pesticide active ingredient itself [22].
This is likely the reason that despite beekeepers clearly being able to see that colonies suffer after certain ag exposures, that no one has been able to link any specific pesticide as being the cause of colony losses (other than in the case of outright bee kills). This is of course extremely frustrating to beekeepers who want the EPA to “do something” (and to the EPA, which does want to do something!).
Pesticide Hazard Quotients
Even more frustrating to the beekeeper is that when he is given the results of pesticide analyses, all that he sees are a bunch of nearly meaningless numbers. In order to make any sense of the detect results, he must then search for published LD50 (lethal dose) figures for oral, contact, and chronic exposure (unfortunately, these figures are all over the page, depending upon who did the lab testing; the figures may be in µg/kg, ppm, nanograms/g, ppb, or ppt; and for many pesticides, published figures are either nonexistent or highly suspect). Then he must calculate/guesstimate how much nectar, pollen, or dust a bee actually consumed or to which it was exposed. I’ve done these calculations time and again—believe me, it’s a pain!
Drs. Kimberly Stoner and Brian Eitzer [23] propose that researchers save beekeepers from all that work and confusion by reporting detected concentrations not only in ppb’s, but also as “hazard quotients” [24]. This would really help the beekeeper to put the numbers into context.
The way that they calculated their Pollen Hazard Quotient (PHQ) was to take the concentration of the pesticide residue in the sample (in ppb), and then divide the result by the most appropriate available oral LD50 figure. For example, the maximum residue of phosmet in their samples was 16,556 ppb, and the published oral LD50 is 0.37 µg/bee, resulting in a pollen hazard quotient of 44,746 (they could also calculate nectar hazard quotients).
How About A More Meaningful Figure?
Unfortunately, the above figure (PHQ of 44,746) is, in my book, still just another big, scary, confusing number to the beekeeper. So let’s go a step better…
Regulatory Terms
Pesticide regulators use the term Acceptable Daily Intake (ADI) to quantify the amount of a pesticide that can be ingested daily over a lifetime without appreciable risk (they typically throw in a 10x safety factor to be on the safe side). If the concentration of that pesticide in food exceeds the ADI, then it is said to pose a “consumption hazard.” In the above study, Stoner and Eitzer not only calculated the Pollen Hazard Quotient, but also what I consider to be an even more meaningful figure—the percentage of the oral LD50 consumed per day [25]:

I suggest that we give this figure a catchy name such as the “Daily Consumption Hazard” (DCH). The DCH would be eminently simple to interpret: a DCH of 1 would mean that a bee would consume 100% of a lethal dose over the course of a day; a DCH of 0.50 would mean that it would consume 50% of a lethal dose.
For example, at the highest concentration of phosmet found in their pollen samples, the Daily Consumption Hazard would be calculated thusly [26]:

Now that’s a figure that anyone can understand! A typical nurse bee, if eating the phosmet-contaminated pollen, would be consuming an alarming 42% of the lethal oral dose of phosmet per day. This would clearly be a figure of concern to the beekeeper!
Although they didn’t use that term, the authors calculated the DCH to nurse bees for the highest detect of each pesticide found in their pollen samples (Table 1):
| Pesticide | Maximum residue (ppb) | Percentage of oral LD50 (“Daily Consumption Hazard”) |
| Phosmet | 16556 | 42.5 |
| Imidacloprid | 70 | 17.1 |
| Indoxacarb | 417 | 2.0 |
| Fibronil | 3.5 | 0.8 |
| Thiamethoxam | 4.1 | 0.8 |
| Dinotefuran | 7.6 | 0.3 |
| Chlorpyrifos | 25.2 | 0.1 |
| Diazinon | 18 | 0.1 |
| Methomyl | 24 | 0.1 |
| Dimethoate | 4.2 | 0.1 |
Table 1. The “Daily Consumption Hazard” to nurse bees consuming beebread containing the maximum residue concentrations of various pesticides in pollen samples collected over several years from 5 apiaries in Connecticut. The concentration of phosmet approached half the oral lethal dose. For most pesticides, the DCH was less than 1% of the lethal dose, so likely not of serious concern. After Stoner and Eitzen, cited above.
It is important to note that in order to save costs, the authors omitted performing analyses for two pesticides of concern—the pyrethroids and the fungicide chlorothalanil. I suspect that those two would have ranked high on the list.
Curious, I calculated Daily Consumption Hazards from the data of the aforementioned study by Pettis [[i]], in which the researchers collected beebread samples from hives placed in seven major crops. The pesticides with the highest DCH’s were, in order, the organophosphate phosmet, six different pyrethroids, followed by the neonicotinoid imidacloprid.
Note that the above rankings for toxic risk are based upon the maximum levels of residues detected, not the averages. I suspect that it is this sort of sporadic high-but-not-quite lethal exposure that may help to explain some of the colony morbidity in agricultural areas. In none of these studies did the authors mention observing overt bee kills.
Practical application: the main value to calculating Daily Consumption Hazards is that it quickly brings to our attention those pesticides that are most likely to be affecting bees due to residues in the pollen. On the other hand, it also allows us to judge which pesticide residues are not likely to be of biological significance.
Limitations of Hazard Quotients
Although readily understandable, calculations of daily consumption hazards are limited by our lack of knowledge and data. The meaningfulness of any hazard quotient is based upon any number of assumptions about the actual toxicity of a substance. It is troubling that researchers have found that, “All in all, it seems that there is no clear correlation between acute and chronic toxicity” [28]. Unfortunately, until recently, regulators have not been calling for 10-day chronic toxicity data, so we simply do not have those figures at our disposal for many pesticides [29]. Heck, for many pesticides, we don’t even have oral toxicity figures, only contact LD50’s!
- The quotients based upon residues in pollen would only apply to toxicity to nurse bees, since foragers typically do not consume pollen. For older bees we would need to calculate “nectar toxicities,” based upon feeding studies with spiked syrup. And then for nurse bees we would need to add this figure to the toxic load that they receive from their consumption of pollen.
- The quotient does not take into account environmental factors (such as temperature or humidity), colony nutritional stress, or parasite loads.
- The quotient does not automatically calculate the additive risk of pesticides with similar modes of action, such as that from any pyrethroid exposure on top of the “foundation” of fluvalinate contamination of most beeswax.
- Nor does the quotient take into account potential chemical synergies between pesticides or other toxins (including beekeeper-applied miticides). Such synergies would greatly increase the DCH of certain pesticides.
- Do not expect the actual testing labs to calculate hazard quotients, since such interpretation would by necessity be based upon the research and assumptions of others (for food consumption rates, LD50’s, and LC50’s).
Luckily, regulatory agencies across the world are adopting more stringent testing requirements for pesticides, so we will likely have better toxicity figures to work with in the future.
Wrap Up
Beekeepers are drowning in data that makes little sense to them. I commend Drs. Stoner and Eitzen for formally proposing that researchers present their pesticide residue data in a more “user-friendly” way. I feel that the most meaningful figure to beekeepers would be what I’ve termed the “Daily Consumption Hazard” (there may well be a better name), as this would let them know which pesticides in their area would most likely be affecting their bees.
In fact, that is such a good idea, that I may do so myself in the next article, in which I will look at which pesticides are applied in which parts of the U.S., and their known effects upon bees.
Acknowledgements
As always, I’m deeply indebted to my partner in the mission to get accurate scientific information to beekeepers, Pete Borst. I also appreciate James Fischer’s research skills in his posts to Bee-L. And of course, my hat is off to the scientists whom I cite, most of whom have taken the time to share their thoughts with me.
Citations and Footnotes
1 http://thebeephotographer.photoshelter.com/gallery/-/G0000M46TBQX4Odc/
3 McWilliams, JE (2011) Organic Crops Alone Can’t Feed the World. http://www.slate.com/articles/health_and_science/green_room/2011/03/organic_crops_alone_cant_feed_the_world.html
6 http://www.kgw.com/lifestyle/Robot-pesticide-sprayer-future-of-farming–219504211.html,
(Broken Link!) http://www.crophuggerreport.com/2011/02/micothon-developes-new-pesticide.html
7 (Broken Link!) http://www.cropoptics.com.au/weedseeker.html
http://www.cals.arizona.edu/pubs/general/resrpt2008/article3.pdf
8 http://www.forbes.com/forbes/2010/0301/opinions-gmos-crops-genetics-monsato-ideas-opinions.html
10 http://www.nytimes.com/2013/07/28/science/a-race-to-save-the-orange-by-altering-its-dna.html?_r=1&
11 http://www.k-state.edu/media/newsreleases/jun13/sr3562713.html
12 http://www.cropscience.bayer.com/en/Products-and-Innovation/Brands/Biologicals.aspx
1 http://www.marronebioinnovations.com/agriculture/products/, http://www.marronebioinnovations.com/biopesticides
14 Pesticide Usage in the United States: History, Benefits, Risks, and Trends http://ipm.ncsu.edu/safety/factsheets/pestuse.pdf
15 http://nassgeodata.gmu.edu/CropScape/
16 https://scientificbeekeeping.com/historical-pesticide-overview/
17 Frazier, M.T., S. Ashcraft, W. Zhu & J. Frazier (2011) – Assessing the reduction of field populations in honey bee colonies pollinating nine different crops http://www.extension.org/pages/58650/proceedings-of-the-american-bee-research-conference-2011#.UhDTZX-aucw
18 Pettis JS, et al. (2013) Crop pollination exposes honey bees to pesticides which alters their susceptibility to the gut pathogen Nosema ceranae. PLoS ONE 8(7): e70182. http://www.plosone.org/article/info%3Adoi%2F10.1371%2Fjournal.pone.0070182
19 Stoner KA, Eitzer BD (2013) Using a hazard quotient to evaluate pesticide residues detected in pollen trapped from honey bees (Apis mellifera) in Connecticut . PLoS ONE http://www.plosone.org/article/info%3Adoi%2F10.1371%2Fjournal.pone.0077550
20 Frazier, M.T., et al. (2011) Op. cit.
21 Presentation at the Monsanto Honey Bee Health Summit.
22 Mullin, CA, et al (2011) A primer on pesticide formulation ‘inerts’ and honey bees. 2011 American Bee Research Conference. http://www.extension.org/pages/58650/proceedings-of-the-american-bee-research-conference-2011#.Ulq6D1Mgvd5
23 Stoner KA, Eitzer BD (2013) Op. cit.
24 http://www.epa.gov/R5Super/ecology/erasteps/erastep2.html#hazquot
25 In the right-hand column of their Table 3, with the heading “Percentage of oral LD50.”
26 I simplified the calculation in the text. The actual calculation would be:
![]()
For the first term, I converted ppb to a rate. For the second, I used the authors’ reasonable estimate that a nurse bee would consume 9.5 mg of pollen per day, and converted the published LD50 of 0.37 µg/bee to 0.00037 mg/bee. The final resulting “Daily Consumption Hazard” is in essence the inverse of the “margin of safety,” or the Toxicity Exposure Ratio (TER)—the smaller the TER, the more toxic the exposure, approaching lethality as the TER approaches a value of 1.
27 Pettis JS, et al. (2013) Op. cit.
28 Simon-Delso, N, et al (2011) Risk assessment of pesticides on bees: evaluating risk coefficients for assessing acute and chronic toxicity. 11th International Symposium of the ICP-BR Bee Protection Group, Wageningen (The Netherlands). (Broken Link!) http://pub.jki.bund.de/index.php/JKA/article/view/1934/2310
29 What we need are figures for the chronic LC50—the lethal concentration of a pesticide in pollen or nectar that causes mortality or morbidity in 10-day feeding studies.