
Extended-Release Oxalic Acid Progress Report #5 – 2019

December 2, 2019
Contents
Could there have been mite immigration from other colonies?. 8
progression of action of treatment over time. 13
Southeastern States with high humidity. 14
What if you lay towels on the bottom boards?. 15
Question #1: is there a better delivery matrix?. 16
Question #2: How does this Compare to alternative treatments?. 18
Question #3: do we need to repeat the treatment?. 18
Question #4: Will this application method work in high humidity areas?. 19
EXTENDED-RELEASE METHOD (FOR SUMMER APPLICATION, PERMITTED WITH HONEY SUPERS ON) 19
Extended-Release Oxalic Acid Progress Report #5 -2019
First published in ABJ December 2019
Randy Oliver
ScientificBeekeeping.com
I’m working with the USDA to get an extended-release application method for oxalic acid (dissolved in glycerin) to be approved by EPA. If approved, it would give us a treatment that could be applied as we put on the honey supers, to control varroa during the critical midsummer period.
Disclaimer: I’m collaborating with the USDA-ARS to register this application method for oxalic acid, and have a Pesticide Research Authorization from the State of California. The method described here is not yet registered in the U.S. But since my research is funded by donations from beekeepers, I feel that I owe a progress report to those donors. I in no way encourage the unregistered application of any pesticide—please wait until this method is approved by the EPA and your State before using it in your own hives.
Background
Practical application: Our industry is begging for a summertime varroa treatment that can be safely and effectively applied in hot weather, while honey supers are on the hive. The two treatments currently approved for use during a honey flow are either of low efficacy when colonies contain brood (hops beta acids) or limited by summer temperatures (formic acid products).
So when in 2015, the editor of the Argentinian beekeeping journal Espacio Apicola, Fernando Esteban, brought to my attention that beekeepers there were testing an extended-release application method for oxalic acid (“OA”) — by dissolving it in glycerin and applying it on cardboard strips – I immediately experimented with it.
Results were encouraging, so I obtained a Pesticide Research Authorization from the California Department of Pesticide Regulation, and contacted the registrant of oxalic acid – the USDA – to collaborate on requesting EPA to add a generic additional application method to the existing label for oxalic acid. I thank Dr. Jay Evans for agreeing to take on this project, and Dr. Geoff Williams and Jennifer Berry for agreeing to collaborate in the high-humidity state of Georgia. Here I will only discuss my own research; my other progress reports are available online [[1]].
In 2017 I ran a field trial to collect data to present to EPA on possible adverse effects, residues in honey, and efficacy against varroa. All results were very promising in my environment. So in 2018 I dug more deeply, including running a large-scale field trial to determine the optimal ratio of OA to glycerin. Then this summer I tested what appeared to be the best formulation (when applied via Scott Shop Towels).
The 2019 field test
Last year’s results suggested that a 1:1 w:w ratio of OA to glycerin gave optimal results. So I played with the formula and found that a half roll of fully-saturated towels would absorb a heated mixture of 505 g each of OA and glycerin, resulting in easily-dispensable towels with good handling texture, that contained an 18-gram total dose of OA when two half towels were applied to a hive.
Note: the 18-g dose is solely due to the absorptive limitation of this brand of towel, and does not necessarily reflect the optimal dose (balancing efficacy vs. adverse effects), but is a dose that I’ve previously found to be effective.
We intentionally withheld spring treatments from several hundred hives in order to have high-mite colonies to test. We took starting alcohol-wash mite counts, and chose 222 double-deep strong hives in 16 different yards in the low-humidity California foothills to run in the trial (intentionally excluding abnormal or weak colonies, or any hives exhibiting extremely low or high mite counts). We immediately applied two half shop towels across the top bars, between the brood chambers as shown in Figure 1.
Update: We now prefer absorbent matrices other than shop towels, which have many disadvantages. Please refer to my more recent reports on extended-release oxalic acid.
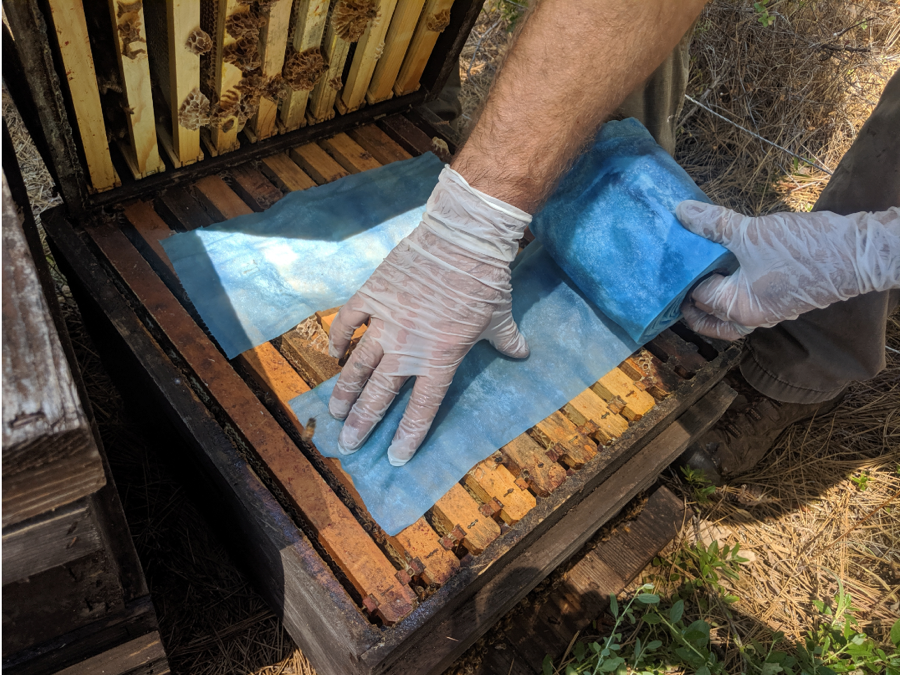
Figure 1. Towels were applied as above, with a space between them for bee movement up and down between the boxes. The trial ran from early July through early September, for roughly 60 days in each test yard.
Practical application: the towels with this 1:1 formulation were very easy to apply, since the OA crystallizes and leaves the towels with a “dry” and slightly stiff texture.
Results
I felt that box plots and mean values wouldn’t be the best way to illustrate the data to beekeepers wishing to make practical management decisions, so I’m trying something different. Here’s an introductory graph to get you used to a format that I hope may better visually present the data in a meaningful way (Fig. 2).
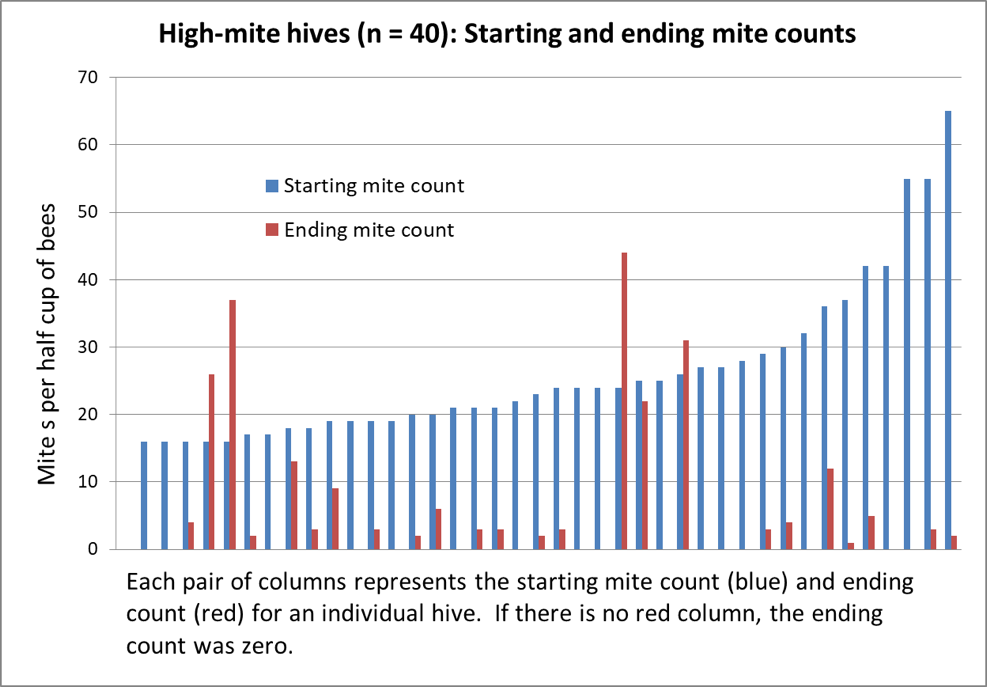
Figure 2. Above are the results from the 40 hives with the highest starting mite counts, sorted left to right by starting count. 40% of the hives wound up with counts of zero; 82% at or below the 3% infestation level. Note the surprising lack of correlation between starting and ending counts.
OK, now that you understand how to interpret this form of graph, allow me to present the data for the full 222 hives in Fig. 3.
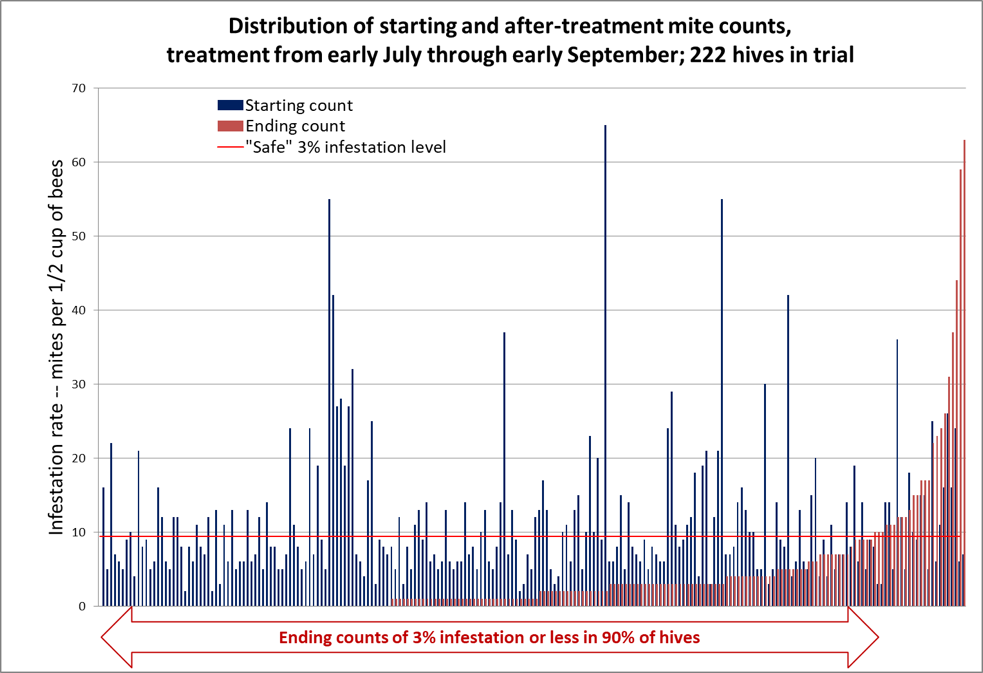
Figure 3. In the graph above, the mite counts for all 222 hives are sorted left to right by ending count after treatment (the red columns) [[2]]. The blue columns indicate each colony’s starting count, immediately to the left of its corresponding ending count. There are no red columns for the third of the colonies to the left, since they ended up with mite counts of zero, despite some of them starting with sky-high counts (note that 50% of the hives ended up with counts of either zero or 1 per half cup of bees). The horizontal red line indicates the “safe” level for varroa in late summer, to be followed by a treatment after removal of the honey supers.
The median starting mite count was 8; the median ending mite count was 1; the median reduction in mite count was 88%. Note the lack of correlation between starting and ending mite counts – many of the highest-mite hives went to counts of zero.
Practical application: my sons and I consider the results to be pretty impressive, and can see a place for this treatment in our California operation once it gets approved.
Another interesting way to look at the results would be to look at the absolute change in mite counts – by how many mites per sample the count changed in each hive (Fig. 4).
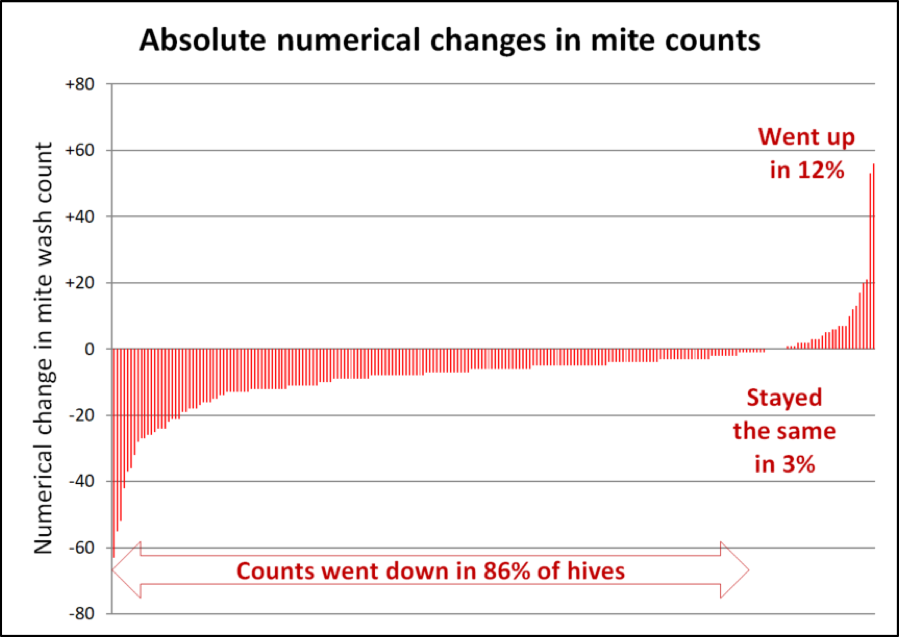
Figure 4. Note that in the hives to the far left, mite wash counts dropped by as many as 60 mites between the starting and ending counts. In 7/8ths of the hives, mite counts stayed the same or went down during a time in which they’d be expected to explode. I have no explanation for why the counts went up in an eighth of the hives.
Those danged outliers!
One consistent thing about field trials with honey bees is the inconsistency of colonies in any test group – that is, there are nearly always the danged aberrant colonies that don’t perform like the rest of their group. In a breeding program, we look for the outliers exhibiting extra-high honey production, or outstanding resistance to varroa. But when testing for the efficacy of a varroa-control product or method, there are often a few anomalous hives in which, for some reason or another, the mite population just keeps on increasing. This is one reason that I present median values rather than means (in which the outliers can greatly skew the “average”).
At Apimondia, Dr. Jim Masucci gave a fascinating presentation entitled “Lessons learned from developing an RNAi-based varroa control product.” I was involved in the early stages of this research [[3]], and spoke with him afterward. One of the frustrations that he experienced is that even in his “positive control” group — treated with the well-proven, highly-effective synthetic miticide Apivar® (amitraz) — that in a percentage of those colonies mite levels continued to rise despite being continuously treated. This is exactly what I see again and again in my own field trials.
| PRACTICAL APPLICATION: OUTLIERS AND AVERAGES
When we speak of giving a “center” or “average” value for a data set, there are three ways used to calculate it: 1. The “mean” is the arithmetical “average” that we’re all used to, where you add up all the values and then divide by “n” (the number of values). The mean is useful for calculating things such as “average” honey production per hive. The problem with means is that even a single outlier can skew the “average” to the extent that it may have little practical meaning (like the effect of one extremely high outlier mite or nosema spore count). In this trial, the mean ending mite count was 4. 2. The “median” is the middle value of a data set – with half above, half below. For practical bee management decisions, the median generally best represents the “average,” since it is barely influenced by extreme outliers. In this trial, the median ending mite count was 1. 3. The “mode” is the value that occurs most often – the most common observation. The mode may be useful for things such as “average” colony strength for a pollination contract. In this trial, the most common ending mite count – the mode – was 0. |
Practical application: I minimize the distraction from the outliers by looking at the median values of the results, and at the overall distribution curve of ending mite counts.
And this brings us to the concept of “efficacy of treatment”: meaning the comparison in mite buildup between the treated colonies and untreated controls
Overall efficacy
We included some untreated moderate-mite control hives, but their mite counts jumped so much by a midpoint check, that we treated them in order to save the hives. So although I cannot claim to have run a formal control group, of interest are the data from the untreated hives, in the same yards, that had exhibited starting counts of 0 or 1, which we then tracked as potential mite-resistant breeders. Those in which mite counts increased during the course of the trial went from a median value of less than 1 to a median count of 15 (range of 7 – 35), which would be a median 15x increase in the mite infestation rate over the course of the trial.
Although I wish to be clear that one could question whether those hives could legitimately serve as controls, when I run the Henderson-Tilton formula on the median values for mite counts, it suggests an efficacy due to the treatment in the 99% range. If instead, I use last season’s increase in the controls (5x instead of 15x), the formula still indicates an efficacy of 98%.
Practical application: so far, I have not been running a positive control group with a “known” effective miticide to which I could compare the efficacy of extended-release OA. The only two treatments that are registered for use while honey supers are on are Hopguard and formic strips [[4]]. I intend to test them next season against OA/gly.
Could there have been mite immigration from other colonies?
The question arises as to whether the increase in mite counts in the outlier hives was due to bee drift or the robbing out of collapsing hives. Serendipitously, I had been asked by a U.C. Davis grad student to supply hives for another project, which involved us placing 24 hives in each of three high-elevation (6500 ft) wet-meadow locations (Fig. 5). Before we moved the hives in, she had confirmed that the locations were free of honey bees (either naturalized or managed), since her crew had not observed any honey bees working the flora. Thus there would be no immigration of mites from hives other than my own.

Figure 5. Grad student Maureen Page was studying the impact of honey bees on the pollination of the blue Camas lilies in high-elevation wet meadows. In this photo, she’d bagged a portion of the flowers just before we placed the dark-colored hives in the background.
The placed hives included a few very-high-mite hives, which we did not include in the trial, some of which unfortunately collapsed during the course of the trial (1-2 per yard), and thus could have contributed to some mite immigration. The data for the isolated hives (which are also included in the previous graphs) is shown in Figure 6.
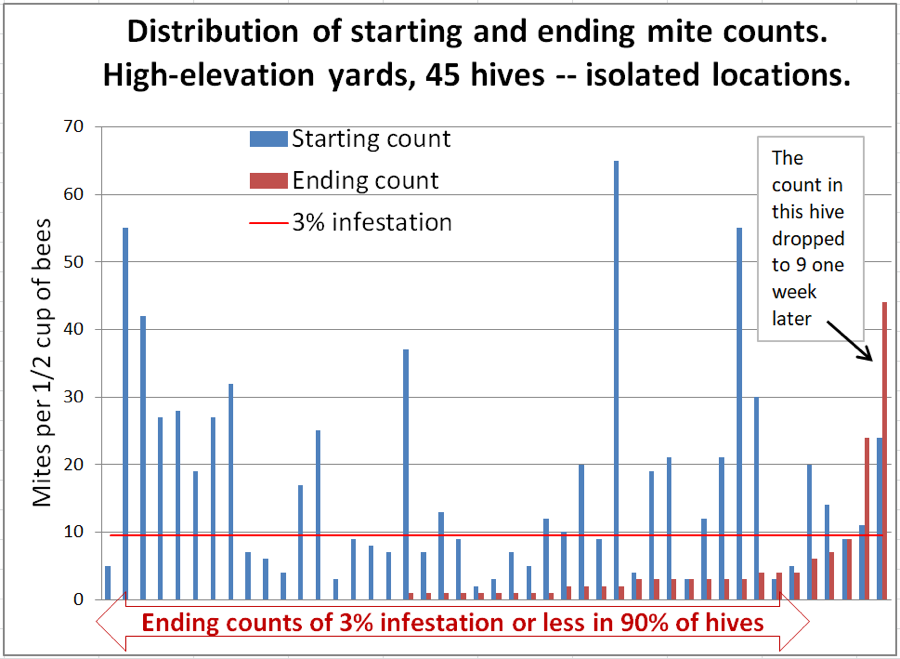
Figure 6. The high-mite outlier to the right was odd – it had quickly removed most of the applied towels. We checked the ending count twice to confirm. But then we checked it again a week later (with 6 samples to confirm)– it had dropped to a median count of 8.5 mites! But the one next to it at 22 had by then jumped to a median count of 65. Inspection indicated that its brood had all recently emerged. These high-mite outliers can apparently really jump around!
Interpretation: in this group we can rule out mite immigration from outside of each group of 24 hives. Unfortunately, there were a few colonies that did collapse from varroa, so we can’t completely rule out the possibility that they were involved. The wild fluctuation in mite count over a 1-week period in the colony exhibiting the highest ending count is certainly confounding.
Fate of the applied towels
With the 1:1formulation that I tested this year, there was large variation in how the bees dealt with the applied towels (Figs. 7-9).
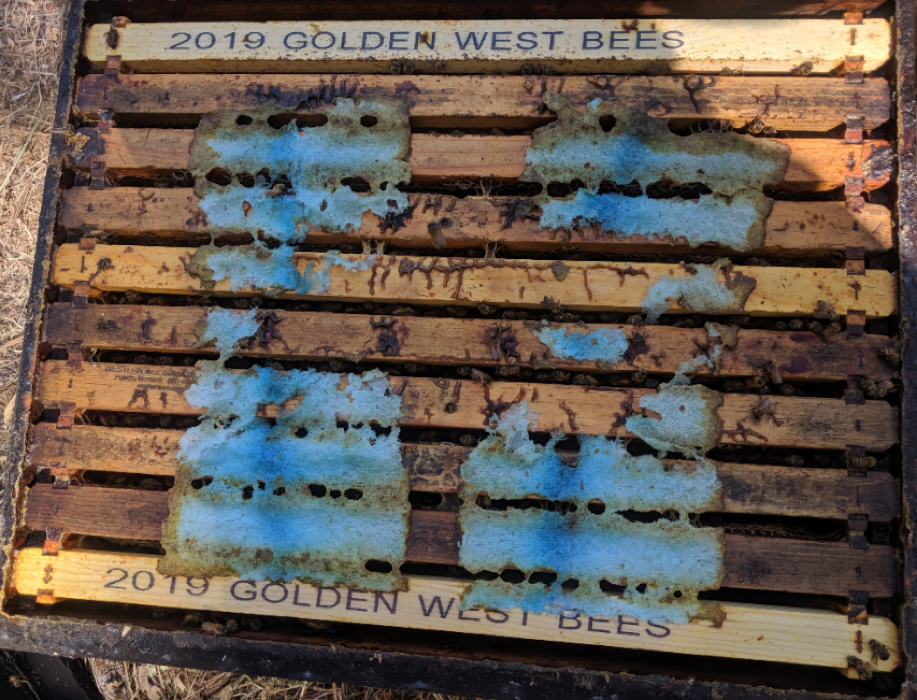
Figure 7. Most colonies removed a portion of the towels over the two month treatment. By this point in time, although the towels still clearly tasted of acid, they may no longer be dispersing enough OA to the bees to further prevent the mite counts from starting to climb again, and may call for a second application. Or perhaps I should use a higher initial dose on a matrix that is not chewed out as quickly.
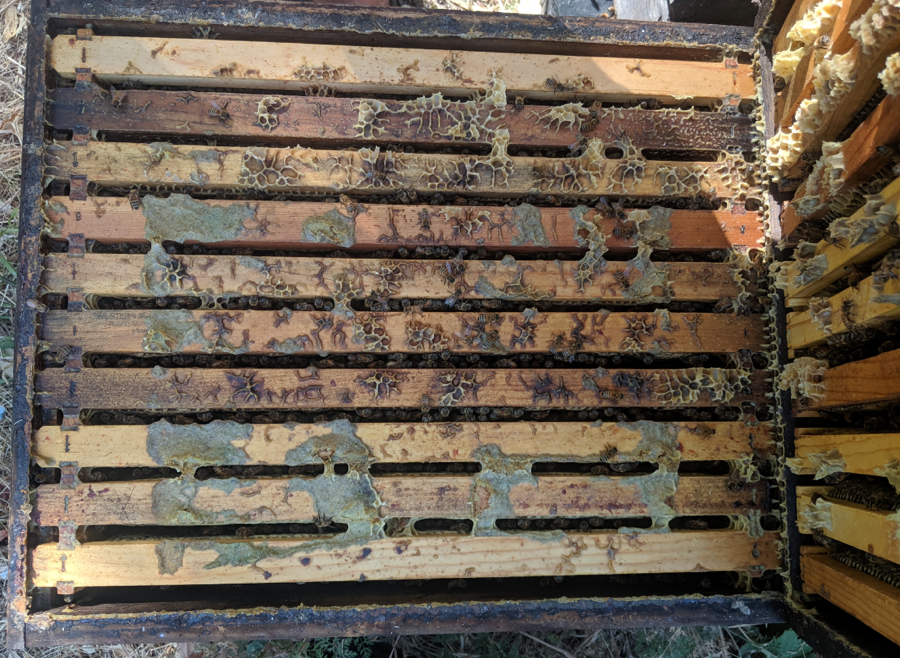
Figure 8. On the other hand, some colonies chewed out most of the towels and propolized the remainder. This may give the colony a high initial dose of OA, but very little would be being distributed later on.
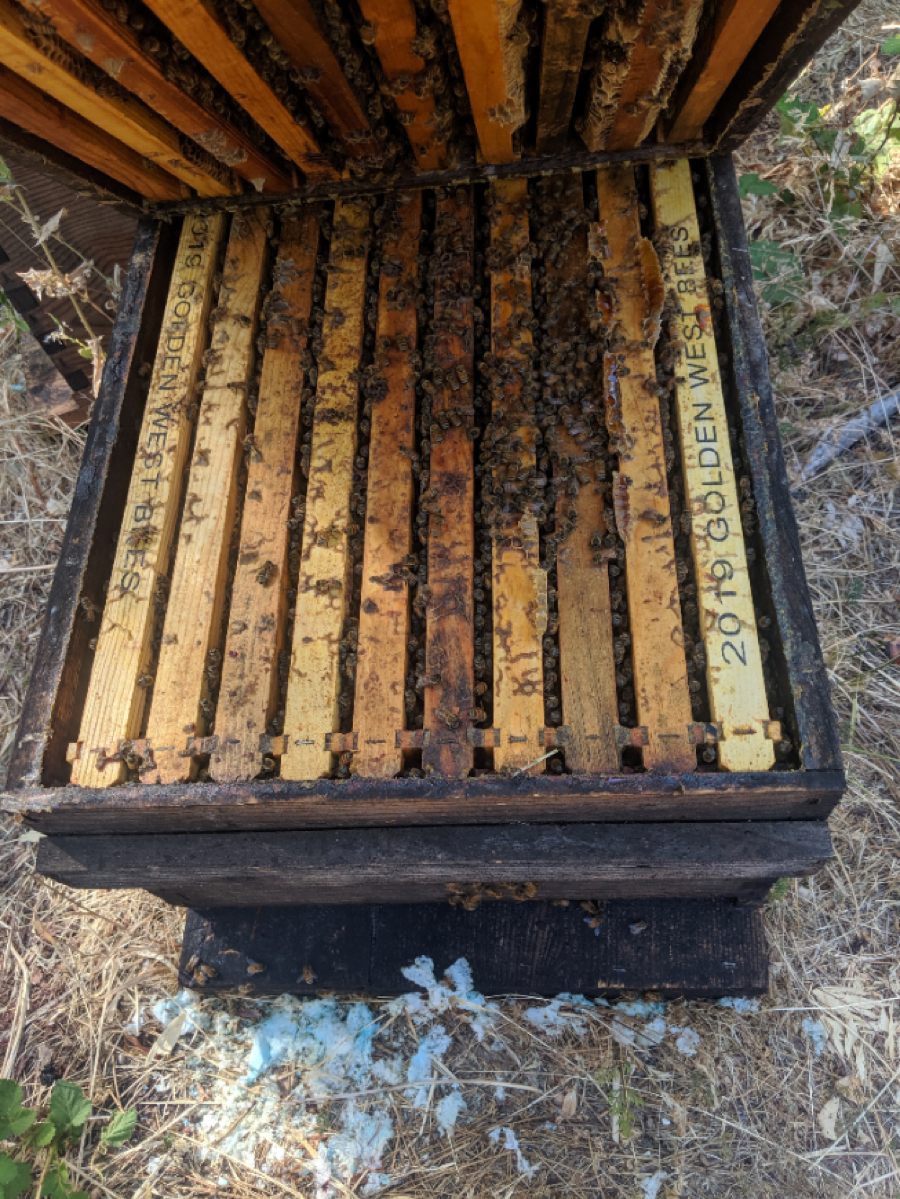
Figure 9. A few colonies quickly removed every trace of the towel from the hive; some of these did not exhibit good mite reduction.
Practical application: Shop towels may not be the ideal matrix for consistent extended distribution of OA/gly in a hive.
progression of action of treatment over time
With these large field trials, it takes a lot of time to perform mite wash counts on a weekly basis, so I haven’t done that to any great extent. Instead I simply take ending counts when it appears that we’ve reached maximum efficacy, based on spot checks. Below are the results of some of my spot checking this summer (Fig. 10).
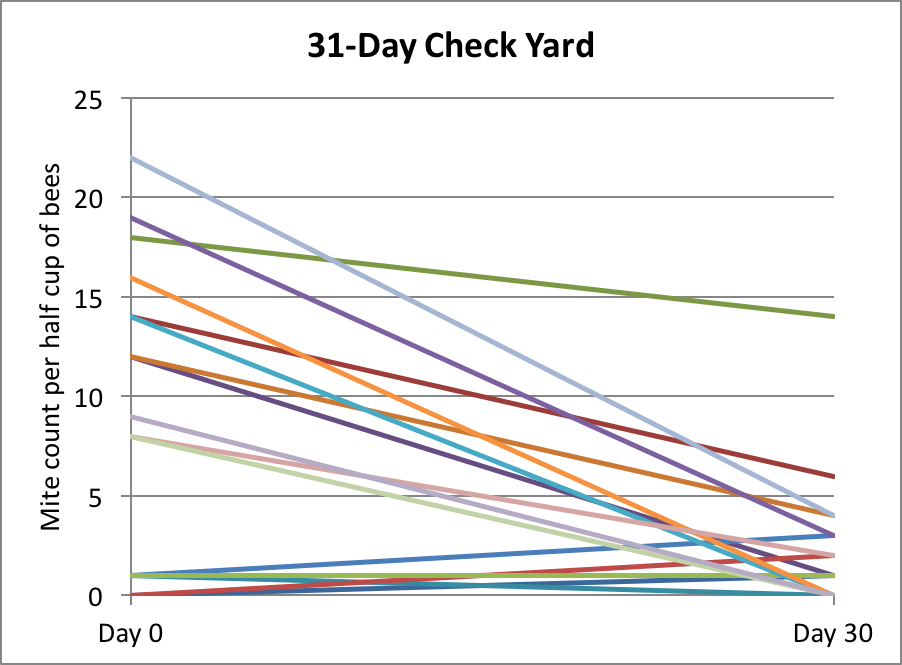
Figure 10. In this yard, we took mite counts at 31 days, but then due to a miscommunication, all the hives got treated (these counts are not included in the data sets above).
We later took spot counts at 40 days from 27 hives in various yards — the results are shown in Figure 11.
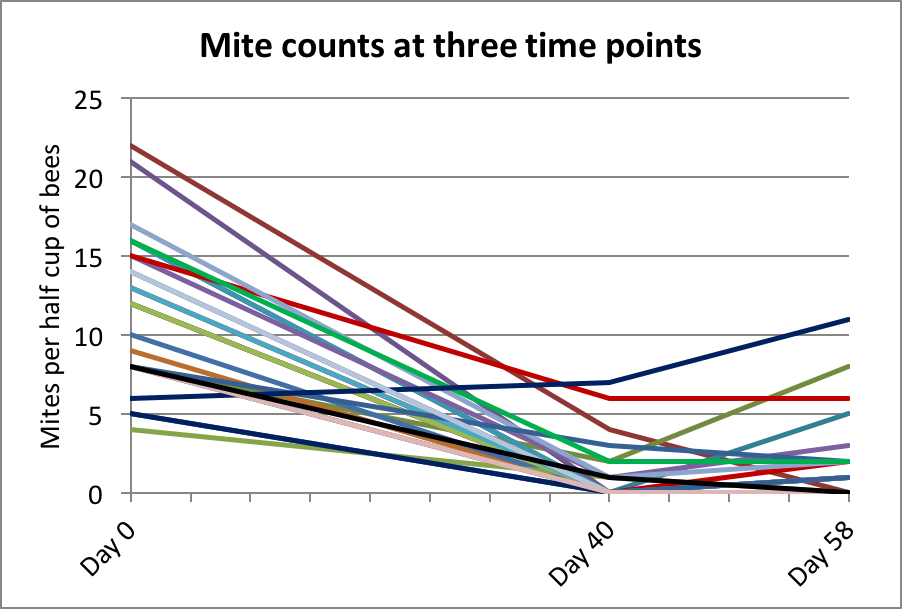
Figure 11. Since a number of counts were still above zero on Day 40, I ran the trial for around 60 days. Given the benefit of final data, it appears that at some point between 40 and 58 days the treatment resulted in the greatest mite reduction.
Practical application: Note that had I taken final counts at Day 40, that our efficacy calculation would likely have been even better. Next year, I plan to take weekly counts in a group of hives to clarify the progression of mite reduction in the hives over time.
Results from others
Mexico and uruguay
At Apimondia 2019, there were two posters of interest. In Michoacán, Mexico, Rueda, et al [[5]] tested the Shop Towel application method and calculated 87% efficacy at 94 days in the 5 hives tested. In Uruguay, Diaz-Cetti & Mendoza [[6]] using impregnated cardboard strips obtained 95% efficacy in 41 days.
Southeastern States with high humidity
Results from Georgia, Virginia, and some other states suggests that this application method may not work as well in areas with high humidity.
Quebec
A meticulous beekeeper from Quebec sent me this exemplary data sheet of his test of OA/gly towels.
| Application time: nest in expansion, before the main nectar flow | |||
| Two half towels between the two brood chambers | |||
| 505 g OA + 400 mL glycerin | |||
| One stationary beeyard (average queen age : 2 years) | |||
| Varroa Mite Count (number/300 bees) | |||
| Initial count | Final count | ||
| Hive | June 7 | Jul 26 | Notes |
| 1 | 0 | 0 | Sick, chalk brood |
| 2 | 1 | 0 | Very strong |
| 3 | 0 | 0 | Weak, supersedure |
| 4 | 2 | 0 | Weak, supersedure |
| 5 | 2 | 2 | Strong |
| 6 | 0 | 1 | Strong |
| 7 | 4 | 1 | Strong |
| 8 | 1 | 2 | Extra propolis |
| 9 | 2 | 2 | Very strong |
| 11 | 1 | 2 | Young queen |
| 12 | 1 | 0 | Sick, chalk brood |
| 13 | 1 | 0 | Strong |
A request: I am happy to receive data on this application method from beekeepers over the world (of course only if you have an experimental permit), especially since I’m curious as to whether humidity is a factor. Please send data in a format similar to that above, which clearly explains exactly what you did on what dates, and has the data clearly organized and labeled.
What if you lay towels on the bottom boards?
A beekeeper asked me what would happen if I simply laid OA/gly towels on the bottom board. There were a couple of high-mite hives sitting next to my house, so I did so (Figure 12).
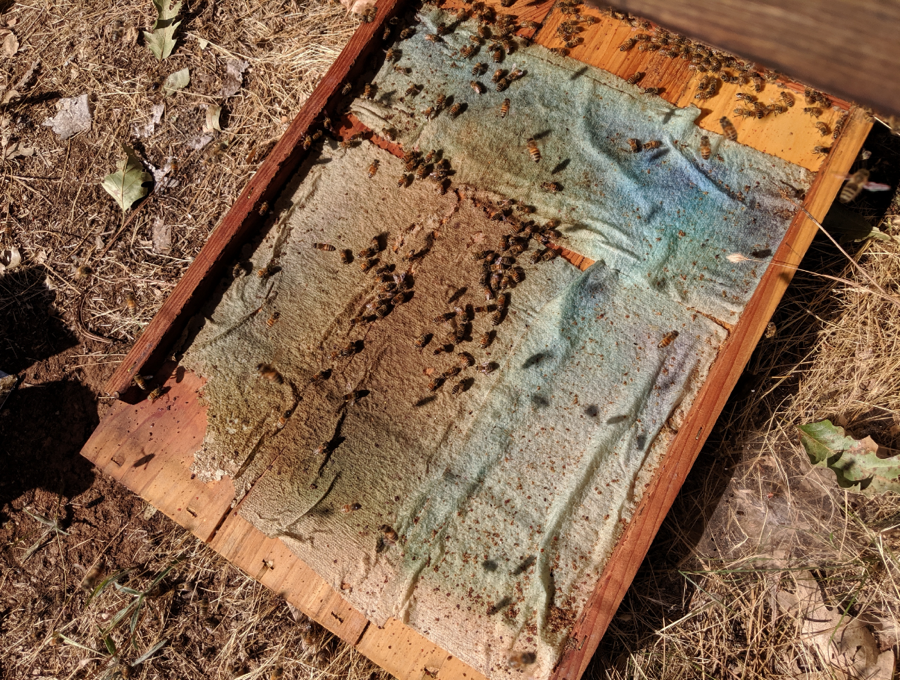 Figure 12. I covered the bottom boards of two hives with towels for a quickie test in order to see whether simply exposing the bees’ feet to the towels would result in any mite control. The towels looked like this after the 68-day treatment (you can certainly see the main travel path).
Surprisingly, this 2-hive test indicated that even this small amount of exposure to only one side of OA/gly towels may be enough to obtain some degree of mite control (Table 1).
| Table 1. Results from a single layer of towels laid on the bottom board. | ||
| Mite counts | ||
| Hive | 29-Jun | 5-Sep |
| A | 11 | 13 |
| B | 17 | 9 |
Questions Remaining:
I’m not trying to sell a product, and have limited funding from the beekeepers who support my research, so I can only test a few things each year. We’re going at this step by step, learning as we go. That said, I’ve discussed with my collaborators a number of questions that we need to address before this application method is ready to roll.
Question #1: is there a better delivery matrix?
My sons and I felt that using the chipboard strip method of application was too time consuming, and required an excessive dose of OA. My initial testing of saturated chipboard across the top bars suggested that I should use a different matrix. I chose to work with Scott Shop Towels due to commercial beekeeper familiarity with the towels, their low cost, ease of preparation and application, the fact that bees readily chew and remove them from the hive, and their biodegradability.
I’m not in any way stuck on shop towels – there may be other matrices that hold a larger dose, that disperse the OA over a longer period of time, or that are more easily removable after treatment. I do prefer a biodegradable matrix. I’m looking for a matrix that will deliver more than the 18 g maximum that a shop towel can hold. It would also be nice if the matrix was easier to remove from the hive after it had done its work.
A beekeeper from Europe suggested cellulose kitchen sponge cloths made in Sweden (Fig. 13).
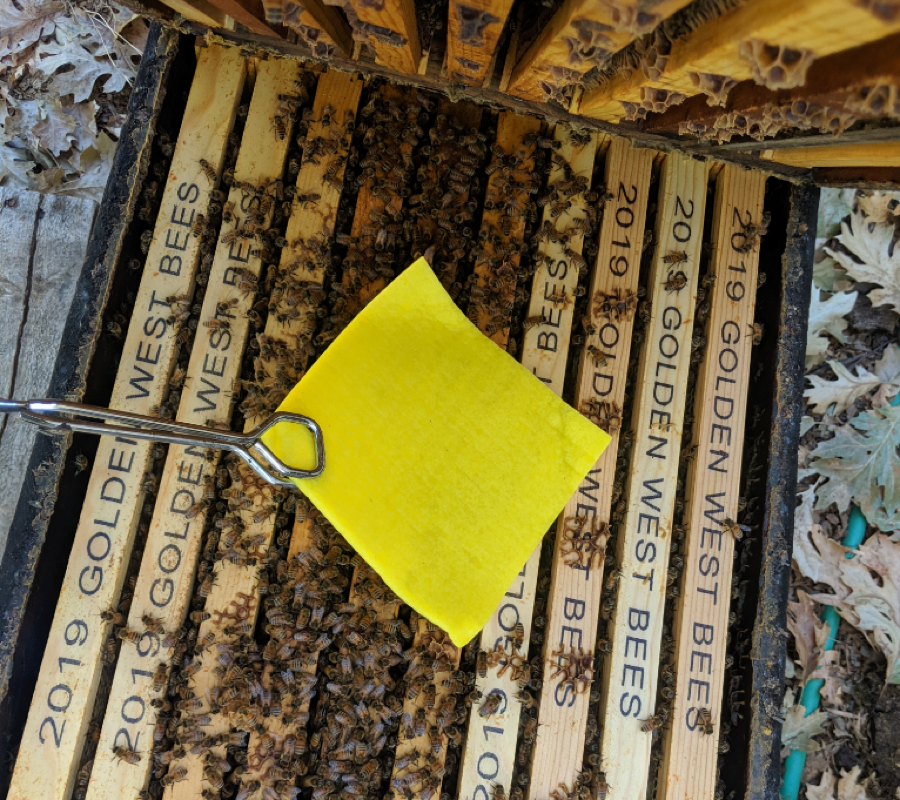
Figure 13. I was able to find two brands of these cellulose sponge cloths online [[7]]. Compared to a shop towel, which can hold 18 g of OA, one of them holds 40 g (another brand 51 g). I’m currently running a late-season test in 5 hives.
I just ran out to give a quick check at 25 days after application, and these sponges look very promising (Fig. 14).

Figure 14. At 25 days after application, you can see enough dead mites to warm the heart of any beekeeper, and the little ring of propolis around the sponge. I’m impressed by the liquidity and strength of the OA/gly solution remaining in the sponge, and the ease with which the towel could still be removed from the top bars in one piece.
Update: I fed each hive a couple of pounds of pollen sub at the midpoint check to encourage continuation of broodrearing, so that I could check for adverse effects due to treatment. I took final alcohol wash mite counts for the hives at 51 days after applying the sponges. Mite reduction looked pretty good. So did colony strength and the health of the brood. Here’s the data:

The above sponge would bump the cost of a treatment up by a dollar, but the savings in labor, and greater dose of OA may well be worth it. I’m excited to test them next season.
Question #2: How does this Compare to alternative treatments?
We need to run positive controls of the two approved treatments for when honey supers are on: Hopguard and Formic Pro® strips. We can then compare efficacies and outliers to the OA/gly treatments.
Question #3: do we need to repeat the treatment?
We may not need to do so if we use something like the sponges. For any test, we should track mite infestation rates of at least some colonies on a weekly basis to see how long the matrix sustains OA delivery.
Question #4: Will this application method work in high humidity areas?
Glycerin is highly hygroscopic, meaning that it absorbs moisture out of the air. This may be an issue in areas of high humidity. I’m hoping to find additional collaborators to test it under those conditions.
Wrap up
I have no financial interest in registering this application method, but see its great potential to fill a current hole in our mite management strategy – at least in California. I’m hoping that we can convince EPA to add an additional approved application method to the OA label something like this:
EXTENDED-RELEASE METHOD (FOR SUMMER APPLICATION, PERMITTED WITH HONEY SUPERS ON)
Add equal weights of Oxalic Acid Dihydrate and vegetable glycerin into a saucepan, Place over heat and stir constantly to dissolve the acid crystals completely, being careful not to exceed a temperature of 160°F (71°C) (above which the solution will start to form bubbles).
To the heated solution, add precut cellulose towels, sponges, chipboard strips, or similar carrier matrix to absorb the solution. Then allow the carrier to drip dry.
I updated a typo in the following sentence (8 Feb 2020) — thanks to beekeeper Rex Roberton for pointing it out!
Apply not more than 50 g [[8]] oxalic acid dihydrate in saturated carrier to the lower brood box. The towels, sponges, or strips can be laid across, or hung over the top bars. The treatment must be separated by at least one chamber from any honey to be extracted.
Full efficacy is not obtained until roughly 40 days. The application may be repeated once per season.
This is a work in progress, and I thank California DPR, Jay Evans at USDA, Jennifer Berry and Geoff Williams, and the EPA for collaborating. I also thank beekeepers throughout the world for their own test results (assuming of course that they obtained permission from their local regulatory agency). My own research is funded by donations from beekeepers — I thank you all.
Practical application: in our commercial operation, achieving 98% efficacy in preventing mite counts from building up during the honey flow makes us very happy. And this for a treatment that is very safe to handle, takes seconds to apply, and does not contaminate the honey or beeswax. The cost would be about 32¢ per dose via shop towel (not counting the labor involved in preparation), or $1.30 with the cellulose sponges (which are easier to prepare and apply). In case you haven’t guessed by now, I’m pretty excited about this method, but feel that we have at least another year of testing before we’re ready to submit to EPA.
References
[1] https://scientificbeekeeping.com/beyond-taktic/
https://scientificbeekeeping.com/extended-release-oxalic-acid-progress-report-2/
https://scientificbeekeeping.com/extended-release-oxalic-acid-progress-report-3/
https://scientificbeekeeping.com/extended-release-oxalic-acid-progress-report-4/
[2] There are fewer than 222 columns, since some mite counts overlapped, which results in some of the columns being darker than others.
[3] I worked with Beeologics on the early development of RNAi products before they were purchased by Monsanto, and later by Bayer. https://scientificbeekeeping.com/sick-bees-part-2-a-model-of-colony-collapse/
[4] MiteAway Quick Strips or Formic Pro.
[5] Rueda, H, et al (2019) Evaluation of two methods of treatment with oxalic acid for the control of Varroa destructor in honey bee colonies Apis mellifera L. Poster at Apimondia 2019
[6] Diaz-Cetti, S & Y Mendoza (2019) Control of Varroa destructor by oxalic acid in cardboard strips. Poster at Apimondia 2019
[7] Amazon: “Sponge Cloth, Swedish Dishcloth, Cellulose, Reusable, 10-sponges in Pack.”
[8] The suggested 50-g limit is subject to further field research.


