
Selective Breeding for Mite Resistance: 1000 hives, 100 hours

October 27, 2018
Contents
First assessment—early July. 1
Second through fourth assessments. 3
The Cost of the selective breeding program.. 4
Analysis of the late-season Failure to Maintain low mite levels. 5
Could the spikes have come from mite reproduction?. 11
Am I selecting for bees that don’t rob?. 12
Selective Breeding for Mite Resistance:
1000 hives, 100 hours
Randy Oliver
ScientificBeekeeping.com
First published in ABJ March 2018
This spring I seriously stepped up my game in attempting to breed bees resistant to varroa. On these pages I’ll share my successes and failures, as well as keep track of the costs involved.
Quick summary
There is now plenty of evidence that unmanaged honey bee populations can evolve resistance to varroa, and several groups have also had various degrees of success with managed bees. What we now need is for the commercial bee breeders to all start joining in. To that end, I’ve suggested a simple and workable program for them to follow [[1]].
Selective breeding is nothing other than human-directed evolution. In the case of bee breeding, the human applies additional selection pressure above and beyond that imposed by the environment. Thus, selective breeding is a process of “bottlenecking” the genetic diversity of the “wild type,” in order to favor traits that the human prefers. In my case, I prefer gentle bees that are well-adapted to my ecoregion and income stream (almond pollination, nuc and honey sales). I’m now adding one more hurdle for them to clear—to maintain low levels of varroa. How they manage to do it is of interest, but not important to me at this time.
If you tell the bees how to do the job, you limit them. But if you just tell them the desired final outcome, they may come up with solutions that you had never thought of [[2]].
I then began my “Walking the Walk” demonstration project [[3]] in 2017 with 1000 nucs—made over a period of several weeks–headed by freshly-mated queens grafted from low-mite queen mothers from 2016, open mated in yards flooded with drones from my operation.
First assessment—early July
The selection process is based upon the elimination of “loser” colonies from the potential breeder pool by monthly mite wash assessments; any hives failing to make grade are immediately treated for mites, so no colonies are lost in the process.
We performed the first round of mite washes between 25 June and 15 July, in the same order in which the nucs had been made. Most colonies were now in double deeps, and had grown to around 15 frames of bees. At this point of time, our spot checking indicated that, as normal, our average mite wash count was approaching 6 mites per half-cup sample of bees (2 mites per 100 bees)—our usual action threshold (which, at this time of season, would be for us to apply a formic acid treatment while extractable honey was still on the hives). The results are shown in Table 1.
Table 1. The first assessment separates out both the potential breeders as well as the “mite bombs.”
| Beginning potential breeder pool (number of hives mite washed at first assessment) | 1028 |
| Average mite wash count (per 1/2 cup of bees), for all colonies at this time point | 5.5 |
| Range of yard-average mite wash counts | 1–19 |
| Range of highest individual mite wash counts in a yard | 4–109 |
| Overall percent of hives exhibiting a count of 3x the yard average | 10% |
The last row in the table above is an assessment of potential “mite bomb” colonies—those whose mite wash counts were above an arbitrary three times the yard average. What I’m finding is that if one can identify and eliminate those “bombs” early on, mite management becomes much easier overall. We treat and requeen the bombs [[4]].
Practical application: I want to point out something important that I’ve learned from my extensive mite monitoring—that it’s easy to be unaware of the “mite bombs” lurking in your yards (note that one of those “bombs” already had a mite count of 109). By mid July, although our average mite count was less than 6, one out of ten of my hives exhibited a mite count of at least 15, indicating that even with our normal treatments, those hives would have become a problem. Take home message: spot checking is likely to miss the bombs.
Breeder disappointment
I’m not trying to sell you anything, so I will share my disappointments as well as my successes. The queens for the thousand nucs were grafted from 15 different breeder queen mothers. Each breeder colony exhibited very low mite levels after almonds, and one–queen “S”–came from a survivor colony rescued from another beekeeper’s long-abandoned apiary. Queen Zero was in her third year with only minimal treatment.
After grafting off those promising mothers, I maintained those colonies in my crowded home yard, and tracked their subsequent varroa buildup. Most failed the June assessment (perhaps due to a high rate of mite drift), so I tracked only three through August (Table 2).
Table 2. Mite counts per half cup of bees from three favored breeders.
| Assessment date and mite count/sample | |||
| Breeder name | 7-Jun | 19-Jul | 17-Aug |
| Zero | 29 | 27 | 23 |
| S | 8 | 35 | 28 |
| L | 9 | 10 | 12 |
As you may imagine, the above counts were disappointing, especially since Queen Zero’s colony had done so well in previous years (although note that her count was slowly going down as the season progressed). Queen L showed particular promise, since the colony was extremely gentle and productive, and exhibited a mite count of zero after almonds, so I had made a number of late grafts from her.
Practical application: just because a colony exhibits a very low mite count at first assessment, don’t assume that it will necessarily be able to continue to do so [[5]].
So let’s see how the daughter colonies did:
Second through fourth assessments
The thousand daughter colonies by this time had been placed in some 50 different yards. I gave the hives in each yard time to build up and grow a mite population before assessment, so some yards got four assessments, some only three. I eliminated from consideration any colonies that were performing poorly, or that appeared to have requeened. As you can see in Table 3 below, the selection process was brutal—only 5% of the original thousand colonies were still in the running come November.
Table 3. Results for the season’s elimination process. Any hive not making grade at any time point was immediately treated for mites—thus no colonies were lost in the selection process.
| Assessment
date |
Number of hives with counts of <6 mites/sample*** | Percent of starting number of hives remaining* |
| Early July | 289 | 28% |
| Mid Aug and or mid Sept** | 98 | 10% |
| Late Oct | 52 | 5% |
| * Percent of the original 1028 hives
** In most yards we took 4 counts, but for the last-made nucs we took only 3 counts *** The late October count includes a few exceptionally strong colonies with mite counts of up to 8, which is below a commonly-accepted treatment threshold for that time of year. |
||
Practical application: the first round of mite washes was tedious, since we needed to sample a thousand hives. But it quickly became easier, requiring sampling of only 300 hives in the next round, and only 100 in the fourth round (which we could do in a day).
By the September assessment, nearly all of the remaining potential breeders had been consolidated into three yards. We’d been feeding all colonies pollen sub and syrup to encourage late-season broodrearing, and they had mostly finished off their last patties.
Practical application: all hives in our operation were managed the same; the only difference for the potential breeders is that they didn’t get treated for varroa. Thus, there was no loss in productivity or colony strength due to the selection process.
The final tally
I started with over 1000 hives, and ended up in November with 52 that still exhibited mite counts below the treatment threshold. I’m quite happy with the low number of colonies remaining, since I want to apply a strong degree of selective pressure. If even a dozen colonies still make grade come next spring, that will give me enough diversity of bloodlines for next season’s queen mothers.
I’m guardedly optimistic, since it’s heartening to identify colonies that appear to be able to manage varroa on their own. I’m completely aware that a selective breeding program is a long-term process, and that I will need to continue to perform at least 1500 mite washes every season. But if I can demonstrate the feasibility of breeding locally-adapted mite-resistant stock, it will be well worth it.
Practical application: having 1000 hives in a breeding program for mite resistance puts one in the top tier of such programs worldwide. I encourage other large-scale beekeepers to join me in this effort!
Although I was disappointed in the performance of the queen mother colonies (Table 2), I’m guardedly optimistic about some of their daughters–as of November (after a full season without any treatments), there were still 16 colonies that exhibited mite counts of 1 mite per hundred bees or lower, despite being in crowded yards with plenty of mite immigration occurring.
Practical application: I’m not trying to sell anything nor making any predictions—I’m simply documenting the results from applying strong selective pressure for apparent mite resistance. The success of any breeding program is completely dependent upon the degree of heritability of the traits selected for—in this case, resistance to varroa buildup. Next year’s results will be the test of that heritability.
The Cost of the selective breeding program
The first question that I know you’ll ask was how much did it cost me to engage in this program? Since all of the 1000 colonies were managed exactly the same, save for withholding mite treatments from those that made grade at each assessment, there was no loss in productivity or colony health, nor any extra labor cost for management. Thus, I can summarize the only two added costs to our normal management—the labor of doing the mite washes and the cost of the rubbing alcohol (Table 4).
Table 4. Summary of the additional labor and materials involved.
| Total # of washes | 1463 |
| Total man hours | 98 |
| Cost of alcohol | $150 |
That’s it—a hundred additional man hours—chump change for a large operator.
Practical application: although I’ll be the first one to say that performing 1500 mite washes is a bit tedious, it also unblinded me as to the “state of varroa” in our operation, saved the rest of the crew time (since each hive got marked in July with a mite count and any notes on action items), and eliminated all the mite bombs before they hurt the rest of the operation. The most time was involved in the first wash, which we did in July when the colonies were mostly in doubles. A helper and I could easily perform 100 mite washes in a short day, including driving between yards. I’d strongly suggest that you perform your first wash prior to putting on any honey supers.
What’s Next
I’m not about to claim success this early in the game. We’ll see how my remaining 52 potential breeders do over the winter. Remember, I’m only selecting strong, productive, gentle colonies, with the mite wash being the last hurdle. I was disappointed by how the mite counts climbed in my breeder queen colonies from this spring, so I’m very realistic about how this may take a while. It largely depends upon the degree of heritability of whatever traits these colonies are using to fight the mite, whether all the hives are using the same traits, whether those bloodlines can all work together, and whether I can maintain control of the matings in my breeding population. And on that note…
Control of matings
Unless you practice instrumental insemination, it’s unlikely that you will achieve complete control of your matings. A very nice practical experiment by Szabo in Canada [[6]] indicated that queens will get mated if a drone source colony is within 5 miles; it takes 10 miles of isolation to completely control your matings. In many parts of the country, it may be difficult to find an area without any other hives within a 10-mile radius.
So unless you can find a truly isolated mating yard (such as used by Brother Adam), your best bet may be to do what I’m doing—flooding my mating yards with drones, and offering free queen cells each spring to any other beekeepers in the area.
Analysis of the late-season failure to maintain low-mite levels
After tracking the rates of mite increase over the course of the season (four washes for many hives), I was really surprised by the huge and unexpected jump in mite counts in a number of the potential breeders between mid September and the end of October. And that brings us to the bugaboo of many beekeepers—the apparent late-season drifting of mites from high-mite hives to low-mite hives. Check out the graph below for the successive mite wash counts for the potential breeders in one of the yards (Fig. 1):
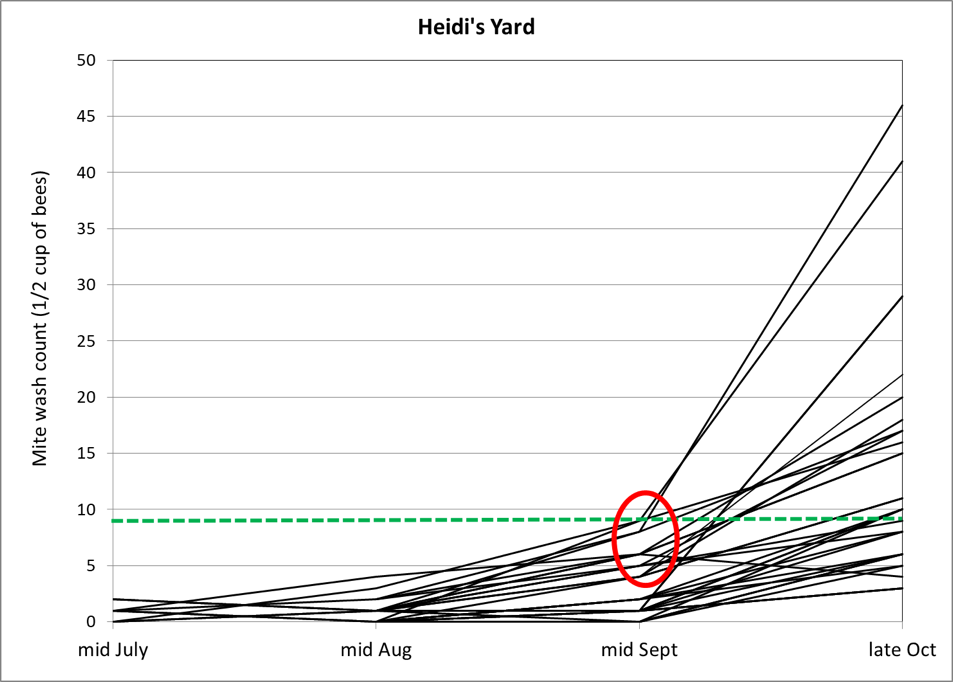
Figure 1. Mite counts for individual potential breeder colonies in one consolidation yard, plotted over time. The green dotted line indicates the commonly-recommended treatment threshold of 3 mites per 100 bees. Note the spike in mite counts in roughly half the hives at the last assessment. On the other hand, the other half were able to maintain mite levels below the treatment threshold of 3 mites per 100 bees. Not a single hive had collapsed from mites in this yard of 34 hives—so any mite immigration would have needed to come from elsewhere.
I’m well aware that as colonies reduce their amount of broodrearing late in the season, that a greater proportion of the mites are forced into phoresy, and that alcohol wash counts will increase. But these colonies were actually increasing the sizes of their broodnests due to us feeding pollen sub, so we can’t blame the spike in mite counts upon that.
In the above graph I’ve circled the inflection point for several hives in red. A number of them showed indications between the mid-Aug and mid-Sept counts that they were barely holding their mites in check, so I can understand that they’d likely have a problem later, but not to the degree indicated. In my experience, untreated hives from similar nucs would typically show mite counts in the 20’s to 30’s by mid September (Fig. 2), so any hive that had maintained a mite count below 10 by mid September would certainly appear to be exhibiting some degree of resistance to mite buildup.
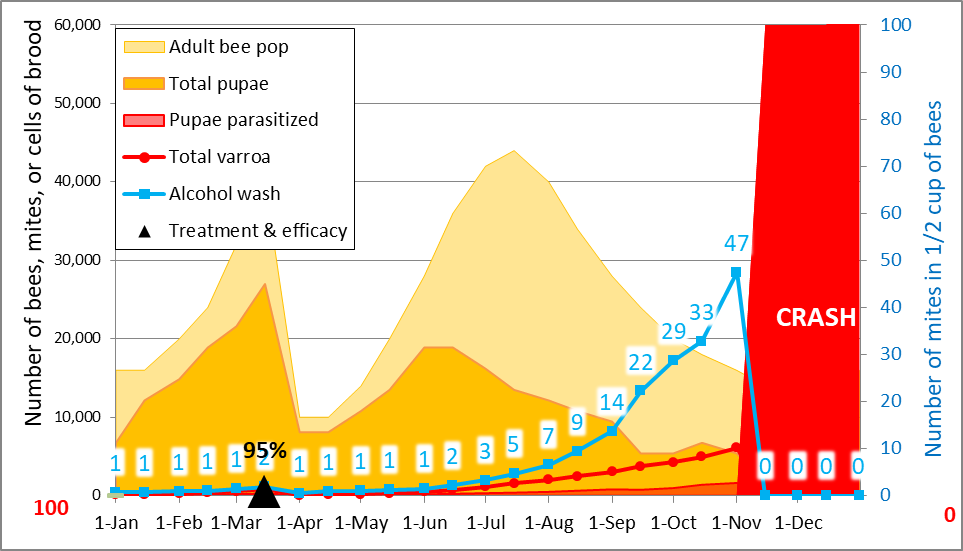
Figure 2. The typical expected mite rate of mite buildup for an untreated hive created from a nuc (at black triangle) in my operation. For the above simulation, I factored in a mite immigration of 500 to reflect the average mite buildup rate that we actually observe if we don’t treat. As of mid September, that count would typically be well over 15—much higher than any hive remaining in the breeder pool.
The potential breeders in Heidi’s yard (Fig. 1) had held their mites to half that count of 15. So what happened between then and the end of October?
When I run the numbers, I come to the same conclusion as did DeGrandi-Hoffman [[7]]—that “the rapid growth of the mite populations could not be accounted for… by mite reproduction alone,” and that “the combination of field data and simulations suggest that [foragers with mites] were drifting in from other colonies and contributing to the growth of varroa populations in our colonies particularly in the fall.”
This apparent late-season inundation of some colonies is a hot topic of late, but was already reported and quantified some 25 years ago [[8]]. Allow me to run a couple more simulations to illustrate the effect of mite immigration. By the way, I’m getting positive feedback on my mite model from beekeepers in countries all over the world—if you’ve got Excel on your computer, give it a try! This time, the simulations will be for colonies exhibiting a good degree of mite resistance, by decreasing (in the model) the average number of daughters per foundress from 1.5 down to 1.15, resulting in an April-Sept r value for the mites of 0.015 independent of immigration (Fig. 3).
| A note on r-values. My modeling suggests that for regions with a 3-month brood break over winter, that colonies that somehow manage to restrict the overall varroa daily rate of increase from April through September to 0.014 would never need any mite treatments if they were split or swarmed each year. In areas where colonies seldom go broodless, that rate for sustainability would need to be in the 0.003 – 0.004 range. So we know the target that we’re aiming for! To compare these daily r values to those from studies by others, see the table in the end notes. |
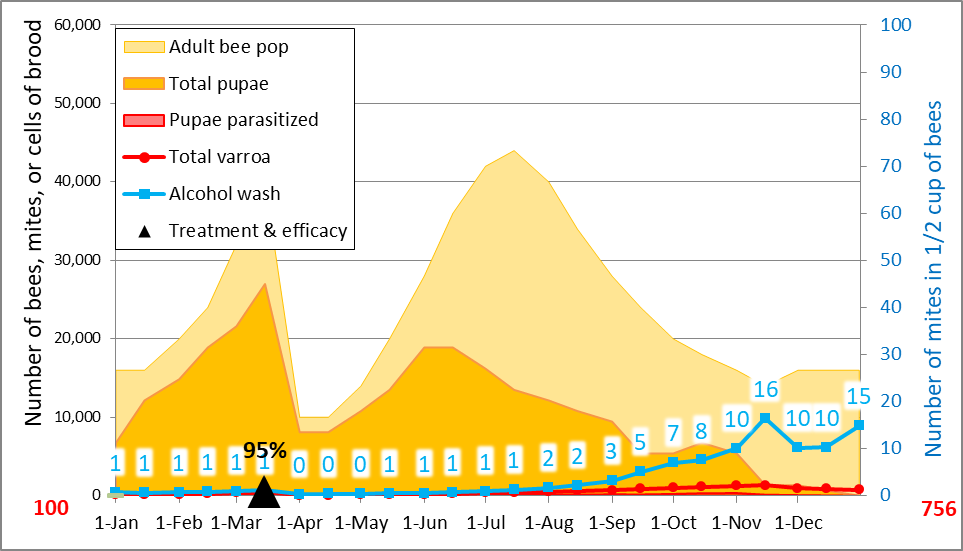
Figure 3. A simulation to match the observed alcohol wash counts for the potential breeders for the July through September assessments. I allowed for the same total immigration of 500 mites. Note, however, that this simulation also predicts that the counts wouldn’t have spiked beyond 10 by the end of October, indicating that the amount of immigration was much higher than 500 mites.
So let’s increase that late-season mite immigration from 500 to 2000 (Fig. 4).
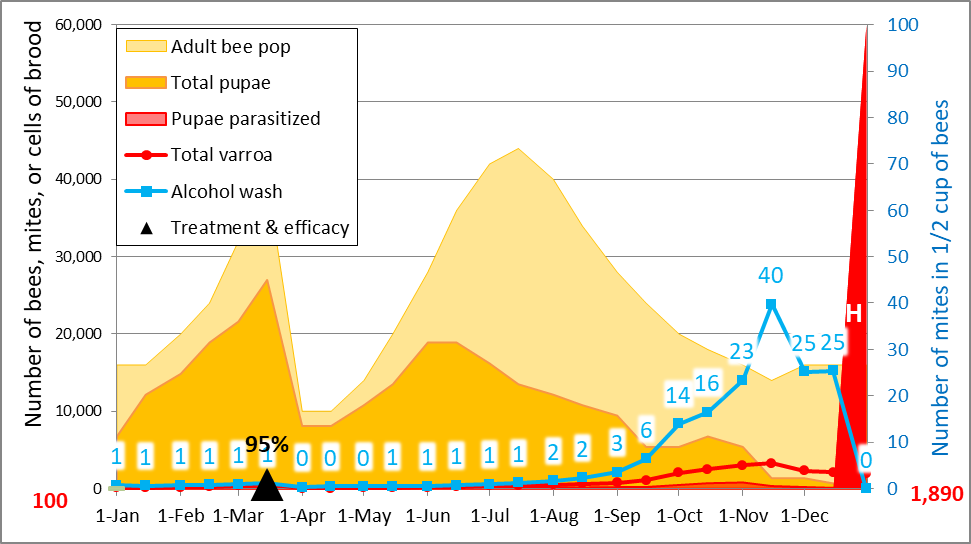
Figure 4. Same simulation as above, but with a late-season immigration of 2000 mites. Now we’re getting somewhere–the predicted mite wash counts now closely match what occurred in the Heidi’s yard (Fig. 1), with the suggestion that immigration was even higher in some hives.
And it wasn’t just in that yard (Fig. 5).
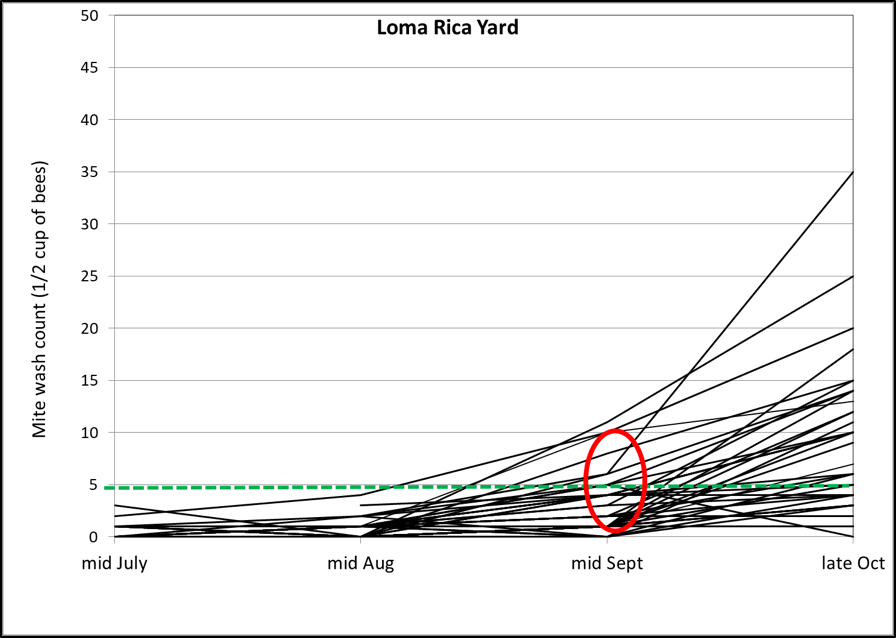
Figure 5. Same thing in the second breeder consolidation yard. This yard contained about 100 hives in total, but all had their mites well under control, and none had collapsed—so any mite immigration must have come from outside the yard.
By this time I was scared. Would this spike be occurring in our 1500 other hives that we had treated in August with Apiguard (thymol)? So I spot-checked 3 non-breeder colonies each in 5 yards (including one of the breeder holding yards). Results: their average mite count was only 4 (completely acceptable to us, since they’d soon be getting an oxalic dribble), although there was one outlier with a count of 20.
Practical application: although there were acceptable mite counts in 14 out of 15 tested hives, there was still that danged high-mite outlier, despite the fact that all hives had been treated equally in August. Since the late-season spike is so erratic, I can only guess that a proportion of the hives in each yard are robbing collapsing hives away from my yards. Since there are only a few hobby beekeepers within flight range, I’m strongly suspecting that the mite influx is coming from escaped swarms.
So assuming that all hives were exposed to some degree of mite drift, how could I account for the control hives not spiking as much as the potential breeders that did? Below (Fig. 6) are the actual counts for the last breeder consolidation yard (which was close to the Loma Rica yard), in black. I’ve overlaid four different simulations:
- The red dotted line would be representative of non-resistant hives that had been treated in August, with an expected mite increase r value of 0.017 for that time of season, with a late-season immigration of 500 mites. Because their pre-immigration mite levels had been greatly reduced by treatment, they would still exhibit low mite counts at the end of October, as I observed.
- The blue dashed line laying almost directly behind the above line represents an untreated mite-resistant colony that kept mite increase from mid April through mid September to an r value of only 0.012, but with an added a 500-mite immigration. This would reflect the breeders that made the final grade.
- Now look at the circled inflection point—I suspect that those untreated potential breeders may not have been quite as resistant as the blue line breeders, so I assigned them a slightly higher baseline r value of 0.014, with an immigration of 3500 mites, mostly occurring during a few days in mid September. Their dashed purple curve accurately matches the observed spikes. But note that even that massive 3500-mite immigration would still not account for the measured mite spikes in the three colonies above that curve.
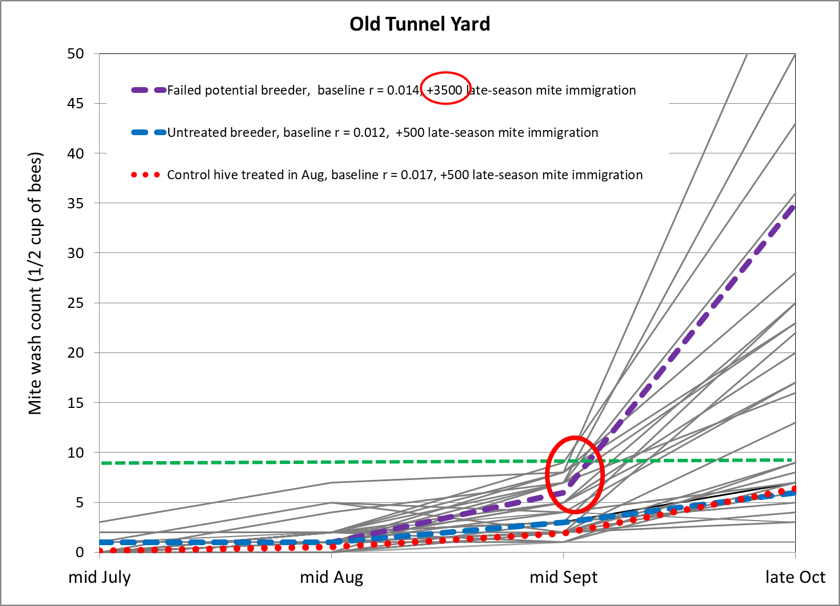
Figure 6. By running the numbers, we can perhaps better understand the causes for the late-season mite spikes that many beekeepers complain of. Here I compare actual mite wash counts to the three simulations described above.
Hold on, you say, did you really mean 3500 mites? Hard as it is to believe, that appears to be the case. But mite immigration of that magnitude has been well documented [[9]].
Could the spikes have come from mite reproduction?
I feel fortunate to have friends who challenge me to support any claim that I make. One, Charlie Linder, asked me whether the mite spike in autumn could result from mite and bee population dynamics within the hive—without an influx of mites from outside. I’ve pointed out in a previous article [[10]] that alcohol wash counts can be expected to spike in fall, but could they do so to this extent without additional mites drifting in from outside?
For those interested I’ll do the math as a footnote [[11]]. The math indicates that neither mite reproduction nor colony dynamics could possibly account for those observed late-season spikes—the same conclusion as reached by Dr. DeGrandi-Hoffman’s USDA team.
Update: it now looks as though that if some of my colonies indeed started out with 20 mites or fewer, that the fall spike could have come about from simple reproduction along with minor drift. I will discuss the need to tweak the protocol of my suggested breeding program to account for this.
I asked breeder John Keefuss about his resistant colonies. He calls some of them “mite black holes”—colonies seem to be able to swallow those mites and somehow make them disappear. I have yet to figure out a plausible way for the bees to make that happen [[12]].
Am I selecting for bees that don’t rob?
A mite-resistant colony may be able to suppress the buildup of varroa, but then get overwhelmed with mites later in the season when it robs out a collapsing colony in the vicinity. Note that only half the colonies in each yard exhibited those sudden spikes in mite counts. Could it have been that they were the only ones that robbed out collapsing escaped swarms?
Practical application: Prior to varroa, it was evolutionarily adaptive for a colony to practice late-season robbing. That may no longer be the case, because along with that serving of free honey comes a side order of mites. Since I eliminated any mite-spiking colonies from the breeder pool in this last round, perhaps I’m inadvertently also selecting for colonies that are averse to robbing. Remember, I’m not telling the bees how to do the job, but that they do have to make it all the way through the season with low mite levels. Perhaps avoidance of robbing is necessary to make the grade.
COMING UP: I plan to elaborate on the subject of mite drift in my next article.
Acknowledgements
Thanks to my hard-working helpers Tara McKinnon, Rachel Woodward, and Josh Sewell—they made the tedium of mite washing much more enjoyable. And to my sons Eric and Ian, who are working with me and around me during our learning curve to make this breeding program work. And thanks to the donors who help to support my research.
References
[1] Bee Breeding for Dummies https://scientificbeekeeping.com/the-varroa-problem-part-6a/ and
Smokin’-Hot Mite Washin’ https://scientificbeekeeping.com/the-varroa-problem-part-10/
I’ve also provided a user-friendly mathematical model for use with a breeding program:
https://scientificbeekeeping.com/randys-varroa-model/
[2] Paraphrased from the movie Tortilla Soup.
[3] Walking the Walk https://scientificbeekeeping.com/the-varroa-problem-part-7/
[4] We want to remove any highly mite-susceptible colonies, so that they won’t be producing drones next season.
[5] The ARS is hoping that POL-line mite-resistant queens will be more widely available as breeding stock within a year.
[6] Szabo, TI (1986) Mating distance of the honeybee in North-Western Alberta Canada. Journal of Apicultural Research 25(4): 227-233.
[7] DeGrandi-Hoffman, G, et al (2016) Population growth of Varroa destructor (Acari: Varroidae) in honey bee colonies is affected by the number of foragers with mites. Exp Appl Acarol 69:21–34
[8] Greatti,M, et al (1992) Reinfestation of an acaricide-treated apiary by Varroa jacobsoni Oud. Experimental & Applied Acarology 16: 279-286.
[9] Greatti,M, ibid
[10] Using The Mite Model https://scientificbeekeeping.com/the-varroa-problem-part-13/
[11] Assuming that 50% of the mites were phoretic (indicating that the phoretic count would be proportional to the total mite population) at the mid Sept and 1 Nov time points, going from a wash count of 5 to 35 in 45 days would be a daily r value of 0.043. Even if you assume only 3 days of phoresy (unlikely due to the low brood:bee ratio), to obtain a daily r of 0.043 would require that every foundress produced 1 successfully-mated daughter, and that there was zero mortality (over 15 days) for either the foundress or that daughter. But since those colonies up to that point had exhibited a far lesser rate of reproductive success, I find this explanation untenable. Compare the 0.043 r value to those from the literature:
| Source | Year | r(day) | |
| Harris, Harbo, Villa,Danka 2003 | 1993 | 0.031 | |
| DeGuzman 2007 Baton Rouge Italians | 2007 | 0.027 | |
| To double the mite pop each month | 0.023 | ||
| Harbo, Harris 1999 worst colony | 1999 | 0.023 | |
| Harris, Harbo, Villa,Danka 2014 | 2002 | 0.023 | |
| Harris, Harbo, Villa,Danka 2004 | 1994 | 0.021 | Typical range for com-mercial stocks |
| Harris, Harbo, Villa,Danka 2008 | 1997 | 0.021 | |
| Danka 1999 16 day | 1999 | 0.021 | |
| DeGuzman 2007 Baton Rouge Italians | 2007 | 0.021 | |
| Harris, Harbo, Villa,Danka 2007 | 1996 | 0.020 | |
| DeGuzman 2007 Baton Rouge Russians | 2007 | 0.020 | |
| Randy’s typical California hive | 2016 | 0.019 | |
| Harris, Harbo, Villa,Danka 2005 | 1995 | 0.019 | |
| DeGuzman 2007 Baton Rouge Italians | 2007 | 0.017 | |
| Vandame Mexico EHB | 2000 | 0.017 | |
| Harris, Harbo, Villa,Danka 2015 | 2002 | 0.014 | |
| Harris, Harbo, Villa,Danka 2006 | 1995 | 0.011 | |
| Harbo, Harris 1999 average colony | 1999 | 0.010 | |
| Vandame 2000 EHB in Mexico | 2000 | 0.010 | |
| DeGuzman 2007 Baton Rouge Russians | 2007 | 0.009 | |
| Harris, Harbo, Villa,Danka 2013 | 2001 | 0.007 | |
| Harris, Harbo, Villa,Danka 2009 | 1999 | 0.005 | |
| Harbo, Harris 1999 average of resistant colonies | 1999 | 0.004 | Our goal |
| Harris, Harbo, Villa,Danka 2012 | 2000 | 0.003 | |
| Harris, Harbo, Villa,Danka 2010 | 1999 | 0.003 | |
| DeGuzman 2007 Baton Rouge Russians | 2007 | 0.003 | |
| Harris, Harbo, Villa,Danka 2011 | 2000 | 0.002 | |
| Harbo, Harris 1999 best resistant colony | 1999 | -0.008 |
[12] I’m be skeptical that the bees can manage to kill incoming phoretic mites at a high enough rate to avoid the spike, since varroa are so amazingly good at avoiding being groomed from a bee once they’re attached.


