“Fried Eggs” Identified!
Randy Oliver
ScientificBeekeeping.com
First Published in ABJ in Feb 2012
I mentioned in my previous article that I’ve been seeing an unidentified organism that looked like “fried eggs” in the guts of bees from my operation in the California foothills (Figure 1). I sent out requests to a number of researchers for ideas as to what it was. Thanks to Antonio Gómez Pajuelo of Consultores Apícolas in Spain for identifying them as rust fungus spores.
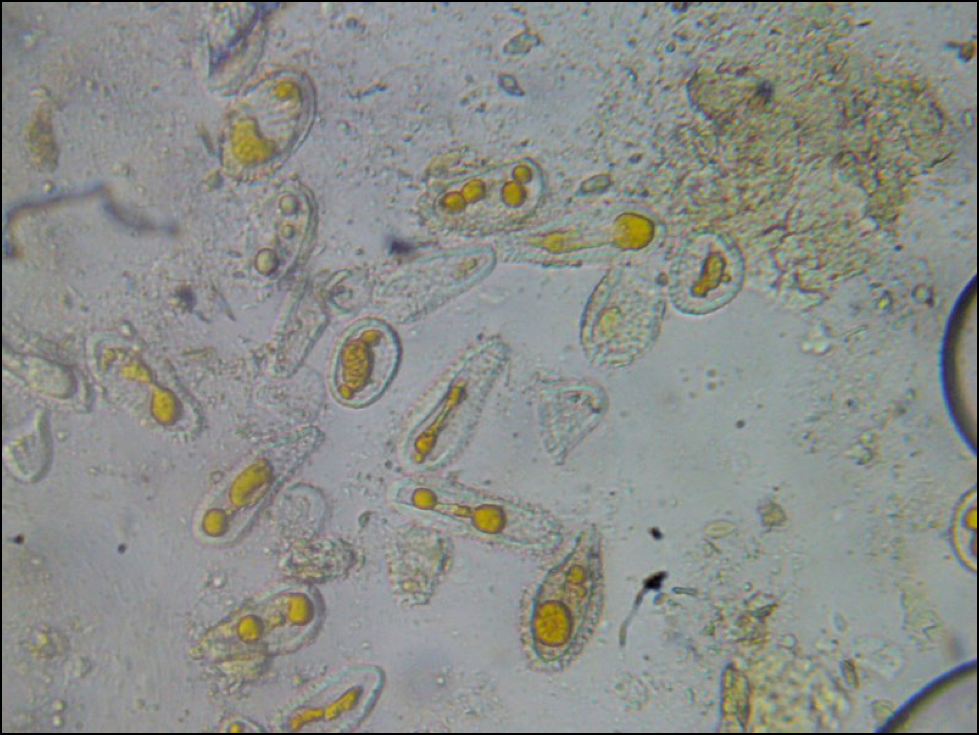
Figure 1. These “fried eggs” have a distinctive pattern of tiny spikes on their outer shell, which helped to identify them as some sort of rust fungus spore. What appeared to be the process of cell division in this photo may have actually been the process of digestion! Photo by the author.
Upon further research, I found that beekeepers have long reported bees gathering rust spores and packing them into their pollen baskets, and that a number of scientific papers had been written on the subject (it always pays to dig into the older literature). The rusts are a large group of parasitic fungi with complicated life cycles. They infect quite a number of different plants, often forming reddish spore masses on the undersides of leaves. Bees have been observed collecting spores from a number of genera of rusts, including Uromyces, Puccinia, Caeoma, and Melampsora (Fig. 2),

Figure 2. Spores of the Poplar Rust Melampsora, which is commonly collected by bees. It’s not clear whether rust spores in general are harmful to bees. Photo courtesy www.bioimages.org.uk, © Malcolm Storey.
A.J. Cook reported in 1885 that bees in New York were gathering spores from blackberry rust “with great apparent greed.” Of interest is that the last two seasons, I had noticed unusual infestations of fluorescent orange rust on our invasive Himalaya blackberries in the foothills. I hadn’t put it together previously, but I had also noticed bees bringing in loads of a brilliant orange “pollen” that I’d never noticed before (by the time I got the dang things ID’d, I could no longer find that orange “pollen” to check under the ‘scope). Blackberry rust is generally attributed to Caeoma, but I found that UC Davis extension (Bolda 2011) reported we have a new invasion of orange rust of blackberries caused by two other fungi—Arthuriomyces and Gymnoconia (Fig. 3).
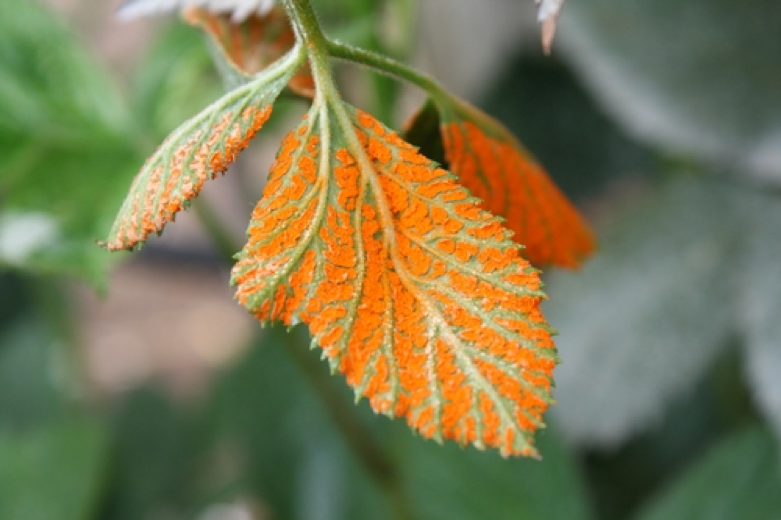
Figure 3. An orange rust on blackberry. This looks like the same thing that I saw around my apiaries. Photo courtesy Mark Boulda.
Something that I find intriguing is that some rust fungi produce sugary secretions for the purpose of attracting insects in order to help disperse their spores (Wäckers 2005). Even more fascinating is a potential explanation for the day-glow orange spore masses of blackberry rust. Shaw (1980), studying the collection of rust spores by honey bees, found that the spore masses reflected ultraviolet light of a wavelength to which bees are highly sensitive. So the fungus may be “intentionally” using bees to its advantage!
Bees consume rust spores readily; during our fall pollen dearth I often find bee guts packed with them. Schmidt (1984) found that bees in cages consumed Uromyces rust spores as readily as they did dandelion pollen, despite it being low in protein. The question then is whether rust spores are of any nutritional value to bees, or, since I often find them associated with sick colonies, whether they cause actual harm to the bees (my sampling is admittedly biased towards colonies in poor health).
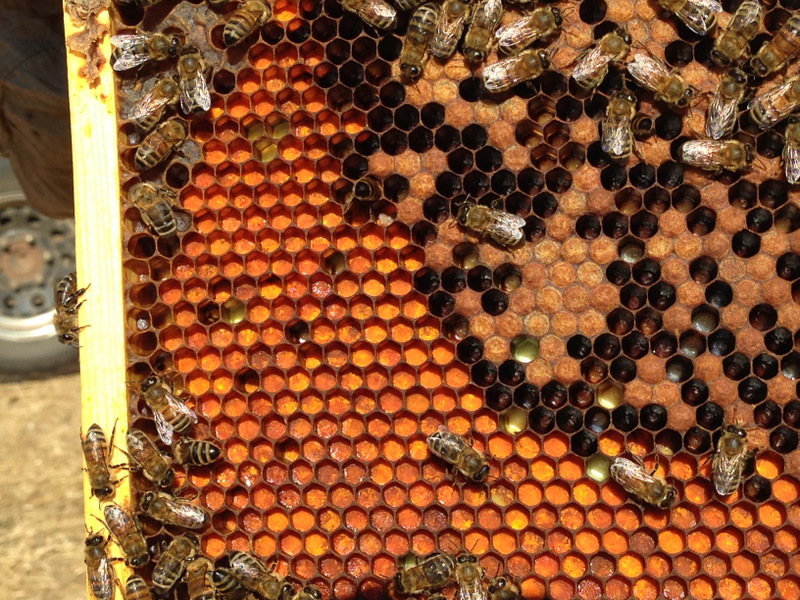
Above is a photo of a typical comb filled with beebread consisting of rust fungus spores. Note the lousy brood pattern and the dying brood. When the colony is feeding upon this beebread, it goes downhill quickly. However, if we feed the hive several pounds of high-quality pollen sub, it will turn around immediately and grow again.
Antonio Pajuelo (pers comm) also reports a correlation between the consumption of poplar rust spores and colony mortality, but doesn’t know whether it is due to spore toxicity or lack of better nutrition. It may be that the collection of rust spores is due to the lack of more attractive and nutritious floral pollen, and as such would simply be a generic indicator of poor colony nutritional status.
On the other hand, Schmidt (1987) found that caged bees fed Uromyces spores as a sole protein source actually had their lifespan reduced compared to those fed sugar syrup only—strongly suggesting that the spores were toxic. The spore-fed bees lived about 20 days less than those fed the most nutritious pollens!
Practical application: it may be wise to feed pollen supplement if you observe your bees collecting rust spores.
Acknowledgements
Thanks to Antonio Pajuelo and all the other researchers who helped with trying to put a name to these organisms. And a big thanks to Peter Borst and Juanse Barros for plying through Google Images in the search for the identity of these spores, and Dr. Jose Villa for digging up the old literature.
References
Bolda, M (2011) Orange rust emerging again in blackberry. http://cesantacruz.ucdavis.edu/?blogpost=4660&blogasset=16664
Cooke, AJ (1885) Fungus spores for bee bread: A new kind of pollen. Gleanings in Bee Culture July 1885 pp. 455-456.
Schmidt, JO and BE Johnson (1984) Pollen feeding preference of Apis mellifera, a polylectic bee. The Southwestern Entomologist. 9(1).
Schmidt, JO, SC Thoenes and MD Levin (1987) Survival of honey bees, Apis mellifera (Hymenoptera: apidae), fed various pollen sources. Annals of the Entomological Society of America 80(2): 176-183.
Shaw, DE (1980) Collection of neurospora by honeybees. Trans. British Mycol Soc. 74 (3): 459-464.
Wäckers, FL, J Bruin (2005) Plant-provided food for carnivorous insects: a protective mutualism. Cambridge Univ. Press.
Infection Prevalence
Sequential Sampling
A Neat Little Shortcut
Validation
Summary (completely subject to revision)
More Details
Next Month
Acknowledgements
References
2019 Quick Nosema Prevalence Assessment Method
First published in ABJ February 2012
Updated March 13, 2019
Randy Oliver
Since the discovery of Nosema ceranae, I and many other beekeepers and researchers have been frustrated by the tedium and apparent futility of counting nosema spores, since many of us haven’t seen any meaningful relationship between spore counts and colony health or production. I strongly suspect that the issue is not that N. ceranae does not cause problems, but rather that our methodology for assessing the degree of infection has been flawed.
The quickest way that I’ve found to determine the degree of nosema infection in a hive is to do a 2-step sampling.
Step 1: open the hive and take a sample of about 50 workers from an outer frame, or from under the hive cover. These bees can be salvaged from an alcohol wash for varroa. Set at least 15 bees aside for the time being, and use the rest for the next step.
I now typically use only 10 bees. This is based upon the thorough research on Nosema apis by GF White in the early 1900s. What he found was that individually sampling 10 bees in order to determine the prevalence of nosema infection in the house bees gave the best indication of its biological relevance–a finding later suggested by Cameron Jack in Colony Level Prevalence and Intensity of Nosema ceranae in Honey Bees (Apis mellifera L.).
Be sure to read https://scientificbeekeeping.com/the-seasonality-of-nosema-ceranae/
Step 2: place at least 25 of the bees in a ziplock sandwich bag, and roll a round jar over them to crush their guts thoroughly. Then add about 3 mL of water for every 10 bees in the sample, and massage the bag in your fingers until you’ve homogenized all the gut contents into the water, creating a semi-opaque suspension (not too clear, not too thick). For details on this step, see https://scientificbeekeeping.com/sick-bees-part-13-simple-microscopy-of-nosema/
Step 3: immediately place a drop of the suspension on a slide, drop on a cover slip, and view under the scope. Scan a few fields of view for nosema spores. If you don’t see any (or only one or two), that indicates that the infection prevalence of that sample of bees was zero–end of assessment.
On the other hand, if you see spores in the sample, then perform 10 individual bee gut squashes from the remaining bees in the original sample in order to determine the biological relevance of the infection prevalence in the colony–details below.
Infection Prevalence
The current “standard” method for monitoring nosema “level” in hives is to determine the mean spore count per bee in an aggregate sample (of typically 10-100 bees). The method is relatively quick and gives the sort of quantifiable numbers that scientists love. Unfortunately, as noted by Meana (2010), “the spore count is not directly related to the parasite burden and health status of whole colonies naturally infected by N. ceranae under field conditions.”
Spore counts certainly have their uses, such as quantifying the progress of nosema infection in individual bees in cage trials by researchers. They are also appropriate as a method for “discovery sampling.” For example, one can “discover” whether nosema is present to any extent in an apiary by taking an aggregate sample of say ten bees from the entrance of every hive and determining the mean spore count. If the count is less than 1M (1 million spores per bee), then nosema is likely not a problem in the sampled hives.
The point that I’m trying to make about sampling for nosema is that we are well beyond the “discovery” phase. Rennich (2011) found N. ceranae in at least half of all random bee samples taken in the U.S. during winter and spring.
So instead of “discovery” sampling, what we need to do is to shift to the most meaningful way to measure the potential impact of nosema upon colony health—the proportion of infected bees. Of the various terms used to describe this measure—“proportion of infected bees in a sample,” “percent infected,” or “infection rate”– I prefer the term used by epidemiologists: “prevalence.”
Practical application: I henceforth plan to use the term “prevalence” as the measure of the proportion of bees infected by nosema. For example, if 2 bees out of 10 were infected, that would be a prevalence of 20%.
There is a strong case to be made for shifting our assessment of nosema infection from “intensity” (as measured by spore counts) to “prevalence” (the percent of bees actually infected). The only problem with determining prevalence is that most of us choke at the thought of having to inspect jillions of bees one at a time. Luckily, there are practical shortcuts:
Sequential Sampling
In my last article, I proposed that even a small sample of bees might be adequate for making management decisions. I’m immensely grateful to Dr. Jose Villa of the Baton Rouge Bee Lab for bringing to my attention that I was reinventing the wheel—this sort of decision making process, based upon small sample sizes, already has a fancy name: it’s called “sequential sampling,” and was develped as a time-saving method for quality control inspections during World War II. Furthermore, Dr. Villa dug into the library and forwarded me existing “Decision Tables” for tracheal mite sampling produced by Tomasko (1993).
Dr. Maryann Frazier (2000), following up on Tomasko’s work, discussed the situation regarding the assement of tracheal mite prevalence as opposed to “parasite load” (analagous to spore counts). It is remarkable in that it almost exactly mirrors today’s situation with nosema! And in her paper she validated the accuracy of sequential sampling.
Sequential sampling is all about the tradeoff between tedium (the number of bees that you need to squash and view) and confidence (the error rate which you are willing to accept). And it appears that for our purposes, I estimated the minimum number of bees to sample right on the nose!
So let’s set some arbitrary parameters for our decision making:
- An infection prevalence of 10% is “tolerable.”
- A prevalence of 30-40% is “intolerable.”
- We’ll accept a 20% error rate for overestimating the prevalence.
- But we won’t accept an error rate above 10% for underestimating the prevalence.
We’ll use the above parameters to set our treatment thresholds—below 10% prevalence, don’t treat; above 30%, treat. The math gets complex, but here’s the gist of the outcome:
Practical application: it appears that in order to make a decision whether to treat or not, that a couple of 5-bee samples should be adequate, interpreted as follows:
0 positive bees out of 5, or no more than 1 positive out of 10 indicates < 10% infection
3 positive bees out of 5, or at least 4 positives out of 10 indicates > 30% infection
Any number of positive bees lying between these cutoffs (e.g., 2 bees out of 5, or 3 out of 10) is not enough to make a firm decision, but suggests an infection level that lies in the gray zone. But I doubt that going beyond a 10-bee sample is worth the effort—I’d just move on to the next sample.
With true sequential sampling, you’d keep sampling until you hit a critical number of positive or negative bees in order to make a treatment decision. However, my limited experience suggests that we hit a point of diminishing returns after viewing 10 bees.
Update July 5, 2012 Beekeeper Ruary Rudd (ruaryrudd@iol.ie) has developed a great Excel spreadsheet for sequential sampling. You can write him for a copy–thanks Ruary!
So I’ve got us down to sampling a maximum of 10-bees. But even so, I must advise you that nosema infection appears to exist in “pockets” of bees in the hive, so any single small sample is inadequate for making an apiary-level decision (Botias 2011). Therefore, it’s necessary to process a number of samples. What’s been holding us back from determining actual nosema prevalence is the lack of a quick method for processing a number of samples of 10 bees!
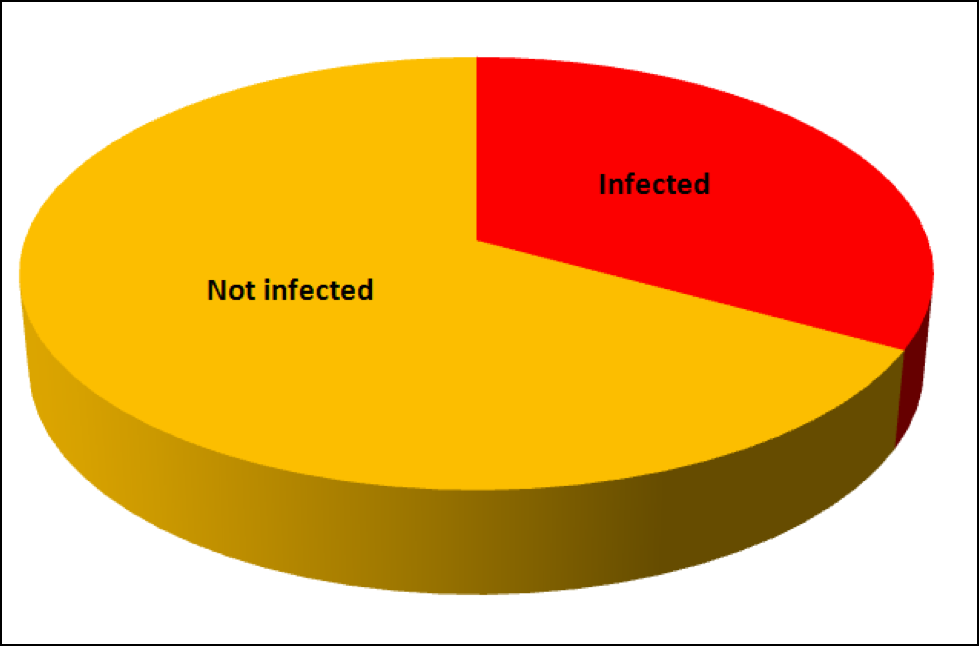
Nosema apis becomes a serious problem if about a third of the bees in a hive become infected. It appears that Nosema ceranae may be a problem at even a lower prevalence.
A Neat Little Shortcut
Since I really wanted to find a quicker way to prepare and view the 200 bees for the validation table in the previous article, I racked my brain trying to figure out a technique for speeding things up, and finally hit upon a relatively simple procedure (Figures 1,2, and 3). I’ve now got over 400 individual gut squashes under my belt, and am pretty excited about the method! This solution allows me to process bees at an overall turnaround rate of less than five minutes per sample of 10 bees!

Figure 1. This photo shows the necessary equipment for a Quick Squash—5 bees, a plain microscope slide, 5 custom-made thin plastic cover slips, a table knife, and a paper towel.
The size of the cover slips is critical—they must be narrow enough not to touch at the edges, in order to keep the individual gut slurries from mixing. The easiest solution is to cut off-the-shelf plastic microscopy cover slips in half with scissors. You can then just discard them after use (cost about 20¢/10-bee sample), or wash and reuse (use your mite shaker jar).
Update Feb 2019: I prefer to recycle rather than discard. But when I looked at costs, getting a large order of #1 thickness glass cover slips works out to only about a penny a slip. At Amazon: Karter Scientific 211Z2 Standard Microscope Cover Slip, #1 Thick, 22x22mm, 200pk (Case of 2000).
Be sure to order #1 thickness cover slips, since thicker cover slips won’t allow you to focus upon the spores.
The other thing is that you don’t need to make custom cover slips at all. Three standard glass cover slips will fit across a slide, and can be discarded after use if you don’t want to wash them (although they wash easily in warm water with a tiny bit of dishwashing detergent).
But if you don’t have plastic cover slips at hand, don’t despair! You can make cover slips out of clear plastic scrap around the home—but only some plastics will work; I’ve experimented with several. Clear plastic transparency sheets unfortunately refract light in such a way that they make nosema spores look like little rectangles, so they don’t fit the bill.
The heavy blister packs from the hardware store are too thick to focus through—a cover slip for 400x viewing needs to be thin. But then I found just the thing—the clear lid from a tub of the Colonel’s Kentucky mashed potatoes (get the gravy too, so you get an extra lid). Cut it into 11mm x 22mm rectangles—they work perfectly! You can wash them in soapy water, rinse, blot, and reuse until they get scratchy.
 Practical tip: Cut a whole bunch of cover slips and keep them in a custard dish for easy pick up—this greatly expedites the slide prep time. Look for thin clear plastic with the #1 recycling symbol for polyethylene terephthalate:
Beekeeper Health Breakthrough: Wracked as I was by images of beekeepers stuffing themselves with mashed potatoes in order to be able to monitor nosema levels, I forayed to the grocery to see if I could recommend a more healthful suggestion. To my great relief, I found that the rectangular containers for the nutritious “Baby Mixed Greens” are also made from PETE, and make excellent cover slips!
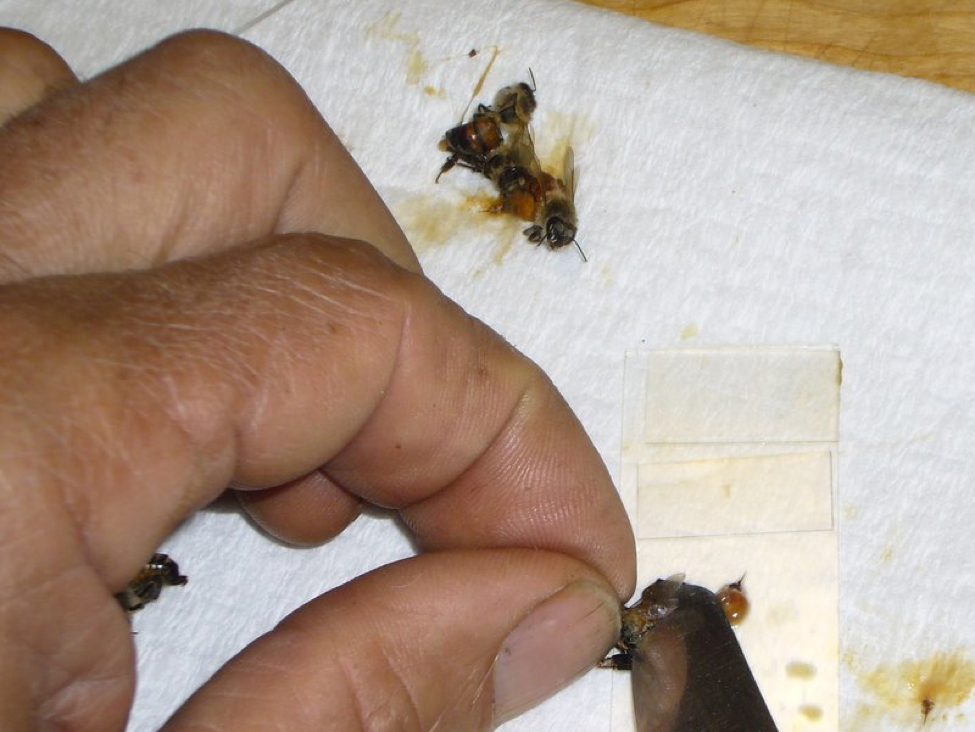
Figure 2. Hold a bee by the head/thorax, then use the table knife to “milk” the gut contents (or the gut itself) out of its abdomen directly onto the slide. Use the knife tip to mash the material in a droplet of water in order to distribute any spores into the macerate. Then remove any excess bee tissue, leaving a thin slurry (note the stinger and rectum on the slide, and on the towel to the right). Finally, place a cover slip over the drop of slurry. In this photo, I’ve completed two preps at the top (neither contained much pollen). I’m working on the third, which will make a more opaque slurry.
The technique of “milking” the bee’s abdomen by rocking a flat blade from front to rear will quickly cause the discharge of the gut contents, or with increased pressure, the gut itself. It is critical to thoroughly crush and mash these in a little water—I wet the tip of the knife blade in a stream of water if necessary—until you create a cloudy, but not opaque, macerate. Tip: it’s critical to be able to press the knife tip down flat against the slide, so work with the slide near the edge of a raised cutting board, so that your knuckles can drop below the work surface level. Be careful to keep the macerate on the portion of the slide that will be under each cover slip. Then be sure to flip off any thick chunks of excess tissue, especially the sting or any dark pieces of exoskeleton, or they will space the cover slip up too high. Clean the knife tip under running water, and wipe it on the dry towel between each bee. With practice, this entire process takes only a few seconds!
Repeat the process down the slide, exercising caution to wipe the blade thoroughly between bees, and not allowing any liquid to run from sample to sample. The separate cover slips keep the samples from mixing. After you’ve crushed and covered 5 gut samples, then fold the towel over the slide and press down firmly and evenly to set all the cover slips down flat, and to absorb any liquid that might otherwise get onto the microscope lens.
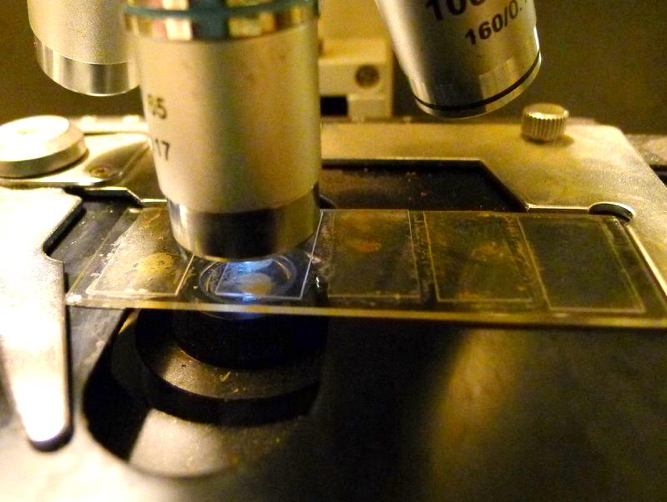
Figure 3. Presto—you now have a 5-bee gut sample ready to view under a scope. It’s then a simple matter to glance at each of the samples in turn to check for nosema spores. This technique works for either freshly-killed or preserved bees.
At this point is really helps to have a scope with an adjustable stage (having turnable knobs to move the slide around). Then you can easily move from one cover slip to the next, and quickly scan up and down each slip if necessary. It’s also very easy to see whether you’ve gotten nurse bees or foragers, since each gut squash clearly shows any contained pollen (Figs. 4 and 5).
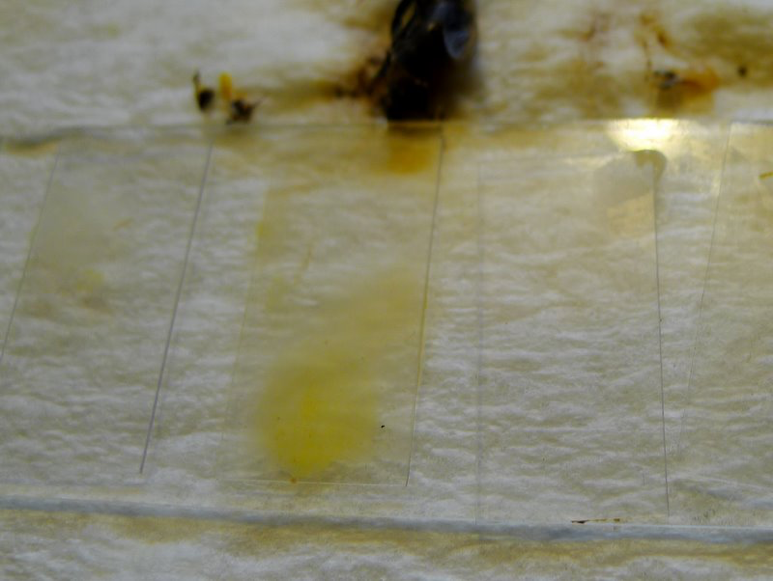
Figure 4. Close up of the differences between squashes containing pollen (center) and those from without. This sample was taken from the entrance on a cold November morning with minimal flight. See the following photos for how the two left-hand squashes looked under the scope. Two out of 5 of these bees were infected.
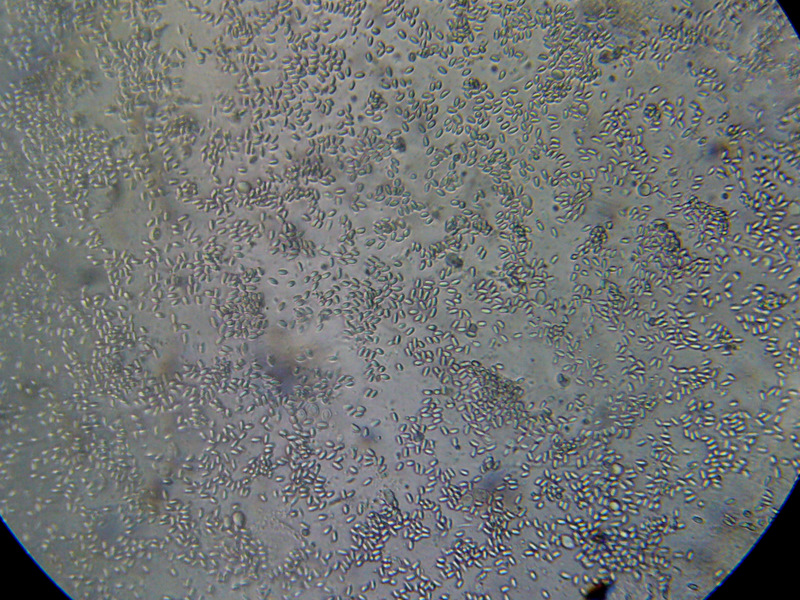
Squashed bee guts, especially the midgut, are typically either free of nosema, or strongly infected, as above.
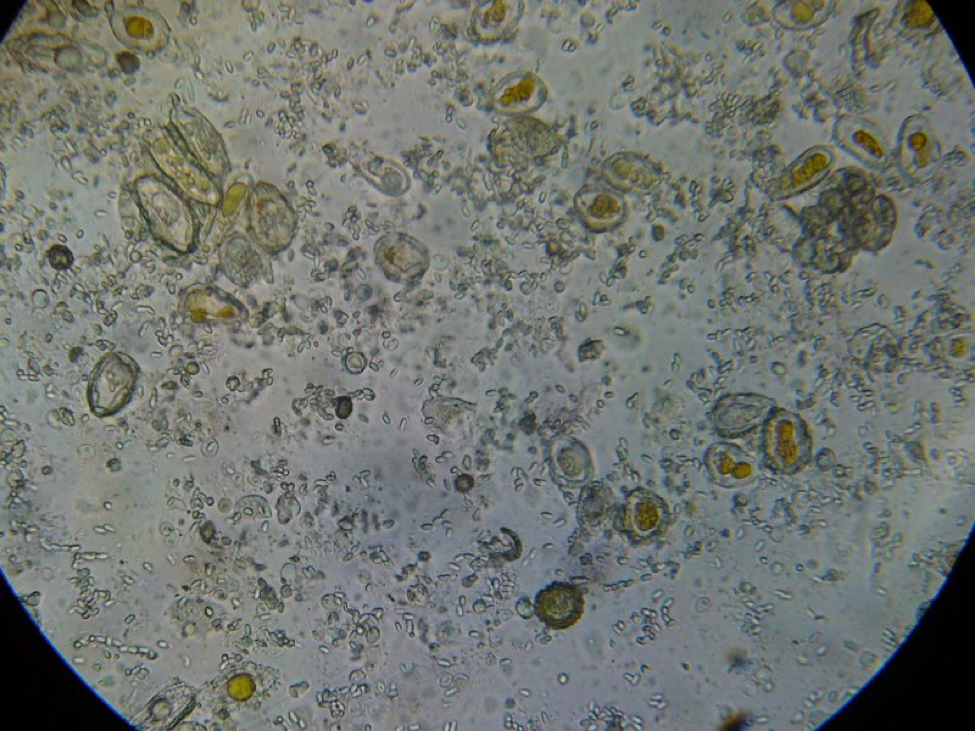
Figure 5. This is a view of the orange-colored center squash shown above. This bee is only moderately infected with Nosema ceranae, and the gut also contains some orange-centered rust fungus spores–which are unhealthy for bees to consume.
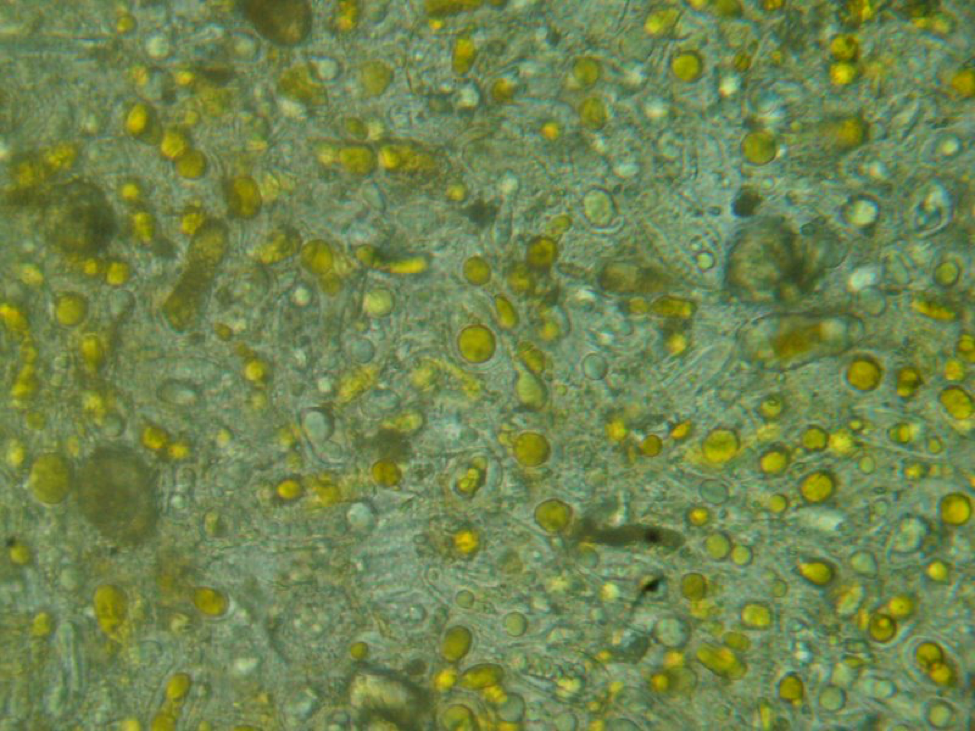
Figure 6. A close up from a gut packed full of “fried eggs.” It took me a while, but I finally identified these spores as being from rust fungus.
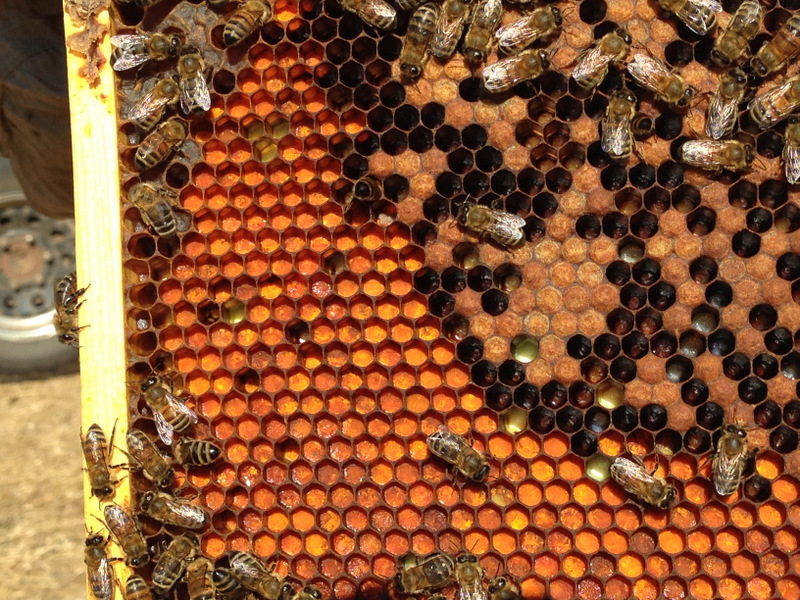
It took me quite a while, but I eventually identified the “fried eggs” in the bees’ guts as being spores from a blackberry rust fungus. In the photo above, you can see the fluorescent-orange spores packed as beebread–this is not pollen! The fungus tricks the bees into gathering its spores. Note the dying larvae next to this abundant beebread–although this colony appears to have abundant beebread, in fact, the fungal spores are unhealthy to the hive. In my area, hives full of such spores go downhill, unless we feed them all the pollen sub that they will eat. See “Fried Eggs” Identified!
Back to nosema sampling, one of the major beauties of the Quick Squash method is how quick it is, since you don’t need to count spores at all (Fig. 7)!
Practical application: After a bit of practice, my turnaround time for the entire process of preparing, viewing, and recording results for 10 bees (two 5-bee slides) is just over four minutes if I don’t fumble something along the way. Tip: have plenty of precut cover slips at hand in a small bowl.
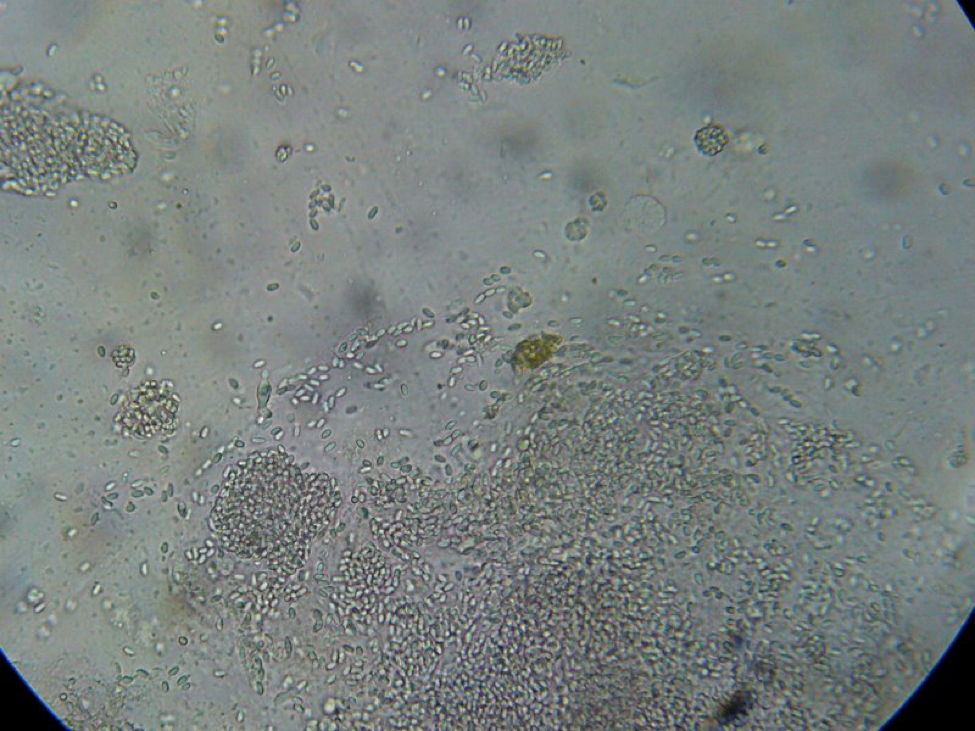
Figure 7. This is a view of the far left-hand squash from an older bee, whose gut does not contain pollen. Even though the preparation looked nearly clear to the naked eye, it is easy to see the degree of nosema infection.
Viewing individual bees gives you a much better idea of just how greatly the gut contents of bees vary from bee to bee within the same hive! Sometimes each of the 5 gut contents look completely different. All that I can say is that bees have a lot of different things going on in their guts, and numerous infections, most of which I can’t identify (Fig. 8).
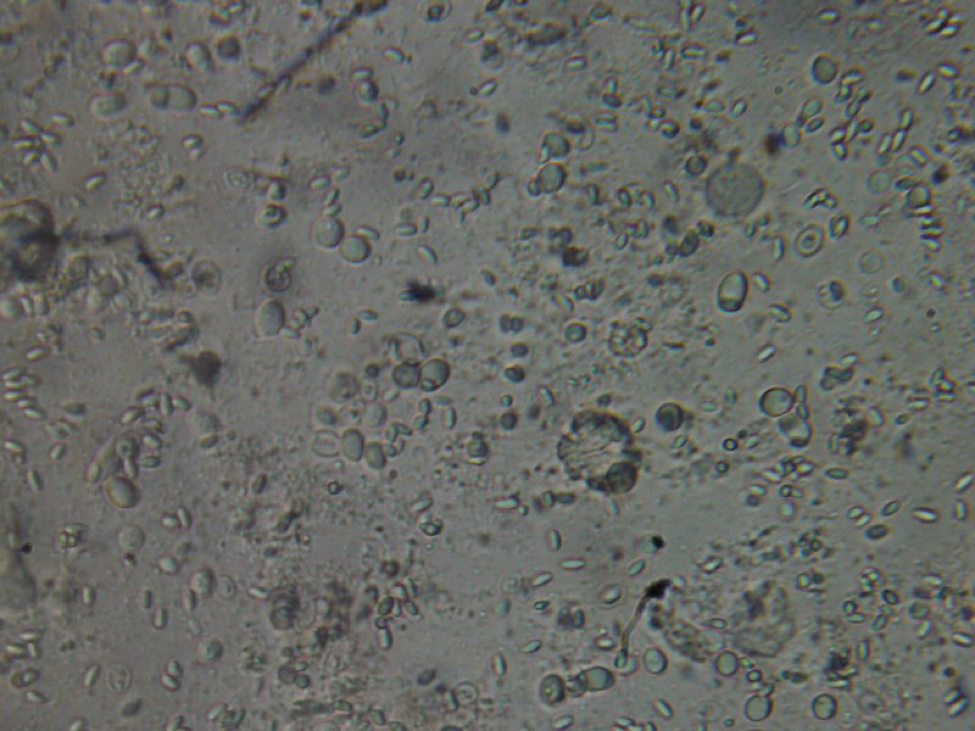
Figure 8. This poor bee is suffering from both Nosema ceranae and what appears to be a Malpighamoeba mellificae infection (the larger oval cysts). Amoeba infection is not something that most beekeepers even consider, but I find it commonly in failing hives.

Malpighamoeba mellificae in the Malphigian tubules of bees © Institut für Saat – und Pflanzgut, Pflanzenschutzdienst und Bienen Abteilung Bienenkunde und Bienenschutz –
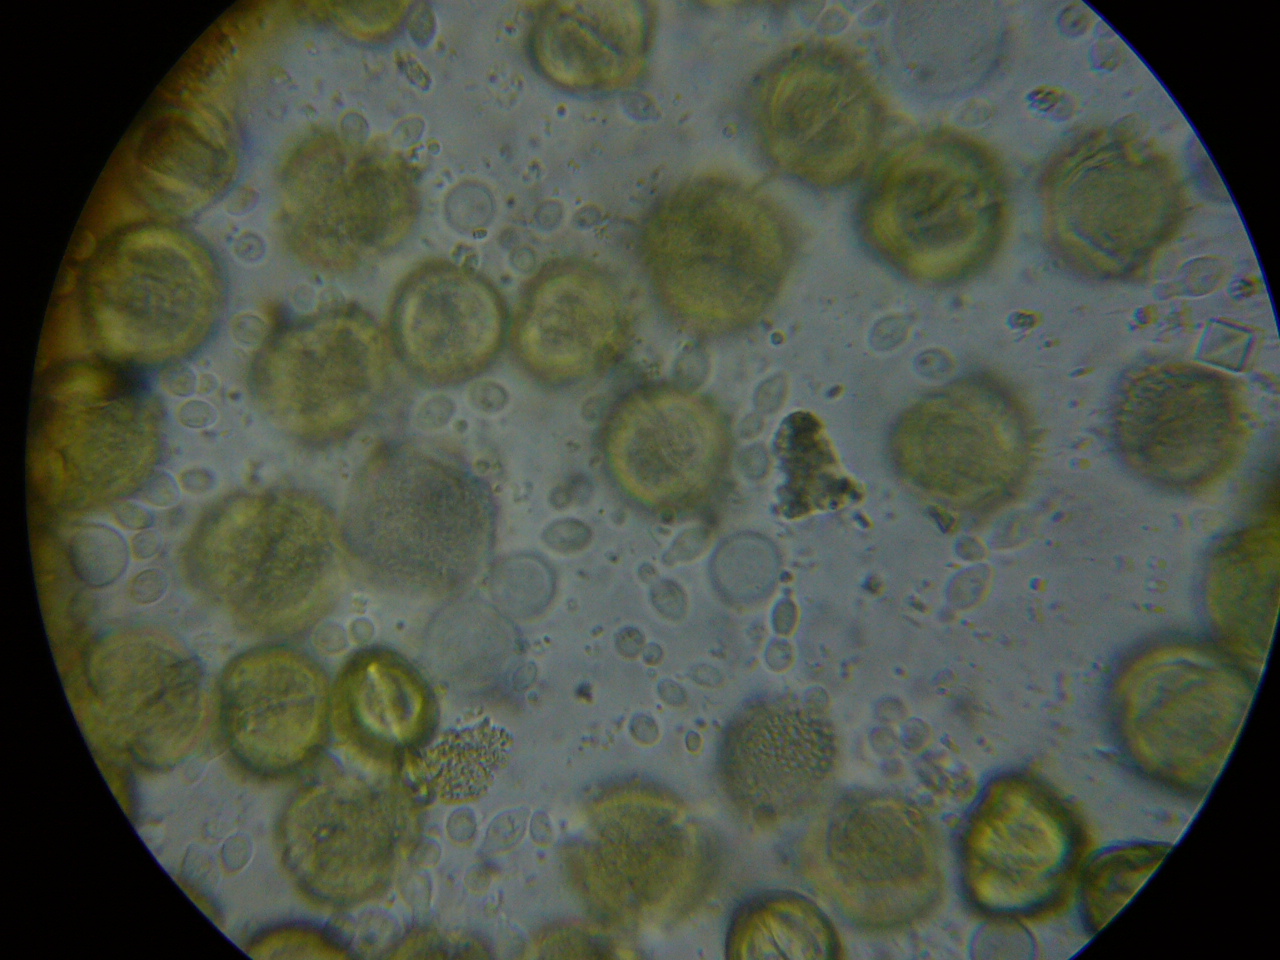
I’m not a microbiologist, and have trouble differentiating yeast cells in the gut from amoeba cysts. Here’s a photo of beebread to which I added a weak sucrose solution, and allowed to ferment. I’m guessing that the cells between the pollen grains are yeasts. If anyone can help me, please let me know!
This method takes less time than a standard hemacytometer count, yet provides you far more useful information.
Economic analysis: A scope (which will last the rest of your life) costs less than the rental rate for two hives in almonds. You can easily run a dozen of these samples in an hour, which would give you a good idea of the infection rate for the weaker hives a 50-hive apiary. This method can quickly let you know if you have a serious nosema problem. On the other hand, bottle of fumagillin to unnecessarily treat those 50 hives would set you back $140, plus syrup and labor.
Update: time and again I’ve had beekeepers tell me that they’ve been trying to control dysentery by feeding fumagillin. When I ask them to send me bee samples, I often find that there is no nosema present, suggesting that they’ve been blaming the wrong suspect! As far as I can tell, nosema does not cause dysentery–this is a common misconception. Dysentery can spread nosema in the hive, but it doesn’t appear to be an indicator of nosema.
There is nothing new about knowing that measuring the infection rate is a better assessment of nosema infection than that of taking spore counts—Dr. White made that clear back in 1919, and it has been confirmed again and again. The problem has always been that it is simply too tedious to individually squash hundreds of bees (Dr. White individually squashed and microscopically viewed over 3000 bees). What has always been lacking is a time-efficient way to determine the infection rate, and that is what I tried to develop with this “Quick Squash” method. Shy of an automated device, this method may be the best practical assessment of colony infection rate, and appears to have a reasonable degree of accuracy.
Validation
OK, so this past week I took samples from the strongest hives and from dinks in some of my yards, and have so far processed a total of 40 samples (I still have a backlog at press time, and favored the samples from weak hives). I’ve graphed the results below (Fig. 9):
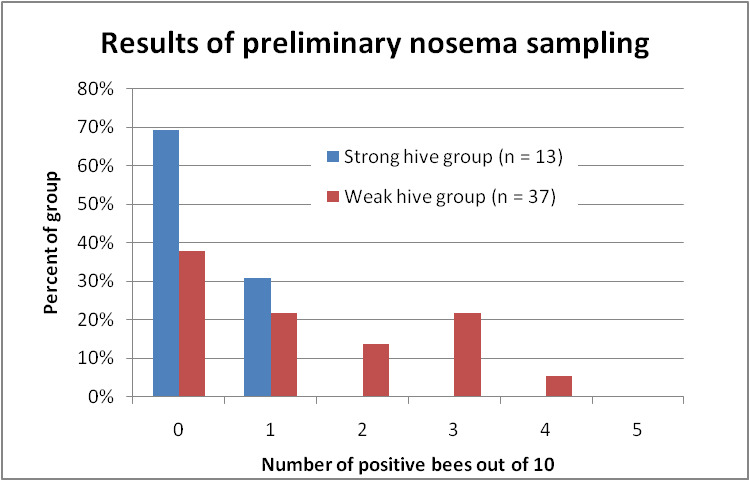
Figure 9. Distribution of nosema prevalence in the weakest and strongest hives in my apiaries in early December, based upon 10-bee samples taken from under the lid or outside combs. In none of the strong hives were more than 1 bee out of 10 infected; whereas the majority of the weak hives scored at least 1 or more infected bees out of 10, and 40% scored 2 or more positives.
The preliminary data above strongly suggest that Nosema ceranae infection is associated with colony weakness in my own operation, which is not surprising, based upon the vast body of previous research on the negative effects of nosema! At this point in time, I am rather disillusioned with any field research findings based upon spore counts, and hope that other researchers follow the lead of Dr. Mariano Higes and include the percentage of infected bees.
Practical application: The point of the above graph is that up ‘til this point, I have never been able to correlate N. ceranae infection intensity, based upon spore counts, with either colony health or production. But when I switched to a different assessment method—quantifying nosema prevalence based upon the number of infected bees in a sample of 10—the relationship jumps right out!
Summary (completely subject to revision):
Early spring and early fall are likely the most appropriate times to sample, or during winter if you’re going to almonds. No need to look for nosema in July or August, as it normally “disappears” during that time.
- Take samples any time of year from any colonies or yards that appear to not be performing well—lagging, poor weight gain, lack of foragers or bees over the brood. I’m not sure whether it’s worthwhile to routinely bother with taking nosema samples, provided that your colonies are not under stress, and so long as they are kicking butt.
- Brush a dozen bees from under the lid or an outside comb into a ziplock bag, and add a glug of rubbing alcohol (for long-term storage use bottles and additional alcohol, or freeze). If you wish to label the sample, make sure the marker is alcohol resistant, or write with a pencil and put the label inside the bag.
- (Alternate assessment) Process about 50 bees by the ziplock method (see Sick Bees Part 12). If you see fewer than about 5 spores in a field of view (about 1M equivalent), then you’ve got nothing to worry about. If more, go to the next step.
- From each sample, prepare two slides of 5 bees each per the “Quick Squash” method in this article.
- Interpret the entire 10-bee sample as follows:
- 0-1/10 positive for spores–likely safe
- 3/10–likely moderate infection
- 4/10–likely serious infection
- >4/10– very likely serious
- Be concerned any time that you hit 2 or more positive bees out of 5.
- The odds of hitting 3 or more bees out of 10 climbs rapidly with infection rate—to a definitive 95% chance once half the bees in the hive are infected!
- 6. I feel that it is likely not worth the effort to sample more than 10 bees from any single hive–10 bees should give you a fairly close estimate of infection prevalence in that hive. Better to spend the time sampling more hives!
- 7. Important: don’t base any management decisions upon only a single sample! Keep sampling until you are comfortable with the consistency of the results.
I realize that I just threw a lot of numbers at you, but in practice the method is really intuitive. It’s very much like playing poker—your brain easily grasps the probabilities of getting either one ace or four in a hand. Chances are that you’ll get more positive hits from colonies with a serious nosema infection, and few or no hits from healthy colonies.
Processing bee samples by this “Quick Squash” method offers an easy way for beekeepers to monitor whether nosema is actually a problem in their operations. It takes me less time to process a 10-bee sample than it does to do a single hemacytometer count, but the results of this method are much more meaningful from a practical standpoint. The “old school” researchers found this method to be a reliable assessment of the seriousness of nosema infection for N. apis; I suspect (subject to verification) that it may also prove to be the best for N. ceranae.
It sometimes seems that beekeepers need to reinvent the wheel. Anyway, I just came up with this quick method and really like it! My sons mastered the technique in a couple of tries. My favorite part is that I no longer need to count spores—a quick glance gives you a yes/no for infection. I’d be a happy guy if I never had to count another varroa mite or nosema spore—I’d much rather be counting all the money I’ll be making from my healthy hives!
I feel that it is time for a paradigm shift in the way that we assess the impact of nosema infection upon colonies—moving from spore counting back to determining the proportion of infected bees! To that end, this method is practical and surprisingly quick, and gives you a much better idea of what’s actually happening in the hive. I’d really appreciate hearing your results or suggestions for improvement if you try it (randy@randyoliver.com).
More Details—Web Version
I’m not looking to belabor the point of the reliability, or lack thereof, of spore counts, but I feel that this is an important enough issue to the beekeeping industry, in light of potential reduced honey production, increased colony mortality, and the cost of treatment, that interested beekeepers have a thorough understanding of the strong and weak points of various sampling methods.
The key question then is whether researchers, testing labs, and beekeepers can all agree upon a “standardized” method of testing, so that we can all compare results and recommendations. The current problem is that spore counts, even from the same colony, are frustratingly variable, depending upon the time of day at which the bee samples are taken (Fig. 1), the weather conditions, the place in the hive from which they are taken, the number of bees in the sample, how they are processed (mortar and pestle, filtration, squashing, etc.), how they are viewed (simple microscopy or hemacytometer), and even then counts are largely based upon the pure chance of whether or not one gets one or more highly-infected old bees in the sample!

Figure 1. Spore counts of four 25-bee samples taken each day from the same hive—from the entrance or the inside, and at either 9:30am or 12:30 pm. Note that counts on the same day varied from nearly zero to 10M spores—testament to the inherent variability of spore counts! It is also unlikely that the infection level varied as greatly from week to week as the data suggest. This finding really makes me question the comparability of spore counts unless they are taken at exactly the same time of day, under similar weather conditions, and from the same place in the hive each time! Data reworked from Meana (2010).
The colony sampled in Figure 1 was presumably moderately-infected, but in apparent good health. The researchers concluded, “This strong variation in the spore count was not associated with signs of illness and indeed, the colony was apparently as healthy (asymptomatic) as any other. It would thus appear that the spore count is not useful to measure the state of a colony’s health [emphasis mine].” I echo this conclusion (as do a number of other studies), since while monitoring nosema counts in my own operation over the past four years, I have been unable to detect any correlation between spore counts and colony health, productivity, nor survival.
The above authors conclude that “the mean proportion of infected bees may be a more reliable method to establish colony health.” This suggestion goes right back to Dr. White’s findings at the beginning of the last century, and has withstood the test of time. I guarantee that looking at the individual gut contents of a sample of 10 bees gives one a much better feeling as to the severity of nosema infection in that hive!
From Where Should We Take Samples?
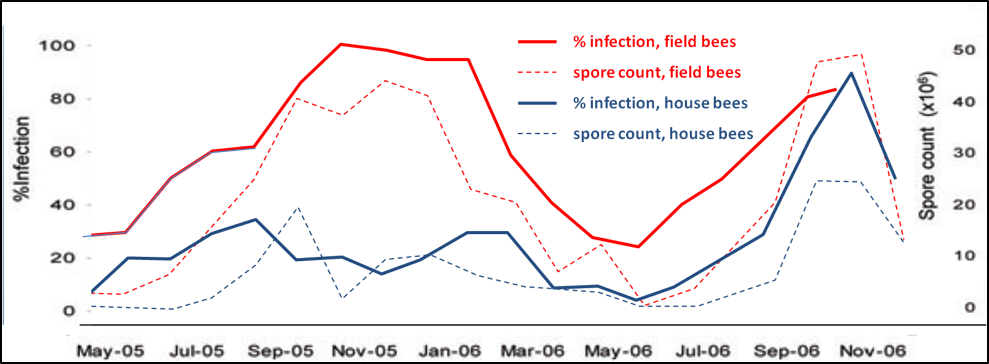
Figure 2. Spore counts vs. percent infection for house and field bees, n = 30 for each sample; all samples taken at 12:30pm. Data reworked from Higes (2008). Note that spore counts roughly reflect the percent infection rate for either group, but that spore counts of house bees may not be a particularly good indicator of the infection rate of field bees, which is likely the best assessment of the impact of nosema upon colony health. On the other hand, in this data set, the infection rates of both house and field bees roughly tracked each other. This data set suggests that spore counts of field bees is the most sensitive measure of the degree of nosema infection in a hive.
Experts’ Opinions
Smart and Sheppard (2011) concluded that: “Based on these findings, we speculate that bees collected from the inner hive cover represent a mixture of age classes of bees and, depending on the goals of the sampler, may provide a better estimate of the whole colony mean infection level than sampling just foragers.
So I asked Dr. Brian Johnson, who had considerable experience with tracking bees in observation hives. He told me:
“The bees just under the lid tend to be older middle age bees, while the bees on the outside combs are mostly middle age bees with smaller numbers of nurses and foragers. In general, the foragers are near the entrance, the nurses are in the brood zone, and the middle age bees are everywhere, but with a slight bias for the honey zone.”
I also asked the preeminent bee behavioralist, Dr. Tom Seeley. His response:
“Interesting question. The only information that I have regarding the age distribution of bees who are spending time just under the lid or on one of the outer combs (i.e., ones without brood) comes from a study that I did back in 1982. In it, I mapped out the locations (in a large observation hive) of various activities and at the same time I took data on the age distributions of the bees performing these tasks. These results make it clear that the middle-aged bees are mainly working in the peripheral (outside the brood nest) regions of the nest. So if bees are collected from these areas during the day, then they will be mainly middle-age and forager-age bees. At night, the percentage of forager-age bees will be higher. You’ve probably seen in observation hives how the foragers literally hang out in the edge areas of a hive at night.”
Finally, there is one more piece of supportive evidence for taking samples from under the lid: Moeller (1956) found that “nosema-infected bees congregate in and above warm brood areas.”
Conclusions
Hey, I’ll leave the conclusions up to you. Today, I did some spore counts of 20-bee samples of piles dead bees from the front of three hives in one yard. They had little nosema—about 5 spores per field of view, so approx. 1M/bee. So not enough spores to indicate that a 10-bee squash would be useful. Since the bees were dead, it would have entailed rehydration in order to do gut squashes.
I also did some Quick Squashes of bees from under the lid for other hives. Each method has its advantages and limitations. The smart beekeeper understands them!
Next Month
Nosema: The Smoldering Epidemic
Acknowledgements
I wish to thank my wife Stephanie for her patience, and helpful comments on my manuscripts (she chokes on math and graphs, and is immensely helpful to me for making my charts more user friendly). As always Peter Borst helped with the research for this article. A special thanks to Dr. Jose Villa, as mentioned previously. Thanks to Dr. Jerry Bromenshenk for his helpful suggestions. And a big thanks to Drs. Mariano Higes, Aránzazu Meana, and Raquel Martín-Hernández for their diligent work on nosema! For financial support toward this research, I’ve very appreciative of Joe Traynor, Heitkam’s Honey Bees, Jester Bee Company, the Virginia State Beekeepers Assoc, and individual beekeepers Paul Limbach, Chris Moore, and Keith Jarret.
References
Botías, C, et al (2011) Critical aspects of the Nosema spp. diagnostic sampling in honey bee (Apis mellifera L.) colonies. Parasitology Research (in press).
Fingler BG, WT Nash, and TI Szabo (1982) A comparison of two techniques for the measurement of nosema disease in honey bee colonies wintered in Alberta, Canada. ABJ 122(5):369-371.
Forsgren, E, and I Fries (2010) Comparative virulence of Nosema ceranae and Nosema apis in individual European honey bees. Veterinary Parasitology 170: 212–217.
Frazier, MT, et al (2000) A sequential sampling scheme for detecting infestation levels of tracheal mites (Heterostigmata: Tarsonemidae) in honey bee (Hymenoptera: Apidae) colonies. Journal of Economic Entomology 93(3):551-558.
Higes, M, et al (2008) How natural infection by Nosema ceranae causes honeybee colony collapse. Environ Microbiol 10: 2659–2669.
Mattila HR, and GW Otis (2007) Dwindling pollen resources trigger the transition to broodless populations of long-lived honeybees each autumn. Ecol Entomol 32:496–505.
Meana, A, et al (2010) The reliability of spore counts to diagnose Nosema ceranae infections in honey bees. Journal of Apicultural Research and Bee World 49(2): 212-214.
Moeller, F.E., 1956. The behavior of nosema infected bees affecting their position in the winter cluster. J. Econ. Entomol. 49 (6), 743–745.
Oliver, R (2008) The Nosema Twins Part 3: Sampling. ABJ 148(2): 149-154. https://scientificbeekeeping.com/the-nosema-twins-part-3-sampling/
Porrini, MP, et al (2011) Nosema ceranae development in Apis mellifera: influence of diet and infective inoculum. Journal of Apicultural Research 50(1): 35-41
Smart, MD and WS Sheppard (2011, in press) Nosema ceranae in age cohorts of the western honey bee (Apis mellifera). J. Invertebr. Pathol. doi:10.1016/j.jip.2011.09.009
Tomasko, M. Finley, J. Harkness, W. Rajotte, E. 1993. A sequential sampling scheme for detecting the presence of tracheal mite (Acarapis woodi) infestations in honey bee (Apis mellifera L.) colonies. Penn. State College of Agricultural Sciences, Agricultural Experiment Station Bulletin 871.
Traver, B., and RD Fell (2011a) Prevalence and infection intensity of Nosema in honey bee (Apis mellifera L.) colonies in Virginia. J Invertebr Pathol 107 (1):43-49.
Traver, BE MR Williams, and RD Fell (2011b; in press) Comparison of within hive sampling and seasonal activity of Nosema ceranae in honey bee colonies. Journal of Invertebrate Pathology.
White, GF (1919) Nosema-Disease. USDA Bulletin No. 780.
Author’s Note
Samples from Within the Hive
Soundbite Science
Infection Rate
So How Did We Get on the Wrong Track?
How to Determine the Colony Infection Rate
So What if I Count the Number of Infected Bees out of 10?
An Assessment of Our Situation
One HUGE Assumption
Validation of the Method
Update
Sequential Sampling
A Neat Little Shortcut
Which Hives to Sample?
What Time of Year?
From Where Should You Take Samples?
Practical Application: Completely Subject to Revision
Adds
Follow Up on the Quick Squash Method
Infection Prevalence
From Where Should We Take Samples?
Next Month
Acknowledgements
References
Sick Bees 15:
An Improved Method for Nosema Sampling
Randy Oliver
ScientificBeekeeping.com
In the previous articles in this series I showed how to use a microscope to view nosema spores and discussed from what part of the hive to take bee samples, and how researchers are interpreting spore counts. But spore counts don’t tell us what we really need to know!
Author’s Note
I’m hoping that the reader is benefitting from my digestion and summarization of current (and past) nosema research. There is a tremendous amount of information out there (much of it conflicting or confusing), but I’m trying my best to condense and simplify it into terms meaningful to Joe Beekeeper. The frustrating thing, though, is that it is clearly apparent that we still have a great deal more to learn about these parasites before anyone can make definitive recommendations as far as best management practices!
So my apologies in advance for the length and depth of this article. But I’m going someplace different, and feel that it would benefit the reader to follow the history and thought process that led to the conclusions that I reach at the end.
Samples from Within the Hive
Most researchers take bee samples for nosema testing from under the lid, or from an outside comb, since such samples are generally easier to take and presumably more consistent as far as bee age structure. The expectation also is that such a sample would be most representative of the colony infection as a whole, as opposed to samples from the entrance, in which spore counts are often sky high, or samples of nurse bees, in which counts are generally minimal. The assumption, of course, is that a “peripheral” sample would contain mostly mid-aged and older bees.
In early November, I had the pleasure of being visited by Dr. Dewey Caron, so I used the opportunity to put the above hypothesis to the test. We had experienced rainy weather and cold nights the two previous days, so the bees had not foraged nor broken cluster during that time. We went out to the bee yard and took samples of bees from the outermost portion of the cluster, from honey frames in the upper hive body (the bees were in fairly tight cluster, so I doubt that there had been much bee movement in the past two days).
As I illustrated in Figure 6 of my previous article, it is a normally a relatively simple matter to determine the “age” of the bees in a sample by seeing how much pollen is in their guts—it is generally assumed that only young bees (nurses) consume pollen. So we froze the bees and then spread them on a grid and crushed them to squash out their gut contents. As you can see in Figure 1, to our great surprise, the vast majority of bees in the samples from the three hives that we tested had guts full of pollen!

Figure 1. A sample of crushed bees from the periphery of the cluster (on an upper honey comb) after two days of confinement by cold weather in early November. Note that every single bee’s gut was full of pollen (the orange stains), indicating that they were likely nurse bees, rather than older bees, and thus would be less likely to be infected by nosema.
We confirmed by microscopy that the orange coloration of the gut contents was indeed due to pollen grains. I have done similar squashes during summer, and again found substantial proportions of bees throughout the hive to have pollen in their guts, as opposed to bees in entrance samples, which rarely contain appreciable pollen. In the sample illustrated above, the extremely high proportion (100%) of bees containing pollen could possibly be due to the population turnover in November, when the forager bees fly off to die, leaving only young bees in the hive to winter (Mattila and Otis 2007). I have not yet confirmed this.
Practical application: So I’m not clear at this point whether these pollen-filled bees are chronologically old bees or not!
Another interesting finding that we made was that in a 50-bee subsample of one of the above samples, the spore count (which appeared to be N. ceranae), was about 100 spores in a field of view, indicating an infection level of about 20M. This high count in ostensibly young bees caught my attention, so I squashed individual bees one at a time—in the first six, only one of them contained an appreciable number of spores. Apparently, in the 50-bee sample, a few highly-infected bees skewed the spore count to that alarming level (Fig. 2). My point is that you should not allow any individual spore count to scare you!
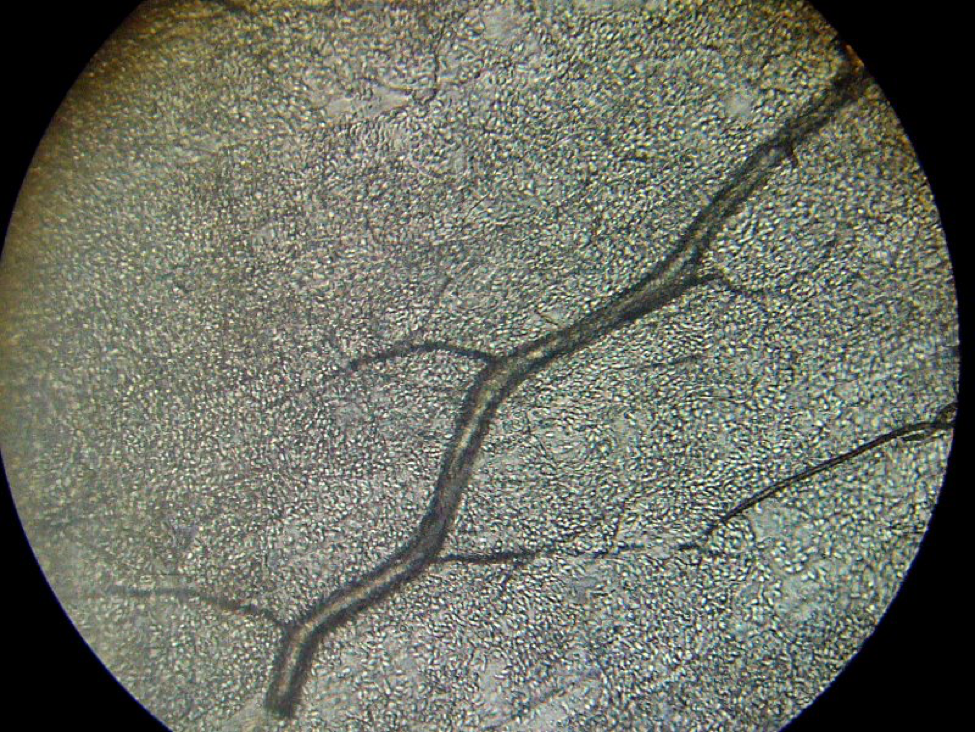
Figure 2. One highly-infected bee can really skew a spore count! This photo, taken at 400x, shows thousands of nosema spores packed into the Malpighian tubules (bee “kidneys”), which are running at an angle crossways. The treelike structure is a tracheal (breathing) tube. A bee infected to this degree could contain 500 million nosema spores!
Practical application: I would normally have been alarmed by a mean spore count of 20M in a sample of fifty young bees, but upon closer inspection, most of the bees in the subsample of 6 bees were not infected to any degree.
I have written extensively about varroa. Varroa is easy to monitor, and if one makes an effort to understand its well-documented biology and population dynamics, then it is a relatively straightforward matter to make wise and effective management decisions for controlling its degree of damage to bee colonies. Unfortunately, we are nowhere near that state of confidence with N. ceranae. Worldwide data from actual field studies are so conflicting that no one can really make meaningful recommendations as to what level of infection, based upon simple spore counts, is economically tolerable. Add to that, there are potential down sides to treatment—first, fumagillin’s expensive, it may have negative side effects upon bee health, may contaminate honey (and is not approved in many countries), and many beekeepers simply are adverse to adding one more danged treatment to their hives (Figure 3). I will discuss the above concerns, as well as the potential consequences (or lack thereof) of untreated nosema infection in later articles.
Practical application: I seriously question whether spore counts can be translated into meaningful treatment thresholds!
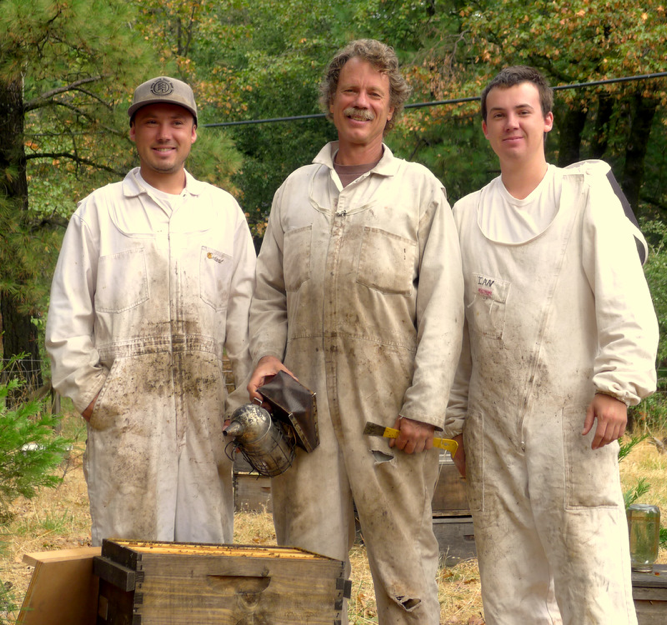
Figure 3. Let me warn you, that if you actually start sampling for nosema, it will give you much more to worry about! When we find high spore counts here at WishWeKnewWhatWeWereDoing Apiaries, my sons (Eric, on left, and Ian) and I worry about filling our almond pollination contracts.
Until recently, I pretty much blew off Nosema ceranae as not being much of an issue in my operation, despite finding spore counts in the millions or tens of millions, especially in spring. Our colonies have generally fared well, and I haven’t noticed any strong correlation between colony strength and nosema counts. However, I’m a bit uneasy since spore counts have seemed to climb each year, and are higher this season than ever.
What most troubles me, though, is recent evidence that nosema is more of a problem in colony health and mortality than I have previously suspected—I will be covering this in subsequent articles in this series (I often am forced to choose which subject to cover first). So I’m in the same boat with the rest of you who are wondering how best to diagnose the degree of nosema infection in your operations, and whether treatment would be worthwhile.
Soundbite Science
We currently live in an age of information overload, largely due to the internet, with snippets of knowledge thrown at us faster then we can put them all together. This is a mixed blessing with scientific research, as sometimes quality is sacrificed in the race to be first to report some finding. Due to competition for limited funding, we are seeing a lot of “soundbite science” being published by grad students and post docs fighting to make a name for themselves, or faculty needing to “publish or perish.”
But back in the day, the government subsidized the kind of painstaking, grinding, and detailed agricultural research seldom seen today. To see an example, download Dr. G.F. White’s 1919 exhaustive 9-year study on nosema (Google Books “bulletin 780 nosema”) undertaken after he discovered its presence in the U.S. —these guys with a government mandate were thorough! In this age of budget cutting and taxpayer support for giant agribusiness (less than 2% of USDA spending goes toward research these days), there is a strong case to be made for we beekeepers to encourage government funding of bee research.
Dr. White concluded:
“As a rule, colonies which in the spring of the year show less than 10 per cent of Nosema-infected bees gain in strength and the losses are not detected. This is often true also in cases where the infection is somewhat greater than 10 per cent. When the number of infected bees approaches 50 per cent the colonies become noticeably weakened and in many instances death takes place. When more than 50 per cent are infected they become weakened and usually die as a result of the infection. Generally speaking, therefore, it may be said that when a colony contains less than 10 per cent of Nosema-infected bees the prognosis is excellent; that when it contains more than 10 and less than 50 per cent the prognosis is unfavorable; and that when the number of Nosema-infected bees present approaches 100 per cent the prognosis is especially grave.”
Pay attention: This prognosis is remarkably similar to that of Higes (2008)—that the tip point for colony health appears to occur when more than about 40% of the bees in the hive become infected (a 40% infection rate). The practical application is that spore counts may not be the best way to assess the impact of nosema infection upon colony health—it may be more important to determine the relative proportion of infected bees to healthy bees.
I will continue to return to Dr. White’s findings in this series, as well as those by Dr. Mariano Higes and his collaborators in Spain, in which, by the way, there are about the same number of hives as in the entire contiguous U.S., in approximately 1/15th of the land area! What strikes me is the similarity in their conclusions, nearly a century apart, when they discovered, and then thoroughly investigated, nosema epidemiology and pathology in their respective countries!
Infection Rate
The proportion of infected bees in a hive is called the infection rate, and expressed as a percentage—if a quarter of the bees are infected, that would be a 25% infection rate. Remember, a colony of bees is a superorganism, with each individual bee somewhat akin to a single cell of your own body (of which millions die every day). A colony can easily handle the loss of a certain percentage of sick bees every day, especially if those bees are aged, and nosema infection is generally worse in the oldest bees (since aging allows more cycles of parasite reproduction within the bee).
Dr. White suggested that an average of about 10-15% infected bees in a hive is “normal.” The rate in sick hives could go up to 100%! He found that the infection rate would often go to 70% in experimentally-inoculated hives.
So let’s digest this. If only, say, 5 percent of the bees in a hive were actually infected (and only seriously infected during their last days of foraging life), the overall nosema infection would have little impact upon the colony, as they would be quickly replaced by the 1500-2000 new bees emerging each day. However, if 50 percent of the bees were infected, then that is entirely another matter! During the spring and summer, their shortened lifespan could seriously affect the population dynamics of the hive, reining back its normal population growth and ability to forage. And during the winter, when bees must live to a ripe old age in order for the cluster to survive until spring, a high nosema infection rate could lead to colony collapse. I will return to the details of this subject in an upcoming article.
Practical application: Nosema can be a serious problem during either winter or spring, should a high proportion of bees in the hive become infected. The infection rate is a more accurate measure of the seriousness of the infection than is a mean spore count, since a high spore count may merely reflect that one or a few highly-infected bees happened to be in the sample.
So why have we been focusing on spore counts, rather than infection rate? I just got off the phone with a large commercial queen producer who has closely tracked N. ceranae levels (and spent a large amount of money on treatments). He has nearly given up on looking at spore counts, since they simply did not appear to correlate to any significant degree with colony health and production. Ditto for my operation, and for much of the worldwide research. I feel that it is time for us to move beyond spore counts!
I’m not the only one who feels this way. Dr. Higes team’s recently entreated: “There is an urgent need … to decide on the reliability of standard methods to establish the levels of infection, a measure that will be necessary to standardize procedures to accurately, reliably and meaningfully quantify the degree of Nosema infection in honey bees” (Meana 2010). It’s time for a paradigm shift of moving away from sample means, and to go back to looking at the actual percentage of infected individual bees.
So How Did We Get on the Wrong Track?
Good question! I’ve always wondered how the 10-bee sample size figure ever got engraved in stone. It appears that it evolved from a statement by Dr. White himself, who wrote that “Ten bees from a colony constitute a satisfactory sample as a rule.”
So 10 bees became the typical sample size from the early 1900’s until we found out that we had N. ceranae. At that point, I was misled by “discovery sampling” statistics (Oliver 2008), since I thought that I needed to “discover” whether I had nosema in my operation, and thus recommended taking samples of at least 50 bees. This number (or even 100) is commonly used by researchers these days, since it also helps to minimize the influence of any single highly-infected bee upon the mean spore count.
Unfortunately, many of us became seduced by the attractiveness of thinking that the number of spores counted in a hemacytometer actually reflected the seriousness of an N. ceranae infection in a hive. Fifty-bee samples are good for discovery, but in truth, once you’ve discovered that you have N. ceranae in your operation, they actually can be misleading. Here’s the funny thing: Dr. White’s 10-bee samples are actually a better assessment of the seriousness of a nosema infection! But when he recommended 10-bee samples, he wasn’t talking about counting spores! What he actually recommended was:
“When a diagnosis of the disease is being made in practical apiculture, therefore, considerable caution should be observed. A colony showing only a small percentage of Nosema-infected bees and not other evidence of the disease is practically healthy. In reporting the presence of infection it would seem well to indicate in some way the amount of infection present. The percentage of infected bees among those examined might be given.”
This is a major point! Nosema infection at the colony level is not about spore counts—rather, it is about the percentage of the bees that are infected!
So why the heck did most everyone go from determining the infection rate to counting spores? Well, several researchers found that, at least with Nosema apis, spore counts of a 10-bee sample roughly correlated with infection rate. Then some Canadian scientists (Fingler 1982) found that a 25-bee sample was an even more “reliable method of assessing the degree to which colonies are infected by nosema.” But again, those researchers clearly understood that spore counts were merely crude proxies for the actual rate of infection. I doubt that beekeepers (or even many subsequent researchers) ever fully grasped that message.
So is a 10-bee sample enough? Look at it this way: since a single nosema-infected bee typically contains more than 10M spores (Forsgren 2010; Smart 2011), then having even one single infected bee in a 10-bee sample (indicating > than a 10% infection rate) would put the mean spore count above 1M—the typical rule of thumb for treatment. So what’s the chance of hitting at least one infected bee in a 10-bee sample.
In order to answer this question, we need to use probability theory, which was ironically, initially developed to help gamblers make better decisions in games of chance. As an aside, doesn’t it seem funny that the ABF national convention is going to be in Las Vegas? I mean, commercial beekeepers already live their lives gambling their life savings on the weather, the price of honey, varroa treatments, and honey flows, and are going to be in Las Vegas just before the big roulette wheel stops spinning and tells them whether they’ll hit the jackpot in the almonds the next month!
But I digress. Probability theory can be used to predict, for example, the chance of being dealt two aces in a hand of five cards (4/52 x 3/51 = 1/221, or less than half of one percent probability). Bee samples can be looked in a similar manner, since when you are squashing bee guts, nosema infections generally show as either positive (tons of spores) or negative (zero to a very few spores)—sort of a sick/not sick litmus test. So I did some homework with probability tables, and was able to answer my question about hitting 1 infected bee out of 10 (Figure 4).
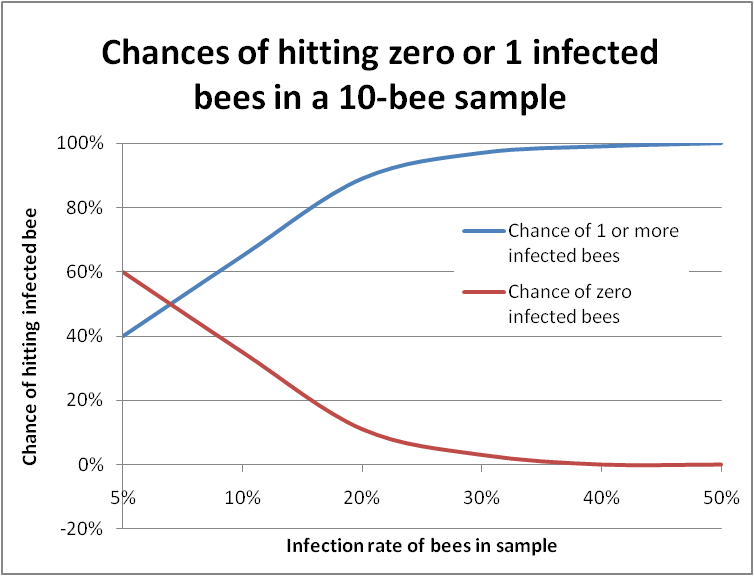
Figure 4. In this graph the bottom scale is the actual infection rate of the colony. The blue line plots the chance of hitting at least one infected bee in a sample of 10 bees. The red line indicates “negatives,” in which you would not find a single infected bee. You can see that it’s almost impossible to miss getting at least one infected bee in a 10-bee sample if the colony infection rate is over 30%.
So the 1M spore rule of thumb is very conservative, meaning that you certainly wouldn’t miss a nosema infection, but also means that you’d often wind up feeding fumagillin to apiaries that in actuality were dealing just fine with relatively “safe” infection rates. In the case of N. ceranae, in which individual bee spore counts may exceed 100M, having even a single infected bee would result in a mean spore count of 10M, which might scare the pants off you, despite the substantial likelihood that the colony was only infected at a minimal rate!
A recent study by Traver and Fell (2011a) supports the above interpretation—they found that colonies that tested low for nosema DNA exhibited zero spores in 10-bee samples about a third of the time, whereas samples from colonies with “high-level” infections seldom were free of spores. So it appears to me that the good old 10-bee spore count works fairly well as a crude but conservative proxy for the actual infection rate, with spore counts stepping up sharply with each additional infected bee in the sample. However, it should not be interpreted as any sort of linear measure of the degree of infection. It worked, but it likely led to too many unnecessary treatments.
The problem with spore counts: spore counts from a pooled homogenate of many bees are more or less a measure of the reproductive success of nosema in a relatively few bees. The infection rate (percentage of bees actually infected) is a much better measure of the actual impact of nosema upon colony health.
How to Determine the Colony Infection Rate
OK, I hope that I’ve convinced you now that it’s time to move away from counting spores—but that certainly doesn’t mean that you should throw away that shiny new microscope that I earlier convinced you to buy!
You may have wondered why, when I was squashing bees in my kitchen with Dr. Caron, that I stopped after crushing only six bees. Well, in truth, squashing individual bees is time consuming, and my gut feeling was that I would have hit more than one infected bee in the sample should the actual infection rate have been high.
Of course, my readers should know that I’m not about publishing “gut feelings.” So, being the curious sort of guy, I bit the bullet and plowed into an investigation to see whether I could come up with some sort of shortcut for determining a colony’s infection rate without having to individually squash a whole bunch of bees. I spent some serious time working out the math (much to my long-suffering wife’s dismay, such as when she groggily walked into the kitchen first thing in the morning, and was immediately barraged by me excitedly showing her the results of some probability calculations that I’ve been working on since before dawn).
My personal issues aside, what I found was that the problem with extrapolating from samples is that you want to avoid false negatives (missing a serious infection; easy to do with samples of only a few bees), while at the same time not misdiagnosing false positives (erroneously concluding that a healthy hive is seriously infected—which is a problem with the mean (average) spore count from of a pooled bee sample).
Scientists just love hard, accurate figures out to the third decimal place, with 99% confidence levels. But in reality, there is rarely that kind of certainty when you’re dealing with any data derived from bee samples! And there’s a lot of elbow room when making management decisions. So first, let’s perform a reality check. Suppose that you have a colony that is infected at the 40% rate, and that the infected bees are evenly distributed in the hive. And then suppose that you take a sample of 100 bees from that colony.
You’d expect that the sample would contain 40 infected bees (40 per 100 = 40%). And the average sample would indeed contain 40 bees. But no single sample is an average! Any single sample has only an 8% chance of containing exactly 40 infected bees!
That’s fine, you say—all that I really care about is whether that sample contains at least 40 bees. The chance of that happening with a single sample of 100 bees is still only 54%! You would still get 46% false negatives. A 46% chance at losing a bet isn’t bad if you’re betting five bucks in Las Vegas. But it’s pretty poor odds if you’re risking your bee operation on it!
Motivational message: For the arithmetically-challenged among you whose eyes are starting to glaze over because I’m using three-syllable words and talking about math, please hang in there!
So What If I count the Number of Infected Bees Out of 10?
You’d sure think that this would make sense! After all, Dr. White recommended this method. But surprisingly, it’s not that accurate. Let’s look at the probabilities. Suppose that a colony is actually infected at the 40% rate, and that you took a perfectly representative sample of 10 bees. You’d still have only a 25% chance of finding exactly 4 infected bees (but a 67% chance of hitting between 3 and 5 bees). So counting the number of infected bees in a 10-bee sample will give you only a very rough assessment of the actual infection rate.
But here’s a big surprise–counter intuitively, as the sample size goes down, your chances of missing that infection actually go down too! For that same 40% infected colony, here are the probabilities of underestimating the infection rate (Table 1):
| Sample Size |
Probability of getting fewer than 40% infected bees in the sample |
| 100 |
46% (46 times out of 100) |
| 10 |
38% |
| 5 |
34% |
Table 1. Probabilities of underestimating the infection rate of a colony in which 40 out of 100 bees were actually infected, by sample size (number of bees in the sample), assuming a perfectly representative sample.
I’m hoping that you’re catching my drift here—that we may be able to streamline the process of estimating the degree to which a colony is infected, by utilizing 5-bee samples.
An Assessment of Our Situation
So let’s review where we stand with regard to nosema sampling methods and interpretation:
- We want to avoid dangerous false negatives, since they might lead you to not treat a truly sick apiary.
- However, you (and your bees) could live with false positives, since the worst that you’d do is to give unnecessary treatments.
- But you’re still a penny pinching beekeeper who doesn’t want to waste money (or you don’t want to use treatments for other reasons).
- Sending a sample of 10 bees to the lab for a spore count has an unacceptably high rate of false positives—at least two-thirds of the time.
- Spore counts of even 25-bee samples of either house or forager bees are still unreliable predictors of colony health (Meana 2010).
- And even individually squashing 10 bees one at a time will underestimate a serious 40% infection rate over a third of the time!
So what to do? I’m not telling you all this merely to frustrate you—I and my sons live off the income from our bees, so I’ve got a vested interest in finding a way out of this quandary! Researchers worldwide are coming to the conclusion that simple spore counts generally have little correlation with observed colony health status. What you really need to know is one of two things—are your bees in the “safe” zone (under 20% infected) or in the danger zone (over 40% infected). And what you don’t want to do is to spend all day squashing bees one at a time and viewing their guts under a scope. Are we all agreed on the above?
So I got out the probability tables, a pocket calculator, found a handy online binomial distribution calculator (http://stattrek.com/Tables/Binomial.aspx), and started playing with the numbers. I found that for our purposes of differentiating between a benign nosema prevalence and serious infection,that the sweet spot for sample sizes lies in the range of 5-10 bees (sort of a Goldilocks “not too many, but not too few”). See for yourself (Fig. 5):
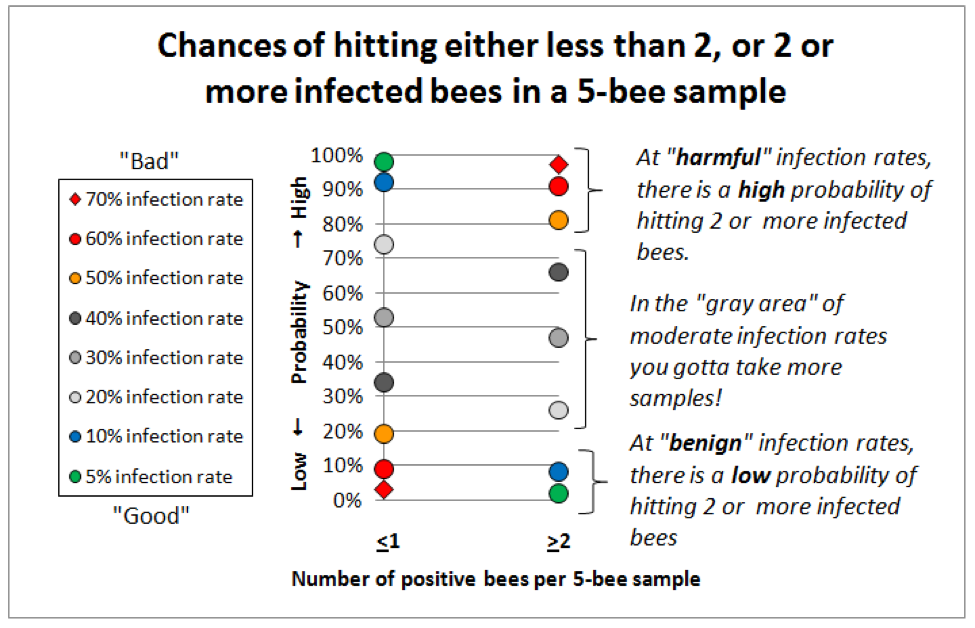
Figure 5. This graph is for 5-bee samples. Compare identical colored markers between the left column and the right column—the greater the vertical spread, the better the discrimination between infection rates. Note that at “benign” infection rates (green and blue dots) you’d nearly always hit either zero or 1 infected bee, but rarely 2 or more. At dangerous infection rates (red markers) the reverse holds true—you’d rarely hit zero infected bees (not shown), and seldom even 1, but nearly always at least 2 positive bees if the colony infection rate exceeded 60%. I will post this article to ScientificBeekeeping.com for handy reference.
One HUGE Assumption
All of these probabilities are contingent upon your taking a representative sample that reflects the overall infection rate of the hive. Would this be the case in real life? Would 5-bee samples give consistent results? I didn’t know, so l decided to put it to the test the day before I sent this article off to press!
Validation of the Method
The “boys” and I were treating colonies with an oxalic acid dribble in November (bees were still flying most days), so I took samples of bees from the weakest hives in each yard, and later processed subsamples of 5 bees at a time. Here are the results (Table 2):
|
Colony number
|
Number of nosema-positive bees per 5-bee sample, and (below) per 10-bee sample (by subsequent pairs)
|
Overall infection rate of sampled bees
|
Notes
|
|
1
|
0/5, 0/5
0/10
|
0/10 =
0%
|
Appeared to be free of nosema. |
|
2
|
0/5, 0/5
0/10
|
0/10 =
0%
|
Appeared to be free of nosema. |
|
3
|
2/5, 1/5, 2/5, 1/5, 2/5, 4/5, 0/5
3/10, 3/10, 3/10, 3/10, 6/10, 4/10
|
12/35 =
34%
|
Only 1 zero in the 5-bee samples. Note the consistency of the 10-bee samples. |
|
4
|
0/5, 0/5
0/10
|
0/10 =
0%
|
Appeared to be free of nosema. |
|
5
|
3/5, 2/5, 1/5, 3/5, 1/5, 1/5
5/10, 3/10, 4/10, 4/10, 2/10
|
11/30 =
37%
|
No zeroes. Only the last pair of 1/5’s would have missed the infection. |
|
6
|
4/5, 0/5, 3/5, 5/5, 2/5
4/10, 3/10,8/10,7/10
|
14/25 =
56%
|
The 10-bee samples certainly picked up the infection! This colony had the most intensely infected bees, plus a serious amoeba infection. |
|
7
|
0/5, 0/5
0/10
|
0/10 =
0%
|
Appeared to be free of nosema. |
|
8
|
0/5, 1/5, 0/5, 0/5, 1/5
1/10, 1/10/ 0/10, 1/10
|
2/25 =
<1%
|
Very consistent results |
|
9
|
3/5, 0/5, 3/5, 1/5, 0/5
3/10, 3/10, 4/10, 1/10
|
7/25 =
28%
|
2 bees were only slightly infected. One 10-bee sample underestimated. |
|
10
|
2/5, 2/5, 3/5, 0/5, 2/5
4/10, 5/10, 3/10, 2/10
|
9/25 =
36%
|
2 bees were only slightly infected. The last 2/10 missed, but the 2/5 would have flagged the infection. |
Table 2. Results of bee samples from 10 weak colonies in the fall. I sub sampled each sample, 5 bees at a time, with each bee being individually squashed (total of 205 bees), and rated each bee as to whether it was positive for nosema spores or not. I stopped counting after two groups of 5 if I hadn’t yet detected any nosema. Out of 31 pairs of 5-bee samples (the lower figures in column 2), in only 2 cases out of 31 would I have underestimated the actual colony infection rate (by not hitting either 2 positive bees in 5, or 3 in 10). Note how consistently the paired 10-bee samples reflected the overall infection rate!
Practical application: I found the above reality check instructive, to say the least! In fact, I could say that I learned more about the degree of nosema infection in my operation in three hours of bee squashing than I’d learned in the last four years of counting spores! I doubt that I will ever do another spore count.
I love this method! For one, I learned that nosema was only associated with half of my weakest hives, so I can now sleep a bit better. On the other hand, half of those weak hives did have high nosema levels, so I need to address this (spot treatment?). I’m now eager to go sample some strong colonies. What is also apparent is that the method worked remarkably well! It’s not perfect, but it appears that I’d rarely miss an infection if I processed two samples of 5 bees for each tested hive. And the method readily picked out the really sick hive! Clearly, this is only a preliminary test of the procedure, and needs to be repeated with a lot more hives, but the apparent accuracy of the method is very encouraging to me.
The only remaining problem is that most beekeepers will choke at the thought of how much time it would take them to squash and microscopically view 10 bees out of each sampled hive. And that leads us to:
Sequential Sampling
Think of this Quick Squash method as similar to doing an alcohol wash of 300 bees. If I only see 1 mite, no worries for a while, as mite populations take about a month to double. If I see more than 6 mites, I treat. In between, I make a note to check back soon. It’s a similar case for nosema sampling (although it may take less time for the infection rate to double).
I’m immensely grateful to Dr. Jose Villa of the Baton Rouge Bee Lab for bringing to my attention that I was reinventing the wheel—this sort of decision making process based upon small sample sizes already has a fancy name: it’s called “sequential sampling,” and was develped for quality control inspections during World War II. Furthermore, Dr. Villa dug into the library and forwarded me existing “Decision Tables” for tracheal mite sampling produced by Tomasko (1993) and Frazier (2000). They exactly fit the bill for what I was crudely trying to work out!
Sequential sampling is all about the tradeoff between tedium (the number of bees that you need to squash and view) and confidence (the error rate which you are willing to accept). And it appears that for our purposes I estimated the minimum number of bees to sample right on the nose!
So here’s the gist (backed by some complex math) for the following parameters. Given that you want to decide whether about 10% or fewer of the bees in the population are infected (the “tolerable” level), or if the rate is above the 30-40% range (“intolerable”), and are willing to allow an error rate of 20% for overestimating (“false positives”), but only a 10% limit for underestimating a serious infection (I’m intentionally avoiding most of the associated mathematical jargon). The cutoffs are:
Practical application: it appears that in order to make a decision whether to treat or not, that a couple of 5-bee samples should be adequate, interpreted as follows:
0 positive bees out of 5, or no more than 1 positive out of 10 indicates < 10% infection
3 positive bees out of 5, or at least 4 positives out of 10 indicates > 30% infection
Any number of positive bees lying between these cutoffs (e.g., 2 bees out of 5, or 3 out of 10) suggest an infection level that lies in the gray zone, but I doubt that going beyond a 10-bee sample is worth the effort—I’d just move on to the next sample.
So I’ve got us down to 10-bee samples. But even so, I must advise you that nosema infection appears to exist in “pockets” of bees in the hive, so any single small sample is inadequate for making an apiary-level decision (Botias 2011). It’s obvious that what is needed is a quick method for processing samples of 10 bees at a time!
Acknowledgements
I wish to thank my wife Stephanie for her patience, and helpful comments on my manuscripts. As always Peter Borst helped with the research for this article. Thanks to Dr. Jerry Bromenshenk for his helpful suggestions. And a big thanks to Drs. Mariano Higes, Aránzazu Meana, and Raquel Martín-Hernández for their diligent work on nosema! For financial support toward this research, I’ve very appreciative of Joe Traynor, Heitkam’s Honey Bees, Jester Bee Company, the Virginia State Beekeepers Assoc, and individual beekeepers Paul Limbach, Chris Moore, and Keith Jarret.
References
Botías, C, et al (2011) Critical aspects of the Nosema spp. diagnostic sampling in honey bee (Apis mellifera L.) colonies. Parasitology Research (in press).
Fingler BG, WT Nash, and TI Szabo (1982) A comparison of two techniques for the measurement of nosema disease in honey bee colonies wintered in Alberta, Canada. ABJ 122(5):369-371.
Forsgren, E, and I Fries (2010) Comparative virulence of Nosema ceranae and Nosema apis in individual European honey bees. Veterinary Parasitology 170: 212–217.
Frazier, MT, et al (2000) A sequential sampling scheme for detecting infestation levels of tracheal mites (Heterostigmata: Tarsonemidae) in honey bee (Hymenoptera: Apidae) colonies. Journal of Economic Entomology 93(3):551-558.
Higes, M, et al (2008) How natural infection by Nosema ceranae causes honeybee colony collapse. Environ Microbiol 10: 2659–2669.
Mattila HR, and GW Otis (2007) Dwindling pollen resources trigger the transition to broodless populations of long-lived honeybees each autumn. Ecol Entomol 32:496–505.
Meana, A, et al (2010) The reliability of spore counts to diagnose Nosema ceranae infections in honey bees. Journal of Apicultural Research and Bee World 49(2): 212-214.
Oliver, R (2008) The Nosema Twins Part 3: Sampling. ABJ 148(2): 149-154. https://scientificbeekeeping.com/the-nosema-twins-part-3-sampling/
Porrini, MP, et al (2011) Nosema ceranae development in Apis mellifera: influence of diet and infective inoculum. Journal of Apicultural Research 50(1): 35-41
Smart, MD and WS Sheppard (2011, in press) Nosema ceranae in age cohorts of the western honey bee (Apis mellifera). J. Invertebr. Pathol. doi:10.1016/j.jip.2011.09.009
Tomasko, M. Finley, J. Harkness, W. Rajotte, E. 1993. A sequential sampling scheme for detecting the presence of tracheal mite (Acarapis woodi) infestations in honey bee (Apis mellifera L.) colonies. Penn. State College of Agricultural Sciences, Agricultural Experiment Station Bulletin 871.
Traver, B., and RD Fell (2011a) Prevalence and infection intensity of Nosema in honey bee (Apis mellifera L.) colonies in Virginia. J Invertebr Pathol 107 (1):43-49.
Traver, BE MR Williams, and RD Fell (2011b; in press) Comparison of within hive sampling and seasonal activity of Nosema ceranae in honey bee colonies. Journal of Invertebrate Pathology.
White, GF (1919) Nosema-Disease. USDA Bulletin No. 780.
Contents
Worldwide Status and Distribution
Ceranae vs. apis
Coinfection
Seasonality
Sample Interpretation
What if You’re Dealing with N. apis?
Seasonality
Recommendations
Acknowledgements
References
Sick Bees 14:
An Update on the “Nosema Cousins”
First published in ABJ December 2011
Randy Oliver
ScientificBeekeeping.com
In my last article, I described how to quickly sample for nosema. So what do the spore counts actually mean as far as colony health is concerned? I wrote an article a little over two years ago with the tongue in cheek title “Nosema ceranae: Kiss of Death, or Much Ado about Nothing.” Well, N. ceranae is still an enigma, but it appears that the answer lies somewhere in between.
Dr. Mariano Higes (2005, 2006) was the first to raise the flag to alert beekeepers worldwide that a new species of nosema had invaded Europe, and appeared to be the cause of the unusual colony collapses that plagued Spain (a major beekeeping country) in 2003 and 2004. Then in 2007, just as Colony Collapse Disorder was rampaging through our own bee operations, we found out that Nosema ceranae had somehow spread throughout the U.S. right under our eyes!
Drs. Diana Cox-Foster and Ian Lipkin (2007) then published a paper suggesting that a newly-described virus was involved in CCD, but later research indicated that IAPV wasn’t the only culprit, leaving N. ceranae as a leading suspect.
Shortly afterward, Higes (2008) described in great detail the progression of N. ceranae infection (in his Spanish apiaries) through four stages: Asymptomatic, Replacement, False Recovery, and finally the dreaded Depopulation. The logic, the numbers, and the devastating final result were all clear and compelling. The specter of N. ceranae ravaging our hives resulted in unnerved beekeepers boosting the sales of fumagillin to the point that supplies ran short.
I had never previously worried about nosema, but I pulled out a microscope and found out that N. ceranae was indeed widespread in my operation. I ran trials, and found out that the danged parasite could flourish despite being drowned in fumagillin (Oliver 2008a), but more surprisingly, that colonies here at Comedy of Errors Apiaries thrived despite exhibiting spore counts in the millions. To try to reconcile the differences between the very different outcomes of N. ceranae infection in my operation with those reported for Spain, I began an ongoing correspondence with Dr. Higes, which continues to this day.
To be frank, some other Spanish researchers dispute Higes’ conclusions (debate leads to better science), so I have often questioned and challenged him on details of methodology and interpretation, which he and his team of collaborators have generally clarified with additional research. In this series of articles I will be citing a number of the Higes team’s papers, since they have clearly led the pack in N. ceranae research, meticulously investigating nearly every aspect of this pathogen’s effects upon bees.
I’ve previously written at length about N. ceranae in my “Nosema Twins” series (all available at ScientificBeekeeping.com), but feel that there has been so much recent research completed that it would benefit the reader for me to write a digest of our current state of knowledge. I’ve scoured the literature for every relevant research paper (including a number still in press), and have discussed as well current findings with many of the world’s nosema researchers. I wish that at this time I could say that I have the answers to all your questions about Nosema ceranae, but unfortunately, in many aspects this parasite still remains an enigma.
Worldwide Status and Distribution
Nosema ceranae has now spread into the European honey bee populations of most areas of the world, roughly concurrent with the spread of varroa (and its altering of virus dynamics), which greatly confuses analysis of the effect of these two novel parasites upon bee health. It is difficult to tell in which countries N. ceranae has already reached equilibrium, and in which it is still invading.
Since the first invasive wave of a novel parasite into naïve hosts is generally that most damaging, it would be helpful to know when ceranae actually arrived in various countries. For example, we know from analysis of archived bee samples that N. ceranae has been present on the East Coast for at least two decades (Chen 2008). Unfortunately, any initial effects of its invasion may have been masked by our focus upon the massive impact of the arrival of varroa at about the same time.
Since no one was looking for N. ceranae in the U.S. until 2007, we obviously didn’t start studying it until long after it was well established and likely homogenized throughout the bee population via migratory beekeeping practices. And it is also likely that by the time we started studying the impact of N. ceranae upon the health of colonies, natural selection may have already weeded out the bees least tolerant of the emergent pathogen.
In Europe, however, N. ceranae only recently invaded bee populations already suffering from varroa and viruses, miticide failure and comb contamination, extreme weather events, plus changes in agricultural practices and pesticide use—the combination of which likely factor into colony losses in that region.
In a fresh study (Botías 2011), the Higes team analyzed archived Spanish honey samples (frozen) and adult bee samples (in alcohol) dating back to 1998. They found that N. ceranae first appeared beginning in 2000 and increased in prevalence through 2009 (the latest samples analyzed), concurrent with a decrease in the prevalence of N. apis. It is noteworthy that Spain concurrently suffered from devastating drought during much of that period, which led to serious colony stress.
N. ceranae is still in the process of extending its range worldwide, and appears to be most successful in warmer climates. It is of interest that in varroa-free Australia, its invasion does not appear to be causing significant colony losses. Interestingly, although it is well-established in Canada, it is not yet common in some northern European countries, but this may be due to restrictions upon bee imports (Fries 2010).
N. ceranae is widely distributed throughout the U.S., but surprisingly, there were great differences in the percent of colonies infected in a recent state-by-state survey (Fig. 1).
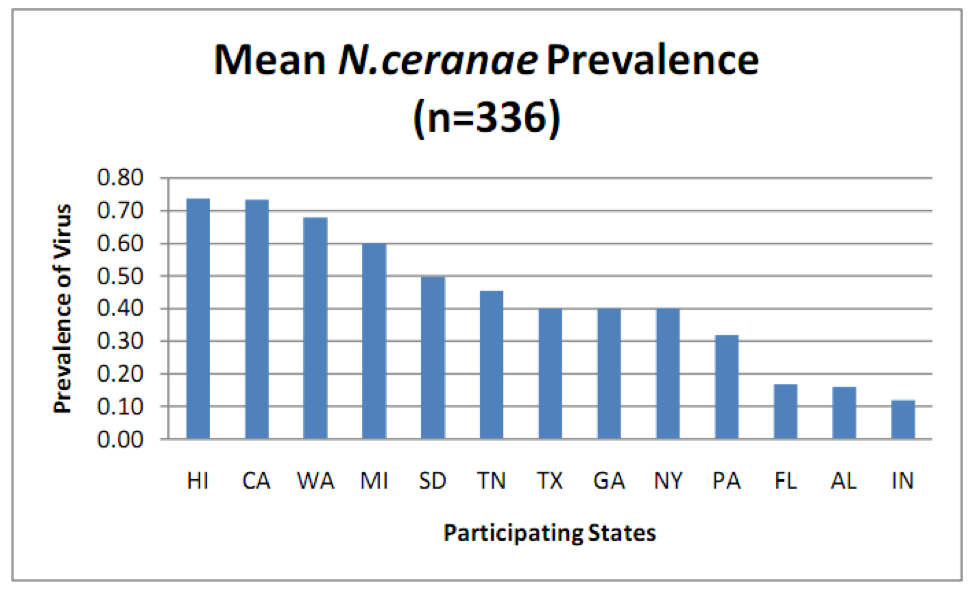
Figure 1. Prevalence (percent of samples infected) of N. ceranae in various states as determined by PCR analysis (more sensitive than spore counts) of aggregate samples collected from 8 randomly selected colonies per apiary, 4 apiaries per state. Note that in some states over 70% of samples were infected! From Rennich, K, et al (2011) 2010-2011 National Honey Bee Pests and Diseases Survey Report.
Ceranae vs. apis
In a widely cited paper by Martín-Hernández (2007), her arresting graph of nosema positive samples over time clearly shows a definite shift over the period from 1999 to 2005—there initially were only spikes in spring and fall (ostensibly from apis), transitioning to nearly 100% of samples being positive every month of the year (due to ceranae). Of note is that her data has an inherent bias, in that the samples were voluntarily sent to the lab by beekeepers for diagnosis of problems, suggesting that the data may reflect the change in nosema loads in sick hives. Also of note, is that despite this graph being widely cited, it is often misunderstood—it did not plot spore levels, but rather only the yes/no detection of nosema spores.
What the graph did strongly indicate was that N. ceranae rapidly and thoroughly invaded Spain over a period of only a few years! This initial finding has now been confirmed by Botías (2011). Likely, a similar phenomenon occurred in the U.S., since Chen (2008) found N. ceranae to already be widespread in archived U.S. bee samples dating back to 1995.
The general trend appears to be that N. ceranae now predominates in warmer countries, whereas N. apis is better adapted to colder areas. It has been often stated that N. ceranae has displaced N. apis, but more careful analysis suggests that that may not actually be the case!
When Dr. Robb Cramer asked me in 2007 to send him infected bees so that he could culture pure N. ceranae, he found that the samples often contained some N. apis as a “contaminant.” In Dr. Diana Cox-Foster’s (2007) analysis of CCD colonies, they also found both species of nosema. Later studies by Bourgeois (2010) and Runckel (2011) of commercial operations in the U.S. also found N. apis, but in far fewer hives than its cousin, only in spring and/or fall, and notably, at much lower spore levels than N. ceranae.
The differences between the detectability of the two nosema species (N. apis typically produces much lower spore counts and is generally only seen in spring and fall) may lead “to an increased chance of detecting N. ceranae over N. apis, which could have biased the impression that N. apis has been displaced” (Higes 2010).
So, has ceranae actually displaced apis, or have we merely been overlooking its cousin? In order to answer that question, Dr. Raquel Martín-Hernández (2011) carefully analyzed over 2000 bee samples from all across Spain. She found ceranae and apis coexisting throughout country, with ceranae clearly predominant (in roughly 40% of hives), apis hanging in there (in up to 15%), and occasional mixed infections (below 7%). She also found that infection by ceranae was favored in hotter areas of the country, whereas apis succeeded better where winters are colder.
I’m seeing similar indications from other countries (e.g., Gisder 2010), which are appearing to confirm that apis is the more cold-adapted species. As far as seasonality, Martín-Hernández found apis only in the spring and fall, whereas ceranae could be found all year, and notably, once ceranae infects a colony, it almost always persists (detectable with PCR, even if not obvious via spore counts).
Practical note: these studies indicate that N. ceranae remains present as an infection in a colony throughout the year, even if it is not detectable by microscopy. But we don’t know whether these inapparent infections affect colony health.
I found one last study to be of special interest: Dr. Judy Chen (2009) looked at nosema invasion from the other direction—in a turn of the tables, N. apis appears to have been introduced from the Western honey bee (Apis mellifera) into the Eastern honey bee (Apis cerana) in Asia, and is now an emergent parasite in that species, which had historically been infected only by N. ceranae! She analyzed bee samples from China, Taiwan, and Japan. Her findings:
“N. apis was detected in 31% of examined bees and N. ceranae was detected in 71% of examined bees and that the copy number of N. ceranae was 100-fold higher than that of N. apis in co-infected bees, showing that N. ceranae is the more abundant of two Nosema species in the Eastern honey bees.”
This study suggests that N. apis can not only hold its own against N. ceranae, but can actually invade into ceranae’s turf! Interestingly, in the Eastern honey bee, despite its long coevolution with N. ceranae, ceranae still produces higher spore counts than its invading cousin.
Coinfection
This brings up the question of what happens when bees are infected simultaneously by both species of nosema? Dr. Zachary Huang (pers comm) found that in both cage trials and field observations that longevity was substantially shorter for coinfected bees as opposed to those infected by either species of nosema alone (unpublished data).
Note that in Cox-Foster’s (2007) CCD study that they found “a trend for increased CCD risk in samples positive for N. apis” (100% of CCD colonies tested positive for ceranae and 90% for apis, but remember that apis is easy to miss when samples consist of house bees). As Jim Fischer noted in a post to Bee-L, “What was striking was that every hive showing CCD symptoms tested positive for BOTH Nosema apis and Nosema ceranae, and this correlation was better than the correlation between CCD and IAPV that was the focus of the paper.”
These findings leave me very curious about the impact of coinfection by two nosema species upon colony health!
Seasonality
Spore counts of N. ceranae generally reach a peak in May, then drop spontaneously during summer, and may spike sporadically in fall and winter. But there is more to the picture than this. Dr. Ingemar Fries (2010), who has studied nosema for decades, explains thusly:
“The typical pattern for N. apis infections in temperate climates is low prevalence or hardly detectable levels during the summer with a small peak in the fall. During the winter there is a slight increased prevalence with a large peak in the spring before the winter bees are replaced by young bees… The pattern is similar both in the southern and northern hemisphere… Unfortunately, very few data exist for N. apis on the seasonal prevalence from tropical or subtropical conditions. The only published year round sampling under conditions where bees could fly all year round, revealed detectable levels of N. apis with no seasonal pattern of prevalence.”
Along that line, Dr. Denis Anderson in Australia (pers comm) tells me that, “there are also many unseasonal occurrences of N. apis — I get many samples sent in in the mid summer here that are loaded with N. apis.” This could well be happening in the U.S., where, as far as I can tell, there have been few studies on N. apis in warmer areas, other than the fact that it was commonly found in package bees produced in the southern states.
Practical application: we need to learn more about the prevalence and seasonality of N. apis in the warmer parts of our country!
I’ve now seen data and presentations on N. ceranae seasonal prevalence from researchers from all over the world. Since a picture is worth a thousand words, I’ve summarized them in a crude graph below (Fig. 2).

Figure 2. A generic graph of typical N. ceranae spore counts over the course of the year in my operation. Important note: Counts of house bees would follow the same trend, but at much lower levels. The late-season spikes are often sporadic flare ups that spontaneously “go away.”
Practical application: It is not unusual to see high nosema spore counts in April and May. Counts will typically drop in summer whether you treat or not. I’ll cover treatments in a subsequent article.
But new technology is showing something surprising about nosema sampling—that spore counts do not necessarily reflect degree of actual nosema infection (Meana 2010)! Look at the following graph (Fig. 3), from a recent nationwide study of pathogens in U.S. bees—instead of measuring spore counts, the blue bars indicate the percentage of colonies infected by N. ceranae as determined by DNA analysis (PCR).
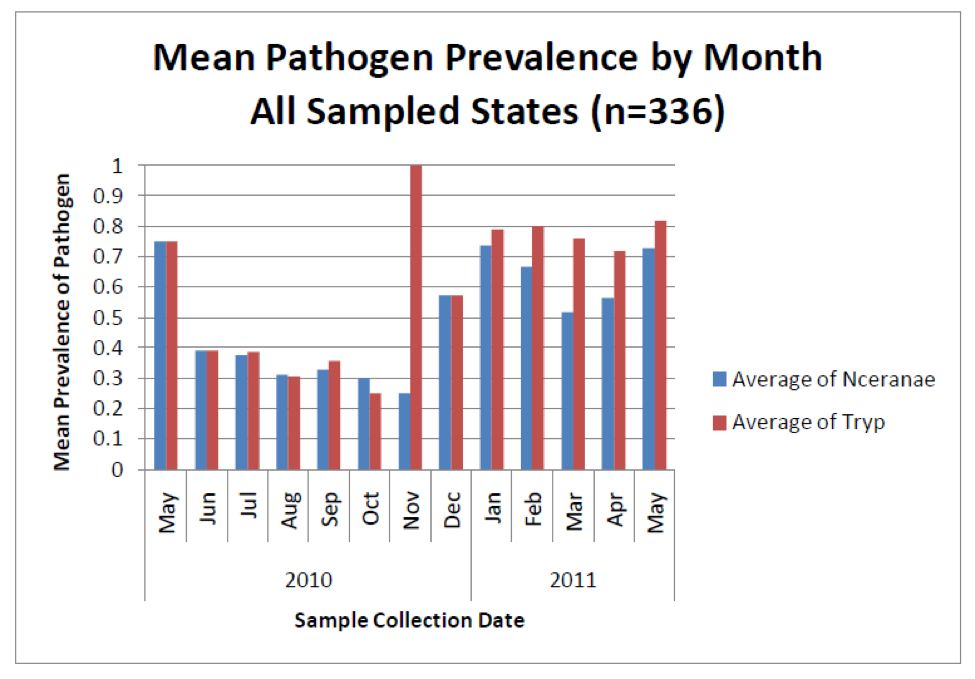
Figure 3. The blue bars indicate the percentage prevalence of N. ceranae in sampled colonies (e.g., 0.7 = present in 70% of hives). Note that even though spore counts suggest that N. ceranae disappears for much of the year (previous graph), a substantial proportion of colonies actually remain infected to some degree by the parasite. Also note how closely the coinfection with another intestinal parasite (the presumably opportunistic trypanosomes) tracks nosema infection. No one is sure whether there is a causal relationship, or whether the simple explanation is that both parasites flourish in stressed bees. Graph from Rennich, K, et al (2011) 2010-2011 National Honey Bee Pests and Diseases Survey Report.
As opposed to the above graph, Runckel (2011) also measured the amount of nosema DNA in samples, which presumably correlates with the intensity of the infection. They found high levels of N. ceranae transcripts in midsummer, at a time when spore counts are generally quite low (Fig. 5)! Their data indicated that N. apis was only present in spring and fall (which does correspond to spore counts). Go figure!
So what’s up with high levels of N. ceranae DNA transcripts without correspondingly high spore counts? No one to my knowledge has answered that important question. What we do know is that N. ceranae can exist in the vegetative stage for a while before it produces spores (Martín-Hernández 2009). But we’re not clear on to what extent N. ceranae produces “autoinfective spores,” as opposed to the “environmental” spores that are discharged into the gut contents (Cali 1999), and whether such autoinfective spores show up under microscopy. What is clear, however, is that N. ceranae appears to be able to reproduce within a bee without producing spores that are observable by microscopy.
Practical note: although N. ceranae spore counts may disappear in summer, DNA analysis indicates that the bees may still be infected. This is something of a mystery, as the bee population turns over rapidly during the summer, suggesting that N. ceranae is somehow infecting new bees without spores being evident!
So the next question is, is an infection by N. ceranae more pathogenic than one by N. apis? Although some initial cage trials indicated extreme virulence for the new nosema, trials in which bees were allowed to feed upon natural pollen generally found that both species affect bee longevity about the same (Forsgren 2010, Porrini 2011, Huang pers comm) despite the fact that spore levels get much higher with N. ceranae.
Take home: We clearly still have lots to learn about N. ceranae! It does not appear to cause rapid death of well-fed bees. The inapparent summer infections are puzzling.
So what’s the cause of the seasonality of nosema spore counts? With N. apis it is presumed to be due to the requisites of transmission via dysentery by infected bees in the hive during the winter and colony nutritional stress, and limited by its sensitivity to high temperature. Martín-Hernández (2009, 2010) demonstrated that N. apis can only grow in a narrow range of temperature (about 33°C). N. ceranae, on the other hand, grows readily over a range from 25°C to 37°C. However, N. ceranae spores are surprisingly susceptible to chilling (Fries 2010), which may limit their infectivity at lower temperatures.
Studies from a number of countries coinfected with both of the nosema cousins suggest that N. apis will continue to be the historical problem during winter and spring, with typical fall and spring spikes, whereas ceranae will be more prevalent in warmer climes, present throughout much of the year, spiking in late spring (perhaps tracking pollen flows), and then again sporadically in fall through winter.
Take home: if Nosema apis was a problem in your area prior to the invasion of N. ceranae, it may still contribute to colony health issues during the fall and spring!
Sample Interpretation
It would sure be easier if there were a simple sampling protocol that everyone could follow, and if there were clear treatment (or worry) thresholds based upon nosema spore counts, as there are for varroa (Fig. 4), but alas, I’m sorry to say that there aren’t.
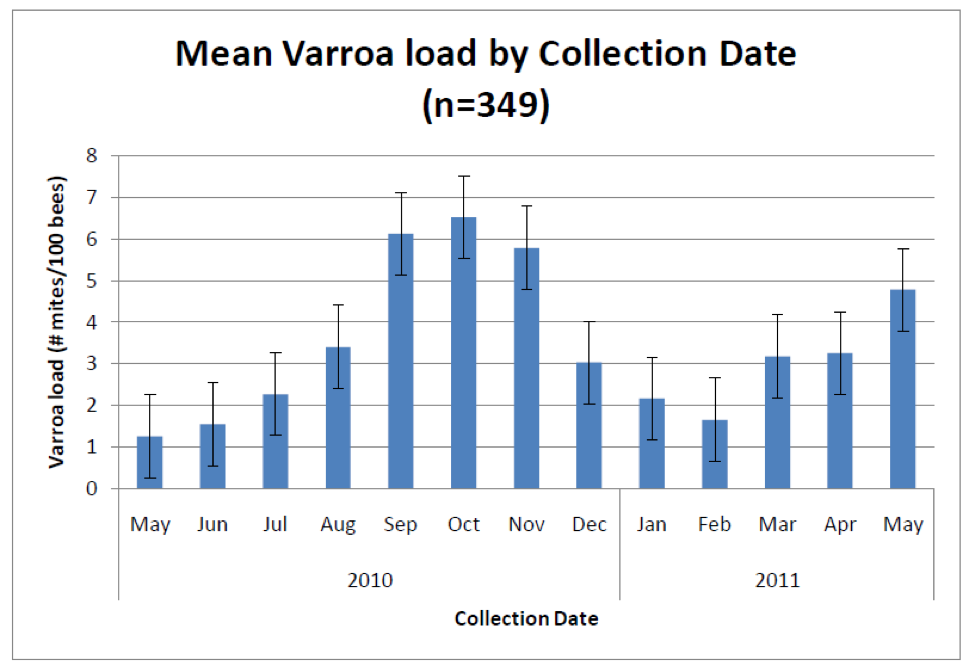
Figure 4. Average varroa infestation rates from 2700 colonies in 13 states (many of which received mite treatments). Sampling for varroa infestation level is relatively straightforward and simple to interpret. Typical treatment thresholds are below 5 mites per 100 bees. Graph from Rennich, K, et al (2011) 2010-2011 National Honey Bee Pests and Diseases Survey Report.
Unlike sampling for varroa, which are easily seen with the naked eye, sampling for nosema requires either a microscope or laboratory apparatus that can perform PCR. However, a number of researchers (Meana 2010, Bourgeouis 2010, Traver 2010) have demonstrated that spore counts alone do not give an accurate picture of the actual degree of infection. Unfortunately, as far as assessment methods available to Joe Beekeeper, spore counts will have to suffice as a surrogate measure of the actual degree of infection (Fig 5).
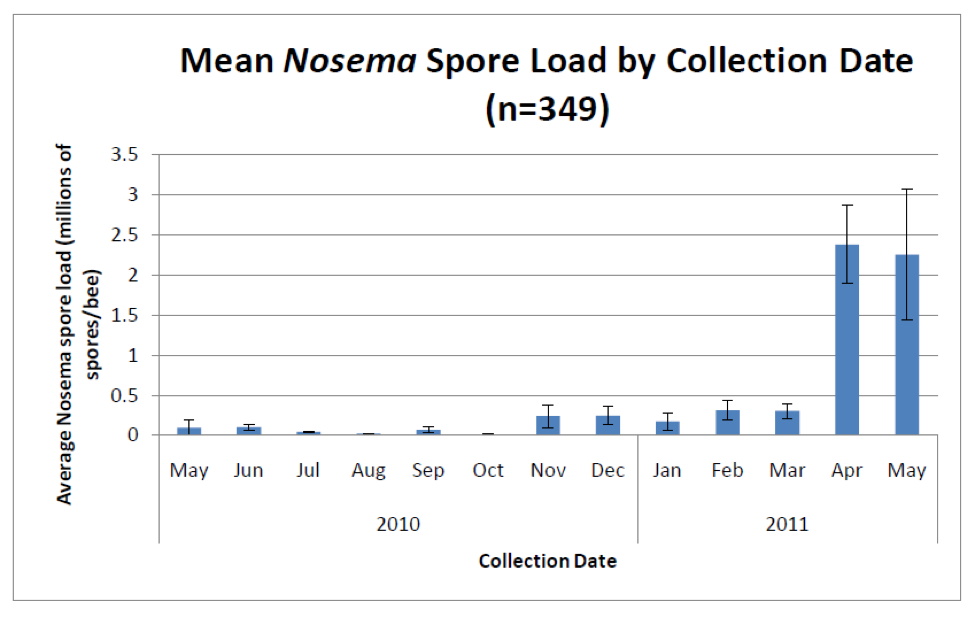
Figure 5. Average nosema spore counts from the same 2700 hives. Note the typical huge spike in spore counts (predominantly from N. ceranae) in spring, and then again lesser spikes in fall and winter. Important note: these spore counts were from samples of bees from brood frames—counts from entrance bees would likely be several times higher (compare to Figure 2). Graph from Rennich, K, et al (2011) 2010-2011 National Honey Bee Pests and Diseases Survey Report.
That said, let’s return to sampling for a bit. If you want to find spores, then sample older bees, such as foragers at the entrance (Meana 2010)—spore counts will typically be about 10 times higher in older bees, since it takes a while for the infection to build up in a bee (Smart 2011). He found that in infected colonies with a background spore count of 0.5-1M in bees from under the inner cover, almost no bees younger than 12 days old contained spores (at least detectable by microscopy).
This is not at all surprising, since El-Shemy (1989) found the same to be true for N. apis—spore counts were an order of magnitude higher in bees from the entrance. Indeed, he suggested that it was best to sample exiting bees at the entrance, since returning bees have likely defecated. The magnitude of the spore counts from an infected colony generally increases in samples (in order from lowest to highest), of bees from the broodnest, outer areas of the cluster, entrance bees, exiting foragers, returning foragers.
Both El-Shemy and Higes (2008) found that the best indicator of degree of infection was to squash bees from an entrance sample one at a time in order to determine the percentage of bees infected. My own sampling of sick colonies supports this recommendation. But in reality, few of us have time to squash dozens of bees one at a time for each sample—so I won’t even suggest that you go there!
The next best method may be to do a spore count for a pooled sample of 50 bees from the entrance (but don’t forget that even one or two highly-infected bees can greatly skew the count). In practice, however, it is often danged difficult and time consuming to collect 50 entrance bees, even if you use a special vacuum (Oliver 2008b), especially in cool weather or from sick colonies with few foragers.
For this reason, many researchers simply take standardized samples of bees from under the cover, or from an outside comb. There is support for this, as Gajda (2009) found that although spore counts were much higher in entrance bees, the relative proportion of infected bees was similar in samples taken from an outside comb.
Practical application: If you want to find out whether N. ceranae is present to any significant extent in your operation, sample bees from the entrance. If you want to know if the infection is serious, sample house bees from under the cover.
If you are curious as to whether you have gotten old or young bees in your sample, here is an easy general observation that I’ve made: since only nurse bees normally eat pollen, they are the only ones that will have it in their guts (duh). But my point is, that this is really easy to use that pollen as an indicator of bee age if you use the ziplock bag method for processing samples (see my previous article, and Fig. 6).
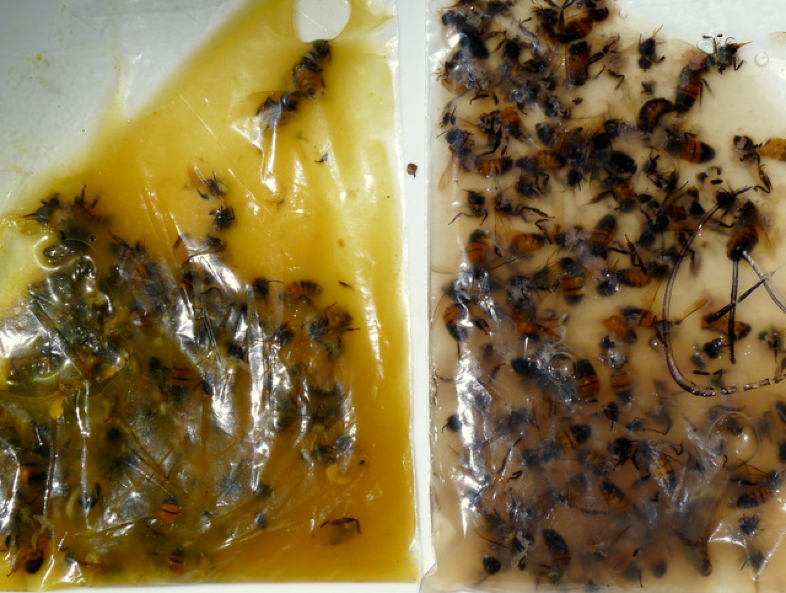
Figure 6. How to tell if your sample contains young or old bees. (Left photo) when you crush samples of nurse bees in a ziplock bag, and then mush them in water, the fluid will typically turn opaque yellow (since the guts of nurse bees are full of pollen). (Right photo) on the other hand, the fluid from the guts of entrance bees will typically be a tan/gray color (since foragers and guards don’t eat pollen).
What if You’re Dealing with N. apis?
Oh, that it were only so simple as dealing with only one nosema, but the previously cited studies suggest that many of us actually may still have N. apis popping up in fall and early spring. To make things even harder, spore counts of N. apis, on a per bee, or per pooled sample basis, are generally only a fraction (about 1/10th, as best I can tell from previous studies) of what we see with N. ceranae. But it also appears that an infection by N. apis at that low level can be as serious as an infection by N. ceranae at a much higher spore count!
Important note: Martín-Hernández (2011) easily found N. ceranae in samples of either foragers or house bees, whereas she only found N. apis in foragers and drones. So if N. apis is your concern, then you should take entrance samples! N. apis infection may be serious at a much lower spore level!
Seasonality
The other consideration is that you must put any spore count into the context of time of year, the climate that your bees are in, the nutritional status of the colonies, and especially the load of other pathogens. I will discuss these points in the next article.
In cold climates, nosema management may have other considerations. Hedtke (2011) performed a detailed 6-year study of 220 hives in Germany, and (surprisingly) found that “No statistical relation between N. ceranae detection in autumn and the following spring could be demonstrated, meaning that colonies found to be infected in autumn did not necessarily still carry a detectable infection in spring, and colonies which developed a detectable infection over winter had not been detectably infected in autumn.” So much for careful sampling!
Recommendations
Heck, I’d be crazy to stick my neck out and give any recommendations! So let’s look at what sort of nosema levels are involved in crashing colonies. The CCD colonies analyzed by Cox-Foster (2007) had mean spore counts in the range of tens to hundreds of millions from broodnest samples! Is it really any surprise that those colonies collapsed? The house bees in Higes’ (2008) winter-collapsing colonies hit 20M before they went down (field bees hit 50M), but those that collapsed in summer only hit 3M.
But note that in the U.S. survey graph above, that 2M was the average spore count across the U.S. in April and May of this year, yet I’m not hearing of massive colony collapses, despite very poor conditions in many states.
In my own California foothill operation (we get snow during the winter, and move to almonds in February), it is not unusual to see entrance spore counts in May in the millions or tens of millions, but they generally drop during summer, provided that colonies are not stressed by other factors. Entrance counts during summer and fall are typically in the zero to 5M range (25 spores per field of view if you follow the protocol in my previous article—I’ll call these FOV counts (Oliver 2008c)). I have not looked at near as many samples of house bees, but counts are generally zero to a fraction of a million, even in colonies running at 10M at the entrance.
I am by no means suggesting that you follow my lead, but I simply no longer worry about high spore counts in spring, as they generally spontaneously drop later in the season, and I haven’t experienced winter losses associated with N. ceranae (unless I’ve intentionally inoculated the hives with viruses). However, I do keep my mite levels down, and feed pollen supplement to maintain good nutrition if necessary. And I monitor nosema levels throughout the year so that I don’t get blindsided!
I’ve never treated for nosema (except in experiments), yet have not experienced colony collapses since 2006. But I’m not saying that you have no reason for concern—I will be writing about a trial in which I did compare survival of treated vs. untreated colonies that had virus issues, and fumagillin appeared to help.
I’d be concerned if counts for house bees got above 5 per FOV at any time, although I know several large commercial beekeepers who routinely ignore such counts with no dire consequences so far. I just checked a number of samples of house bees today (late October), and they ran from zero to 2 spores per FOV, despite there often being counts of 100-200 per FOV of entrance samples this spring.
In some operations where N. ceranae apparently got out of hand, treatment and comb sterilization seemed to help. However, in other operations with sky-high spore counts in spring, lack of treatment did not result in any noticeable problems. Due to these huge discrepancies, it is confoundingly difficult to come up with recommendations. However, the more beekeepers who start tracking spore counts, the more we will learn about appropriate treatment decisions.
If you are in an area with a long, cold winter which keeps the bees confined, you may be dealing with Nosema apis, for which the economic threshold of 1M (5 per FOV) for house bees has been well established.
Practical application: since spore counts for N. apis generally only reach levels about 1/10th of those for N. ceranae, you’d be wise to ask your local university determine which nosema species you’re dealing with, since it follows that the economic threshold for treatment for N. apis may be far less than that for N. ceranae.
I will continue this review of N. ceranae in the next issue, including treatments, and its relationship to colony mortality and honey production.
Acknowledgements
Thanks to you, my readers! It just occurred to me that I’ve recently passed the 5 year mark in writing for ABJ, and it’s been one wild ride! If I had any idea what I was getting into, I would probably have chickened out. But your feedback and appreciation keep me going—my motivation is simply the gratification that I get from sharing what I’ve learned with other beekeepers. Your donations also allow me to perform the sort of quick and dirty research necessary to answer burning questions. I am constantly on the learning curve, and greatly appreciate hearing information that is relevant to better bee management—feel free to contact me (no beginners questions please) randy@randyoliver.com.
As always, Peter Loring Borst has helped me greatly with research. I thank Dr. Mariano Higes for his patience in discussing his research. Dr. Steve Pernal and Ingemar Fries have been gracious with their time. I also thank all the other nosema researchers who have patiently answered my questions.
References
Botías, C, et al (2011) The growing prevalence of Nosema ceranae in honey bees in Spain, an emerging problem for the last decade. Research in Veterinary Science (in press).
Bourgeois, AL (2010) Genetic detection and quantification of Nosema apis and N. ceranae in the honey bee. Journal of Invertebrate Pathology 103: 53–58.
Cali, A and PM Takvorian (1999) Developmental morphology and life cycles of the microsporidia. P. 121. in Wittner, M and LM Weiss, eds. The Microsporidia and Microsporidiosis.,American Society for Microbiology.
Chen, Y.P., et al (2008). Nosema ceranae is a long-present and widespread microsporidian infection of the European honeybee (Apis mellifera) in the United States. J Invertebr Pathol 582 97: 186–188.
Chen, YP, et al (2009) Asymmetrical coexistence of Nosema ceranae and Nosema apis in honey bees. Journal of Invertebrate Pathology 101 (2009) 204–209.
Cox-Foster, DL, et al. (2007) A metagenomic survey of microbes in honey bee colony collapse disorder. Science 318(5848): 283-287.
El-Shemy, A.A.M. and RS Pickard (1989) Nosema apis Zander infection levels in honeybees of known age. J. Apic. Res. 28 (2), 101–106.
Forsgren, E, and I Fries (2010) Comparative virulence of Nosema ceranae and Nosema apis in individual European honey bees. Veterinary Parasitology 170: 212–217.
Fries, I (2010) Nosema ceranae in European honey bees (Apis mellifera). Journal of Invertebrate Pathology 103: S73–S79. https://bienenkunde.uni-hohenheim.de/uploads/media/Nosema_ceranae_in_European_honey_bees__Fries.PDF
Gajda, A (2009) The size of bee sample for investigation of Nosema sp. infection level in honey bee colony. http://www.coloss.org/publications/Nosema-Workshop-Proceedings.pdf
Gisder S, et al. (2010) Five-year cohort study of Nosema spp. in Germany: does climate shape virulence and assertiveness of Nosema ceranae? Appl Environ Microbiol 76: 3032–3038.
Hedtke, K, et al (2011) Evidence for emerging parasites and pathogens influencing outbreaks of stress-related diseases like chalkbrood. Journal of Invertebrate Pathology 108:167–173.
Higes, M (2010) Nosema ceranae in Europe: an emergent type C nosemosis. Apidologie 14(3): 375 – 392.
Higes, M., et al (2005) El síndrome de despoblamiento de las colmenas en España. Consideraciones sobre su origen. Vida Apícola 133: 15–21.
Higes M, et al (2006) Nosema ceranae, a new microsporidian parasite in honeybees in Europe, Invertebr Pathol. 92(2):93-5.
Higes, M, et al (2007) Experimental infection of Apis mellifera honeybees with Nosema ceranae (Microsporidia). J Invertebr Pathol. 94(3):211-7


