A COMPARATIVE TRIAL OF THE POLLEN SUBS 2020
Part 2
First published in ABJ August 2021
Vincent Riciglianoa and Randy Oliverb
aUSDA-ARS, bScientificBeekeeping.com
Last month I described how we set up our comparative trial of several pollen subs. Now it’s time to bring in my collaborator, Dr. Vincent Ricigliano, to show the results of some of his laboratory analyses of the bee samples taken at the midpoint of the trial, as the colonies went into winter cluster.
A note from the authors: Since Randy started writing this series in the first person, we’re going to continue along that vein, although much of this article will be about Vince’s findings. Since beekeepers are becoming more and more dependent upon supplemental feeding of their colonies, for the benefit of the beekeeping industry we’re doing a deep dive into extracting as much usable information as we can from the data gathered during this field trial of artificial diets.
That said, this article presents a lot of information from the midpoint of the trial — both field measurements and molecular analyses. The midpoint findings presented in this article help us to understand artificial diets in general, and will likely be of special interest to those interested in developing better diets for honey bees. Next month we’ll present the endpoint results, which will really get down to the nitty-gritty of dollars and cents, practical application to beekeepers curious about the pollen subs on the market.
EFFECT OF DIET TYPE UPON COLONY STRENGTH AT THE MIDPOINT ASSESSMENT
After a feeding period of 84 days — during which the colonies depended upon the tested pollen subs and sugar syrup as their main sources of nutrition — the hives went broodless in November as the weather cooled. We graded them for strength on a cold morning, when the clusters were very tight (but which allowed for accurate and consistent grading).
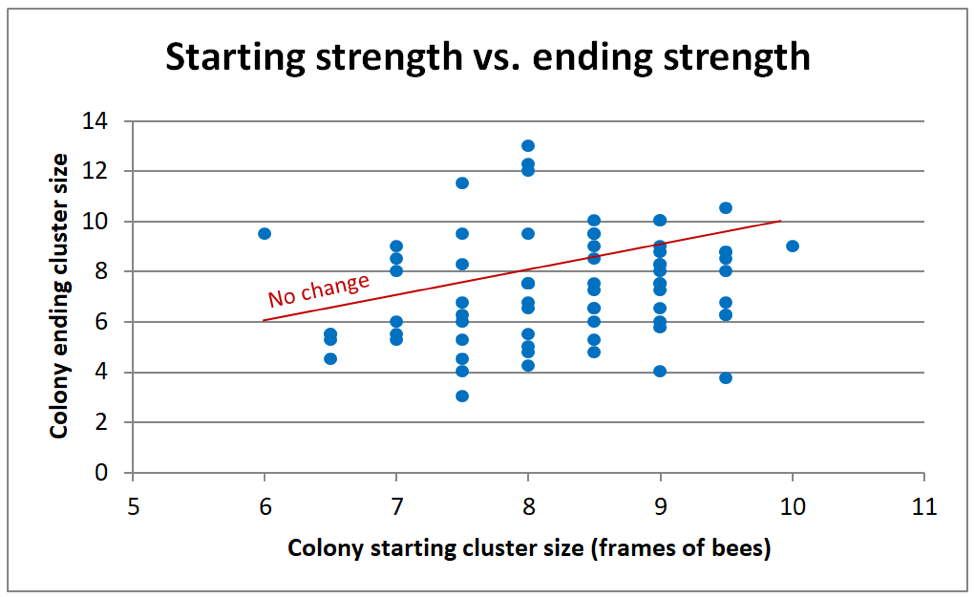
The first question to answer was whether midpoint colony strengths reflected their starting strengths, since I’d intentionally begun the trial with an equal range of starting cluster sizes for each diet type. A scattergram (Figure 1, in which many of the 144 data points overlap) indicates that there was no benefit from starting with a larger cluster size.
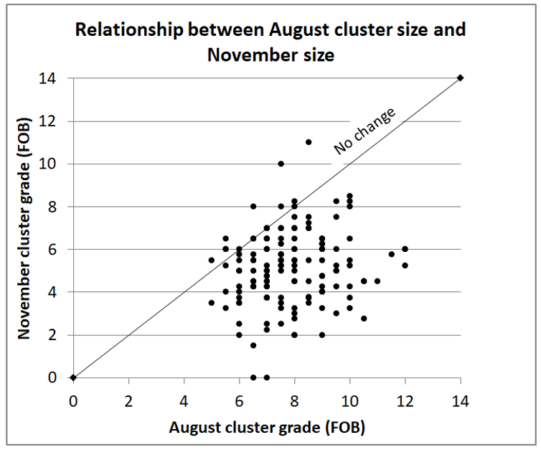
Fig. 1 Change in cluster size from August to November; colonies below the No Change line shrunk in size. The median starting cluster size (in hot-weather grading) was 7.5 frames of bees (FOB), by November (with cold-weather grading); most colonies had shrunk in size (to a median 5.3 FOB). The data above indicate that there was no benefit to starting with a larger cluster size in August, since the larger colonies tended to lose more strength than the smaller ones (as evidenced by the greater vertical drop of the data points from the No Change line from left to right).
Practical application: Being stronger in August did not mean that a colony would be stronger in November. This may have been an artifact of the clusters of the strong colonies being more expanded during hot-weather grading, more than actual bee count.
Since starting cluster size was not that predictive of midpoint size, and since all diet groups started with an equal range of cluster sizes, this means that we can compare the average colony strengths in November by diet type without taking into account starting colony strengths (Figure 2).
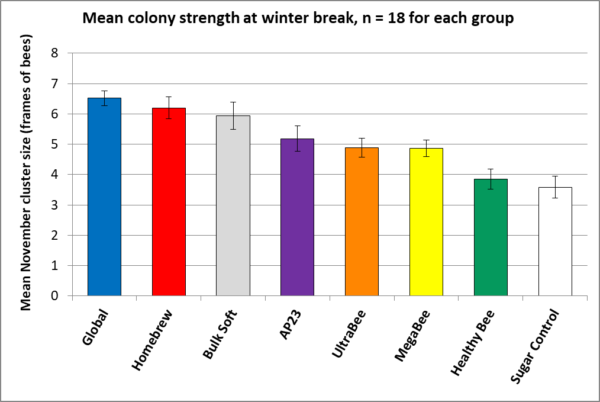
Fig. 2 The larger cluster sizes of the colonies fed the better subs, relative to the Sugar Controls, indicates the positive benefit from feeding pollen sub (a t-test p-value < 0.00001 for Global vs. Control, thus validating the experimental design). The relatively small standard errors indicate that the differences in performance relative to diet type are meaningful. The above data matched our field observations as far as colony preference for (consumption wise), and performance in response to, diet type — with the blue, red, and silver treatment groups being standouts (note that only two of those three diets contained natural pollen).
Practical application: As we’ll see next month, the cluster size of a colony going into winter made a big difference on how they build up for almond pollination. Keep the above ranking of performance of the subs in mind.
OK, now that you’ve got the ranking of how the diet type affected colony performance as far as cluster size at the midpoint, let’s see how diet affected the biology of the bees.
VINCE’S LABORATORY ANALYSES AT THE MIDPOINT
We put a lot of field work into this comparative trial of the diets. But this wasn’t just a test to see which subs were “best,” but rather an opportunity to learn why some diets perform better than others. At the grading in early November, I froze samples of workers vacuumed from the top bars of the broodnests. Vince and his technician Steven Tyler Williams performed weight and molecular analyses on the sampled bees, as well as sending samples of the patties out for nutritional analysis.
At the USDA lab, they removed and dried the heads and thoraces of 15 bees from each sample, and weighed them as a group. This allows us to compare individual bee glandular and muscular development to colony cluster size as a result of being fed each diet (Figure 3).
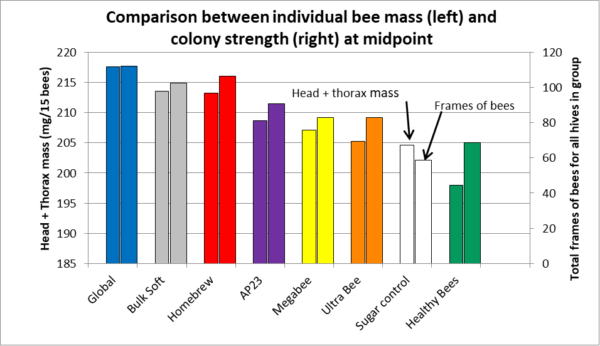
Fig. 3 Average individual bee mass (weight) closely correlated with colony strength (R2 = 0.80 [[1]]), indicating that what’s nutritionally good for the individual bee is good for the colony as a whole.
Practical application: Head and thorax weights are often used as the metric for laboratory studies on bee diet quality; the data above support that assumption. I’ll discuss this in greater depth in a subsequent article.
PATTY CONSUMPTION
Since an artificial diet is of little value if the bees aren’t stimulated to consume it, a question to answer is whether the bees treated the offered patties as food, or as junk to be removed from the hive. The only diet type that we saw being discarded to any extent was the Healthy Bee with thyme oil. Conversely, it was no surprise that the two patty types containing natural pollen were consumed quickly and completely. However, note that the other diets were not far behind (Figure 4).
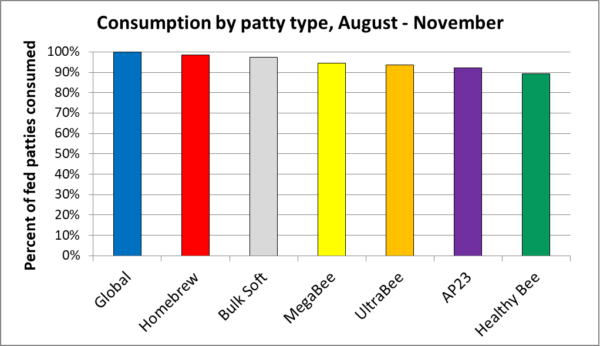
Fig. 4 The bees preferred some formulations over others, but at least 90% of all patty types were consumed during this feeding period. Global and Homebrew, likely due to being 15-20% natural pollen, were the most quickly and completely consumed, but the others were not far behind. There were no appreciable yard-to-yard differences in overall patty consumption — 95% and 96% at the E and T yards; and 97% at the H yard (which was fed 2 lbs. more).
Practical application: Although the bees consumed some subs more eagerly than others, it doesn’t appear that there was a big enough difference in consumption between diet types to account for the differences in colony performance at the midpoint, and reduced consumption may have partially been a function of colony size.
WHY WERE SOME SUBS MORE (OR LESS) PHAGOSTIMULATORY?
The scientific term for stimulating an organism to eat is “phagostimulation” — “phago” meaning “to eat.” So what makes an artificial diet phagostimulatory to the nurse bees (the workers that actually consume the patties)?
BACKGROUND
Although some researchers have proposed that nurse bees can differentiate diets by nutritional quality, I find their arguments unconvincing. On the other hand, in a highly-informative study, Vanessa Corby-Harris [[2]] performed a series of choice assays of natural and nutritionally-supplemented pollens, and came to the conclusion:
… that nutritional value plays a minimal role in nurse bee diet choice … although certain pollens provide a greater benefit per unit of consumption, honey bee nurses either cannot or do not discriminate among pollens based on nutrition.
Practical application: I’m not convinced that bees can tell whether a diet is nutritious or not by taste or smell. But you must make any artificial diet smell or taste “good” to the patty-consuming nurse bees, in order to encourage them to eat it.
Side note: Having recently lost all sense of taste for some months due to radiation treatment of my tongue, I can attest to the importance of sensory phagostimulation to induce what we’d call “the desire to consume” any particular food choice.
I and others have observed that bees clearly have preferences for some natural pollens over others. Each of the patty types smelled different to my human nose, so I don’t doubt that odor was a factor in nurse feeding preference for the tested subs.
NATURAL POLLEN AS A COMPONENT
Back in 1973, USDA researcher Lonnie Standifer found, not surprisingly, that the addition of 5% natural pollen to their tested artificial diet improved consumption and the amount of brood reared, but that there was not much gain from increasing the proportion to 20% [[3]]. Standifer concluded that:
The better performance of colonies fed rations containing pollen may occur because of feeding stimulants present in the pollen rather than because the rations containing no pollen lack nutrients.
Schmidt and Hanna [[4]] later determined that there are a suite of phagostimulatory compounds in pollen. Not surprisingly, in this trial the bees eagerly consumed the two products containing natural pollen, but some of the completely artificial diets were also quickly consumed by the bees. The Global patties are advertised as containing 15% natural pollen (irradiated against pathogens); the Homebrew patties contained 20% pollen by dry weight. The addition of natural pollen to those products means that they were technically “pollen supplement” or “pollen extender” formulations, rather than pollen substitutes (completely “artificial diets”).
It’s well-known that colonies respond well to patties of trapped pollen moistened with sugar syrup. But natural pollen is expensive, may contain agricultural chemicals, can vary greatly in nutritional and phagostimulatory value, and if not sterilized, can transmit the full spectrum of bee pathogens.
Practical application: I’ve got nothing against using trapped pollen for feeding bees, but true “pollen substitutes” are artificial diets that do not contain bee-collected pollen as an ingredient, which allows them to be more standardized and less expensive. Some of the tested artificial diets performed nearly as well as products containing natural pollen, which is very encouraging.
FEEDING ATTRACTANTS OR DETERRENTS
Some of the subs contained lemongrass oil, which contains one of the components of honey bee orientation pheromone (citral). I’m not clear as to whether lemongrass oil is phagostimulatory or merely attracts the nurses to the proximity of the patty. At least one sub also contained spearmint oil and thymol.
One must be careful with essential oils in diets, since bees are strongly repelled by some aromatic essential oils. The Healthy Bee patties that I tested were quite aromatic with thyme oil, which may have unfortunately acted as a feeding deterrent to the bees (and also to Small Hive Beetle). I showed a photo in my previous article of how the bees dragged Healthy Bee patty out of the hive.
MOISTURE AND TEXTURE
The bees seemed to prefer moist patties over drier patties. The tested subs varied widely in texture and moisture content. (I strongly suggest to the manufacturers that they wrap their subs in plastic bags, so that they don’t dry out during storage.)
Vince also had a commercial lab analyze the patties for protein, amino acids, lipids, and sugars. Let’s see whether the amounts of those elements affected how well the bees “liked” the patties.
SUGAR CONTENT
We all know that bees like sugar. And if there is either a natural pollen flow occurring, or if the bees don’t like something about an artificial diet, they will often just suck the sugar out of a patty, and remove the remainder as trash. So how much sugar was in the tested subs (Figure 5)?
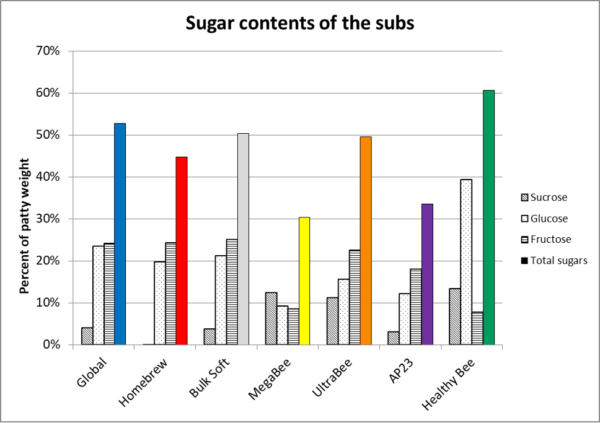
Fig. 5 I ordered the subs from left to right by consumption preference as in the previous graph. The patties ranged from 30% to 60% sugar content. Note that the sugar content did not correlate with consumption preference. Despite AP23 and MegaBee both having low sugar contents, they were still well consumed. Apparently, a high sugar content is not necessary for an artificial diet, nor does it guarantee rapid consumption.
The breakdown of the sugars indicates that most formulations used high-fructose corn syrup (consisting of fructose and glucose) as the main sweetener, likely not only due to its low cost, but because it makes for a patty that maintains its soft texture. Most also contained a lesser amount of sucrose.
PROTEIN CONTENT
The main purpose for feeding pollen sub is to provide protein to the nurse bees. But protein content did not correlate with how well the patties were consumed or performed (Figure 6).
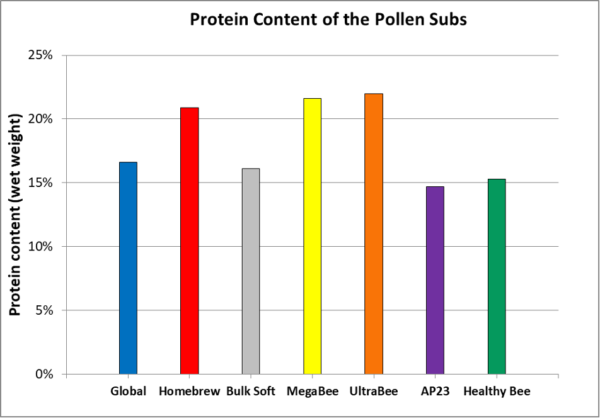
Fig. 6 The diets are ranked from left to right by consumption (from Figure 4). The protein concentration did not correlate with consumption, nor (as we’ll see further along) with performance.
Practical application: The colonies clearly didn’t consume patties according to their protein contents. A strong shot of protein may allow a burst of colony growth [[5]], but as we’ll see, over the long term patties with only 15% protein can perform as well as those with over 20%. This is important to know, since protein is typically the most expensive component of pollen subs. But as I’ll elaborate upon in a subsequent installment, our results suggest that more important than total protein is the balance of the essential amino acids.
LIPID CONTENT (INCLUDING ESSENTIAL FATTY ACIDS AND STEROLS)
Natural pollens vary in their lipid contents, but generally fall within the 3-10% total lipid content range, with the pollen of the bee-attractive and nutritionally complete clovers and mustards falling into the 6-10% range [[6], [7]]. So how important was lipid content as far as consumption? See Figure 7.
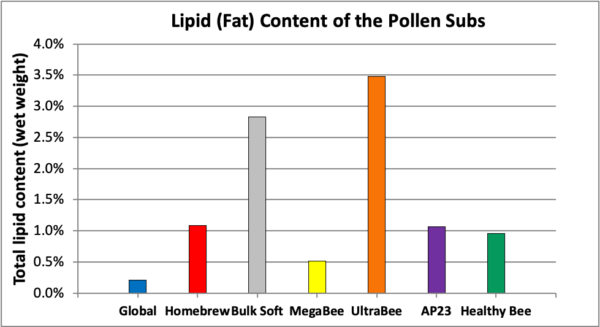
Fig. 7 Again shown in order of consumption. Cleary lipid content did not define how phagostimulatory the subs were. Most surprising to us was that Global, which was one of the most quickly consumed patties, had by far the lowest lipid content.
Australian researcher Rob Manning tested a number of vegetable oils as phagostimulants [[8]], and my own observations are that canola and corn oil appear to be attractive to bees. Vegetable oil may also be added to improve the texture of a sub. The chart above indicates that the manufacturers don’t agree upon how much oil in a diet is optimum.
Practical application of the above findings: Well, it sure didn’t appear to be the sugar, lipid, or protein proportions of the patties that defined how phagostimulatory the formulations were. So based upon these results, it would be hard to come up with any rules of thumb for how to formulate an artificial diet in order to stimulate consumption, other than having enough sugar, and some scent or taste components that are phagostimulatory to the nurses.
MOLECULAR ANALYSIS OF THE GUT MICROBIOME
We’ve heard a lot about how important the gut microbiome is to our health and that of our bees. Vince focused on the “core” microbiome bacterial types since these constitute 90+% of all bacteria in the gut and have functional significances linked to physiology and health (Figure 8).
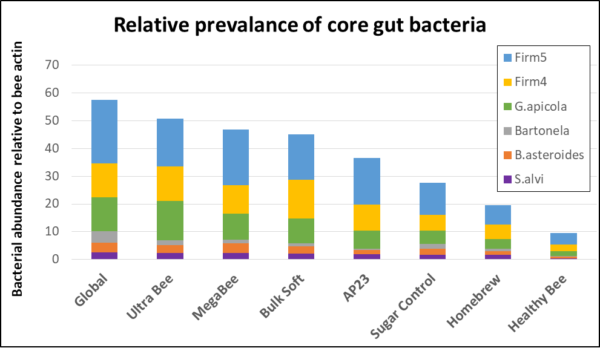
Fig. 8 Of interest is that one might expect to see the greatest amount of core gut bacteria in the two groups fed patties containing natural pollen, but that was only the case with Global. Surprisingly, bees fed Homebrew, with even a greater proportion of pollen, had only a third the amount of bacteria present in Global — and even less than the sugar controls. The thyme oil in Healthy Bee may not have been friendly to the gut microbiome — a result that Vince is currently following up on with laboratory experiments.
The last observation is of interest, since Vince has previously shown that spirulina has great potential as a component of artificial diets [[9]]:
Spirulina diets produced biomarker profiles (thorax weight, head protein content, and beneficial gut bacteria abundance) that were indicative of elevated nutritional states, meeting or exceeding the other diets in some metrics despite reduced consumption.
Practical application: We strongly suspect that it was the added thyme oil in Healthy Bee that negatively affected consumption, head and thorax weight, the gut microbiome, as well as overall colony performance. The last thing that we want to do is to trash spirulina as a potential bee feed component. I’ve been in regular contact with the manufacturer of Healthy Bee, who informed me as I was typing these words that they now offer a Healthy Bee formulation free of thyme oil [[10]].
Although the two extremes in the above graph correlate with colony performance, that’s hardly the case for those diets lying between. Note, however, no matter what the diet type or whether it contained natural pollen, the relative proportions of the core bacterial groups remained consistent.
Practical application: The core microbial gut community appears to be able to maintain proportional homeostasis despite the diet formulation or the presence of natural pollen. That’s good news for the development of artificial diets. Why the bees consuming Homebrew had only a third as many core bacteria as did Global remains an open question, but since it did not hamper Homebrew’s performance, perhaps the amount of bacteria in the gut is not that critical. It is important to keep in mind that gut microbiome dynamics are complex, with their relationship to foraging environment and food sources still poorly understood.
NOSEMA CERANAE
The bee midgut (where pollen sub is actually digested) is also where Nosema ceranae reproduces. In the sampled bees, there was great yard-to-yard and sample-to-sample variation, which prevents us from drawing firm conclusions as to diet type and nosema. However, it occurred to me that since nosema infection intensity generally reflects the amount of pollen that the bees are consuming [[11], [12]], that the amount of nosema in the sampled bees might correlate with the protein concentration of the diet that they had been consuming. That appears to indeed be the case (Figure 9).
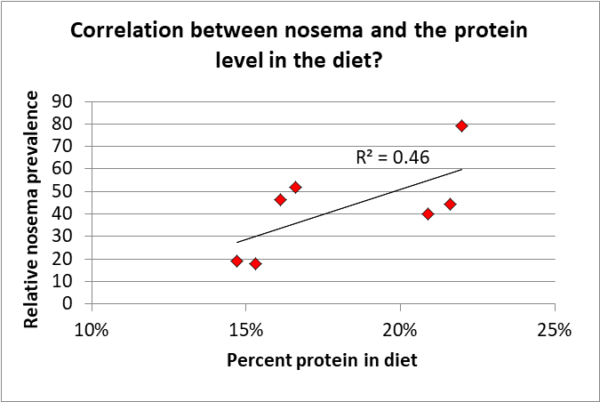
Fig. 9. The trial was not set up to specifically answer this question, but the data certainly suggests that the infection intensity of Nosema ceranae correlated with the amount of protein in the diet.
Practical note: Beekeepers freak out about nosema spore counts, not understanding that spore counts go up relative to the amount of pollen that the bees are consuming. At the same time, the increased nutrition from the pollen largely offsets the negative effects of nosema infection in the bees. This likely also applies to the feeding of pollen sub — spore count will go up, but the bees will still benefit from the supplemental diet.
THE EFFECT OF OXALIC ACID TREATMENT
Not being one to miss an opportunity to squeeze some extra information out of a data set, it occurred to me that all the colonies in the trial had been treated continually with extended-release oxalic acid at a low level [[13]] — that is, except for eight potential breeder colonies spread throughout the yards and fed the same diets, but never having received an oxalic treatment. Aha, I thought, perhaps we can gain some insight into the question of whether extended exposure to oxalic acid affects the gut microbiome (Figure 10).
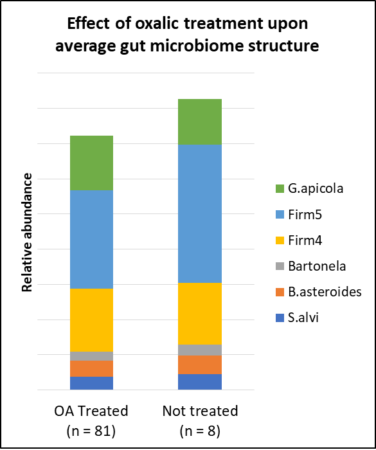
Fig. 10 The trial was not set up to answer this question, and there were not enough samples in the untreated group to draw a firm conclusion, but the above data suggest that extended exposure to a low level of oxalic acid does not adversely affect the gut microbiome of the treated bees.
Practical application: Good news!
OK, since I’m on a roll, Vince also performed qPCR to determine the relative abundance of DWV-A in the same bee samples (low-dose OA-treated vs. untreated near-zero-mite breeders). We frequently monitored the OA-treated hives for varroa, and mite wash counts rarely exceeded a 2% infestation rate. Despite those low infestation rates, the differences in their relative levels of DWV-A in November is striking (Figure 11).
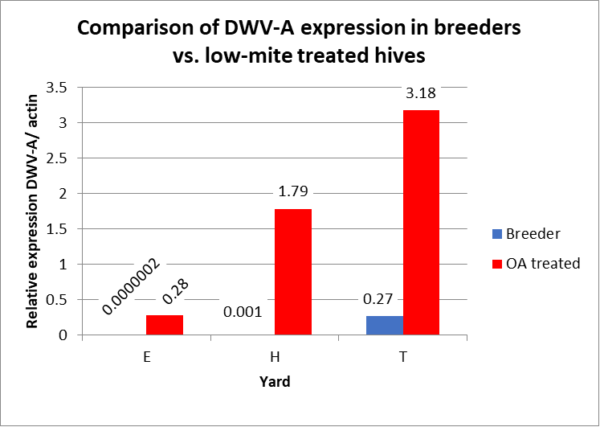
Fig. 11 We were surprised by the huge differences in DWV-A level between the low-mite OA-treated hives, and the few potential breeders that kept mite counts to zero by themselves. Since the DWV levels of the E- and H-yard breeders are too low to show in this non-logarithmic graph, I just put the relative expression numbers above where their blue columns would be. Qualifier: Again, there were only 8 mite-resistant colonies, but their average virus expression levels were anywhere from eleven to over a million times lower than the averages of the analyzed other hives in the same yards.
Practical application: The workers in the varroa-resistant colonies had strikingly lower Deformed Wing Virus levels than did those in the low-mite treated hives. We gotta get serious about selecting for varroa-resistant bee stock!
Molecular analyses such as those above may help us to understand why and how different diets might affect worker physiology and their microbiomes, and how that relates to colony performance.
TAKE HOMES AT THE MIDPOINT
So what have we learned so far?
- The bees consumed most of the diets well, although some were a bit more phagostimulatory than others. Although the bees clearly “liked” natural pollen, it wasn’t a necessary component of a successful diet.
- Total protein in the 15-20% range appears to be adequate, but note that researchers at the Tucson lab found that a 23-30% protein diet worked better than 10% or 50% [[14]].
- Most diets contained sugars in the 50% range (wet weight), but colonies consumed MegaBee well despite it containing only 30% sugars.
- One thing that comes to mind is the necessary protein to carbohydrate (P:C) ratio in a bee diet, the carbohydrate portion consisting of sugars. Royal jelly, the sole diet of young larvae or the queen, has a P:C ratio between 1:1 and 1:2 [[15], [16]]. For newly-emerged workers or nurse bees producing jelly (critical for colony buildup), it’s likely in the range of 1:2 – 1:5. But for foragers (which only require tiny amount of protein for body maintenance), it jumps to something in the vicinity of 1:250. So if one is feeding pollen sub for colony buildup or preparation for winter, the P:C ratios of current pollen subs appears to be in the right ballpark (18% protein and 50% sugar is a 1:2.8 ratio), with the bees able to balance any additional need for sugar by consuming honey or fed sugar syrup.
- HFCS is typically used as the main sugar source, since it maintains patty texture. The optimal amount of sucrose is not clear (if it is necessary at all). So I consider the ideal sugar formulation of a sub to remain an open question.
- It was extremely surprising to us how eagerly the colonies consumed, and how well they performed, on Global, despite it containing only 2% lipids.
- One important question was whether there is a need for pollen exines as a prebiotic for the core bacterial gut microbiome — or do the fiber and complex carbohydrates of the soy meal, corn gluten meal, or brewer’s yeast typically used as protein sources of a diet serve the purpose? Our analysis indicates that the core bacterial microbiome structure remained consistent despite the presence or absence of pollen, or even with the different artificial diet formulations, which is likely good news. In addition, bacterial abundance did not correlate with colony performance, thus making us question whether the amount of bacteria is that important.
- Going into winter, the colonies fed the better subs had clusters half again larger than the Controls, consisting of workers with better-developed heads and thoraces (regrettably, we didn’t measure fat body development). As we’ll see, this gave them an important head start when they began late-winter broodrearing for spring buildup.
TO BE CONTINUED…
OK, you’ve seen the results up to the midpoint, but don’t draw any conclusions yet! After winter break, the “winter bees” reared on these artificial diets then had to build up when we resumed feeding the same diets, prior to going to almonds. This is when the rubber hit the road, and the true performance of the diets became apparent. I’ll also perform a cost-benefit analysis, and then in a following installment suggest why some subs were able to outperform others.
NOTES AND CITATIONS
[1] Not shown is that I ran a linear regression of the data.
[2] Corby-Harris, V, et al (2018) Honey bee (Apis mellifera) nurses do not consume pollens based on their nutritional quality. PLoS ONE 13(1): e0191050.
[3] Standifer, L, et al (1973) Influence of pollen in artificial diets on food consumption and brood production in honey bee colonies. Am. Bee J. 113: 94-95.
[4] Schmidt,J & A Hanna (2006) Chemical nature of phagostimulants in pollen attractive to honeybees. J Insect Behav 19: 521–532.
[5] http://scientificbeekeeping.com/a-comparative-test-of-the-pollen-sub/
[6] Dong, J, et al (2015) Fatty acid profiles of 20 species of monofloral bee pollen from China. Journal of Apicultural Research 54(5): 503-511.
[7] Manning, R (2001) Fatty acids in pollen: a review of their importance for honey bees, Bee World, 82(2): 60-75.
[8] Manning, R, et al (20100 Added vegetable and fish oils to low-fat pollen diets: effect on honey bee (Apis mellifera L.) consumption. Australian Journal of Entomology 49: 182–189.
[9] Ricigliano, V & M Simone-Finstrom (2020) Nutritional and prebiotic efficacy of the microalga Arthrospira platensis (spirulina) in honey bees. Apidologie 51: 898–910.
[10] https://www.healthybeesllc.com/post/back-to-the-roots-of-nutrition-our-new-formula
Field testing of our product without essential oils began around a year ago with commercial beekeepers. So far, the feedback has been great. Even greater royal jelly production than the original, better consumption and “fluffier bees”. Which I normally correlate to good individual physiology due to nutrition…So now we are proud to offer a strictly nutritional version of our product, formulated to provide superior gut health along with nutrition.
[11] Zheng, H, et al (2014) Spore loads may not be used alone as a direct indicator of the severity of Nosema ceranae infection in honey bees Apis mellifera (Hymenoptera:Apidae). J. Econ. Entomol. 107(6): 2037-2044.
[12] Jack, C, et al (2016) Effects of pollen dilution on infection of Nosema ceranae in honey bees. Journal of Insect Physiology 87:12-19.
[13] I had a Pesticide Research Authorization to do so.
[14] Herbert E, H Shimanuki, D Caron (1977) Optimum protein levels required by honeybees (Hymenoptera, Apidae) to initiate and maintain brood rearing, Apidologie 8, 141–146.
[15] Garcia-Amoedo L & L de Almeida-Muradian (2007) Physicochemical composition of pure and adulterated royal jelly. Quim Nova 30(2):257–259
[16] Helm, BR, et al (2017) The geometric framework for nutrition reveals interactions between protein and carbohydrate during larval growth in honey bees. Biol Open 6(6): 872–880.
I gave this presentation at the Calif State Beekeepers Convention in 2013.
2013 Where does fed pollen patty pdf
Thanks to Google for scanning this pioneering and widely-cited study. Since this study is monumentally important to understanding honey bee nutritional requirements, I’ve unsuccessfully attempted to track down any copyright holder for permission to share it. But as I understand copyright law, since this reprint does not contain any indication of this pre-1978 publication being copyrighted, I believe that it is permissible for me to post it for noncommercial educational purposes. If there is indeed a copyright holder, please notify me and I will immediately take it down.
Download it here.
.
Observations on Pollen Subs
Part 1
First published in ABJ July 2021
Randy Oliver
ScientificBeekeeping.com
I get a lot of questions about what the bees do with pollen subs, why, when, and how to feed them, or even if it’s worth the effort. Since I’ve done a goodly amount of investigation on this subject, allow me to share some of the things that I’ve learned.
Beekeeping in the California Foothills
In the Sierra Foothills our colonies hunker down for a month or so starting in November for our mild but snowy winter, then slog through a long, rainy late winter/spring, take advantage of a nectar and pollen flow from mid-May through the end of June, and then survive a bone-dry summer (often with not enough rain to wet the ground from mid-May until mid-October). Due to the lack of nectar and pollen late in the season, I moved my hives out of state during the summer for over 20 years.
But once varroa arrived, I found that I could better care for my bees if I left them home, and fed them pollen sub when indicated. My sons and I have successfully done this for many years now. But that doesn’t mean that there’s a standard formula for the feeding of pollen sub that applies everywhere, or even every year.
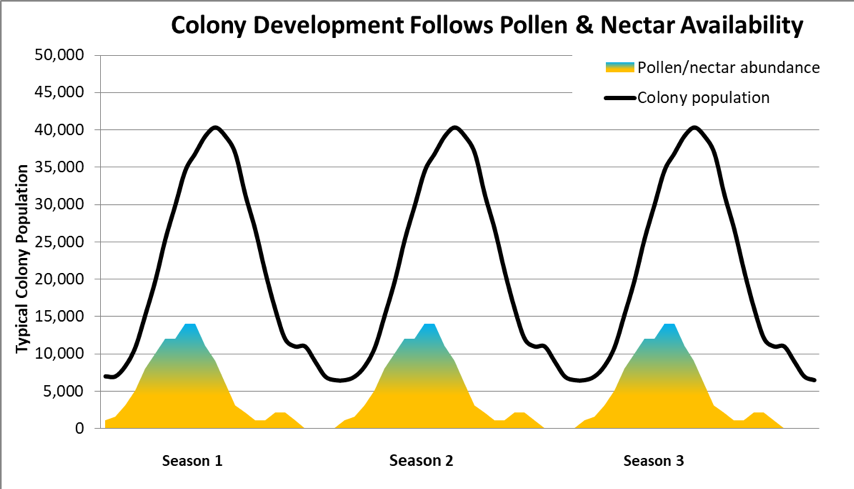
Colony Buildup Follows Pollen (and Nectar) Flows
There are typically four phases per season for a honey bee colony (Figure 1):
- Buildup on early pollen and nectar, followed by
- Reproduction (drone production and swarming), then
- Food Storage (putting up a reserve of honey to make it through the Dearth), and
- Survival through the Dearth (which may or may not coincide with the short days of winter).

Fig. 1 Note how colony buildup lags roughly a brood cycle or so behind pollen/nectar flows. If the colony gains enough strength, it will reproduce by swarming if there is still a pollen/nectar flow going on. Colonies don’t attempt to maintain a large cluster in times of dearth, and reduce the number of mouths to feed. In some areas, there may be two buildup and storage phases in a single season (such as when there are both strong springtime and autumn flows with an intervening dearth period.
In much of North America, there may be an August dearth period, then an autumn flow from fall-blooming plants, followed by a winter dearth if the temperature drops below flight temperature (since bee-pollinated plants don’t produce pollen or nectar when it’s too cold for bees to fly). But in Mediterranean climates, the dearth period occurs from July through October, with nectar and pollen flows occurring again in November through June. Thus the seasonality of the cycles above has more to do with temperature and rainfall than with day length or the calendar.
Return on Investment
If the weather cooperates, in many areas there would be no reason for the feeding of pollen sub — just let the bees do their thing. On the other hand, if you’re preparing your hives for a $200 rental contract in almonds, or a potential 200-lb. honey crop, it can be worthwhile to invest some money in pollen sub.
Practical application: In Chile there are far more hives of bees than required for the pollination of the small number of acres planted to almonds. So beekeepers there place their hives in almonds free of charge in order to take advantage of the pollen flow (as it used to be in California). They do this to build up their colonies in anticipation of later rental contracts in other tree crops, for which they get paid. Thus it isn’t worthwhile for them to spend much money on pollen sub prior to almond pollination.
It’s All About Your Goal, Pollen Availability, and the Weather
If your goal is to supply strong colonies in almonds, then they must go into winter with large clusters. If you live in an area in which there is not an autumn pollen flow to stimulate brood rearing, then the feeding of pollen sub can give you a very good return on investment.
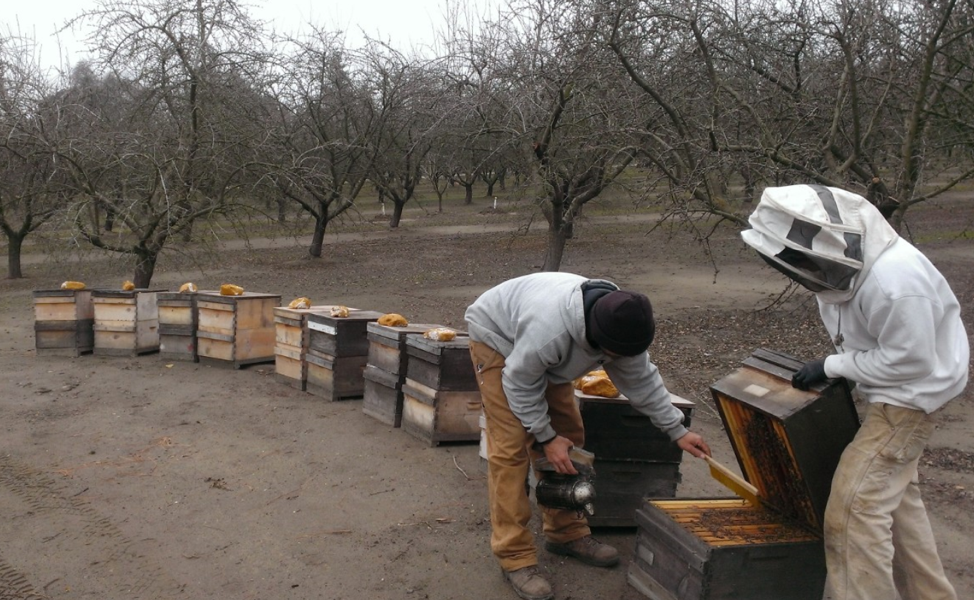
Come springtime, I’ve found that if there is a natural pollen flow going on, then it’s a waste of money to feed pollen sub ([1]). But what if the weather turns bad? For example, in my area prior to almond pollination, if the weather is warm enough for our bees to forage, then there may be enough pollen coming in from alder trees and other sources to maintain colony buildup, and any feeding of pollen sub doesn’t make a whit of difference [[2]]. But if it’s rainy in January and early February, feeding pollen sub in the rain can make all the difference as far as making grade in the almonds (Figure 2).

Fig. 2 We sometimes need to take rapidly-growing colonies off of natural pollen/nectar flows in the foothills in early February, and place them in almond orchards in the forage desert on the cooler Valley floor until the early cultivars start coming into bloom in a week or so. So we’ll give the hives a 3-lb. chunk of pollen sub so as not to lose their momentum of buildup.
On the other hand, for hobby beekeepers not going to almond pollination, feeding pollen sub to stimulate early buildup might simply lead to excessive swarming earlier in the spring.
At the other end of the season, in areas with autumn pollen/nectar flows from goldenrod and asters, the feeding of pollen or pollen sub may prolong fall broodrearing slightly, but won’t make the winter cluster any larger [[3]]. But in my area of California, autumn feeding of pollen sub can make the difference between a colony going to almonds the following February or not.
The question that I get from many beekeepers is how to know when it’s worthwhile to feed?
Don’t Ask, Just Look!
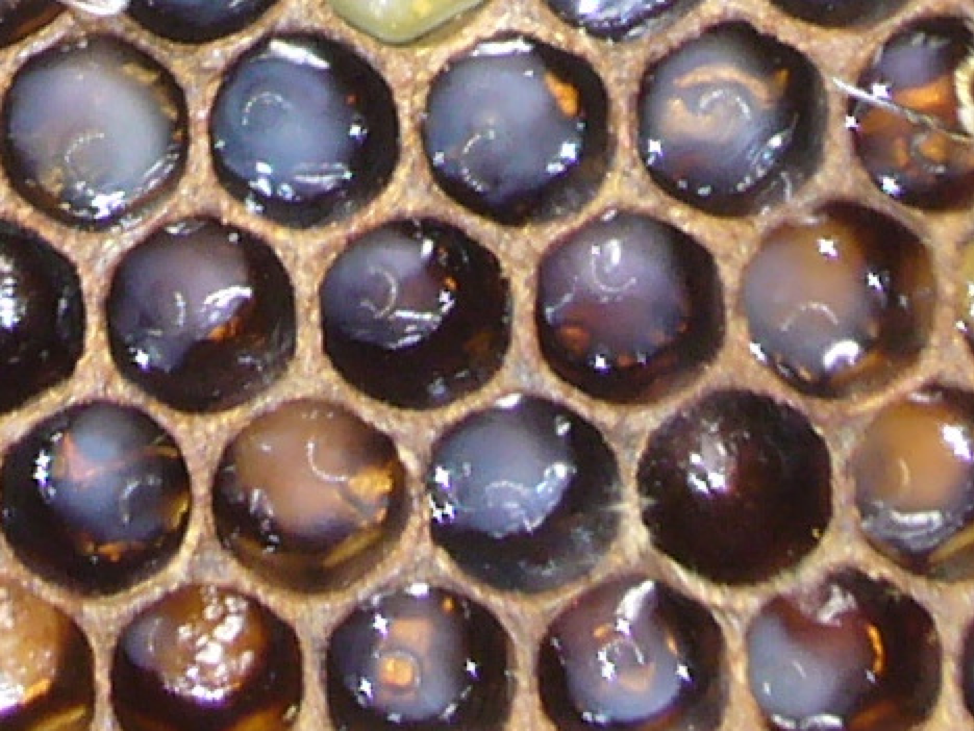
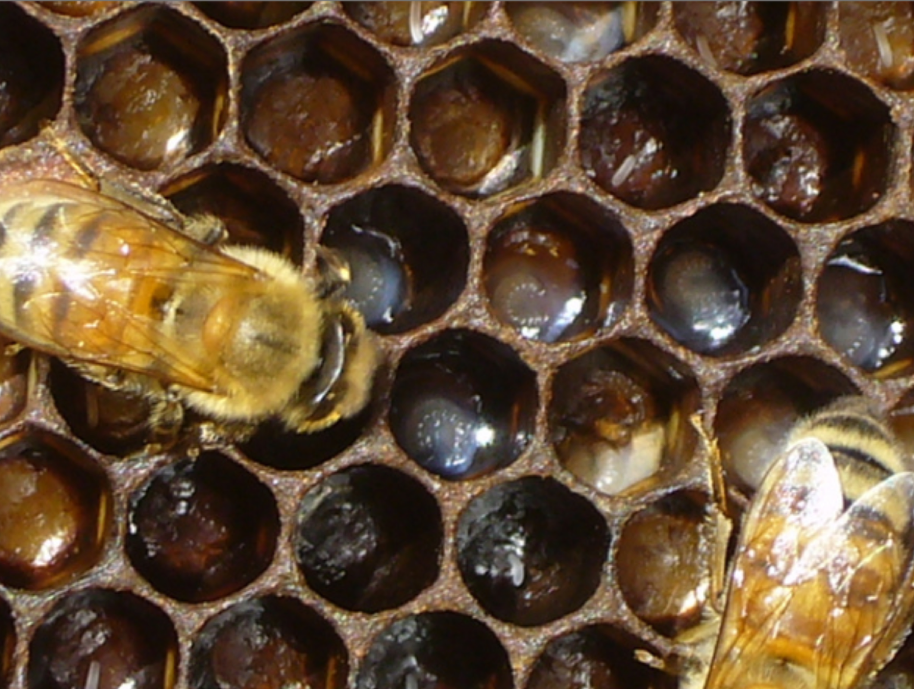
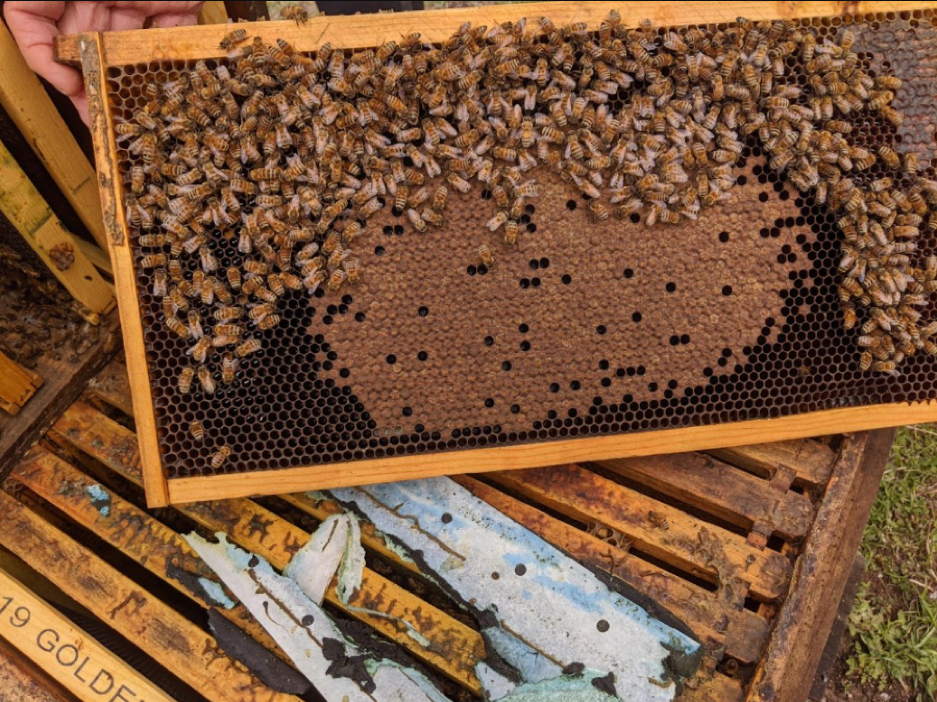
In any colony, it’s the nurse bees that run the show. If they detect that there’s a pollen flow going on, they’ll lavish the queen and larvae with nutritious jelly (Figure 3).

Fig. 3 First- and second-instar larvae “swimmin’ in jelly.” This tells you that the nurse bees are enjoying an abundance of good nutrition, and are in buildup mode. Pollen sub would be of no benefit to this colony.
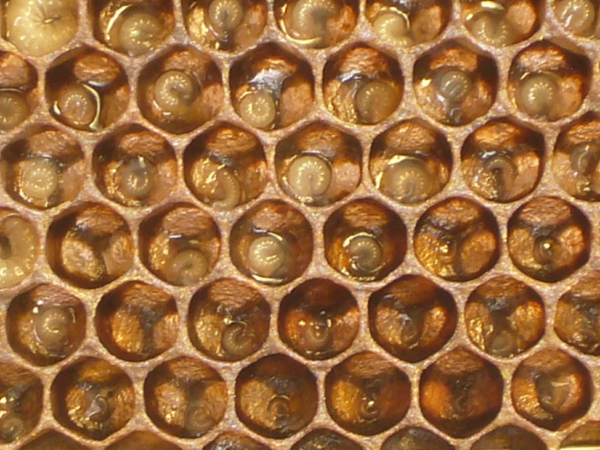
Fig. 4 At the other extreme, the nurses are providing these larvae with barely enough jelly to stay alive. Feeding a high-quality sub can allow the nurses to start producing more jelly by the next day, and quickly put this colony back into buildup mode.
Practical application: Rather than following blanket recommendations, beekeepers can simply look into their hives to see how much pollen is coming in, whether there is a reserve around the brood, and most importantly, monitor how generous the nurses are with the jelly that they are feeding to 2nd-instar larvae. And then they can decide whether their management goal calls for supplemental feeding or not.
Any proactive colony management decisions should be based upon looking ahead to the date of your goal, since it takes about two brood cycles to substantially grow a colony. So to stimulate colony buildup in anticipation of pollination contracts, a honey flow, or to produce the cohort of long-lived workers that will form the winter cluster, the beekeeper can monitor how much jelly the nurses are supplying to the young larvae during the 6-week period leading up to the goal. If, due to lack of natural forage or unfavorable weather, the nurses start to cut back on jelly production, the feeding of a few pounds of pollen sub can get them pumping again in a couple of days.
Note: Simultaneous feeding with light sugar syrup, in order to simulate a nectar flow, is generally stimulatory, but we find that at least for late-winter or autumn broodrearing, syrup may not be necessary if the colonies have plenty of honey at hand. I’m still trying to figure out just how important sugar syrup is for stimulation during dry summer weather.
What do Colonies do with Pollen Sub?
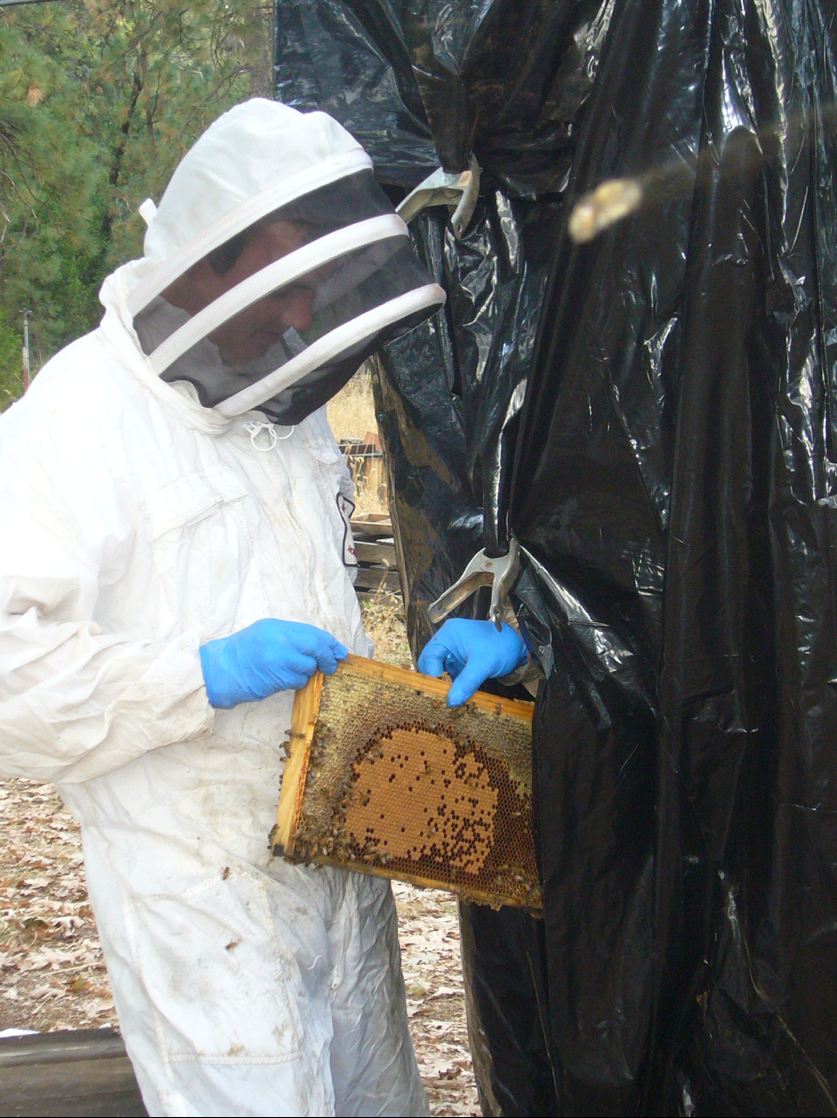
I was curious about this question back in 2013, so I mixed fluorescent tracers into pollen sub, fed it to colonies, and then inspected the frames afterwards under ultraviolet light (Figure 5).

Fig.5 We used a double layer of black plastic hung over the forks of our forklift to create a darkroom next to the test hives. Eric stayed inside in the dark, while we passed him every comb from each hive to search for any traces of luminescence from the fluorescent pollen sub. There was only the occasional speck where it had stuck to honey that a bee had been eating.
We found that the bees either consume the patty, or suck the sugar out of it and throw it out of the hive (as they do if you feed pollen sub during a pollen flow) — none is stored in the combs, nor did we see any fluorescence in the larvae or larval food. We also shook a sample of 50 bees from each frame, froze the bees, and then squashed them under black light to look at their gut contents under black light.
Practical application: Fed pollen sub in patty form may be consumed by the bees, or discarded, but they do not store it as beebread. We found workers with fluorescent gut contents distributed throughout the hives, not necessarily on the brood frames.
In another experiment, I crushed 50 bees on November 17 as a colony went into winter cluster [[4]]. I was greatly surprised to find that every single bee had a gut full of pollen. I don’t yet know whether this is a common behavior for the long-lived diutinus bees that form the winter cluster. If so, it suggested that it might be beneficial during an autumn pollen dearth to provide pollen sub late in the season in order for the diutinus bees to fully develop their fat bodies.
Practical application: Observations by Seeley [[5]] indicate that worker bees typically cease consuming pollen when they shift from nursing behavior at around 13 days of age. But there are conflicting findings in the literature as to where in the hive bees of nursing age are typically found [[6]]. Behavioral observations are typically based upon tracking paint-marked cohorts of bees to record where in the hive they are located, or whether they place their heads into cells containing beebread. On the other hand, my own studies have involved actually inspecting the guts of workers to see whether they contain pollen or fed pollen sub.
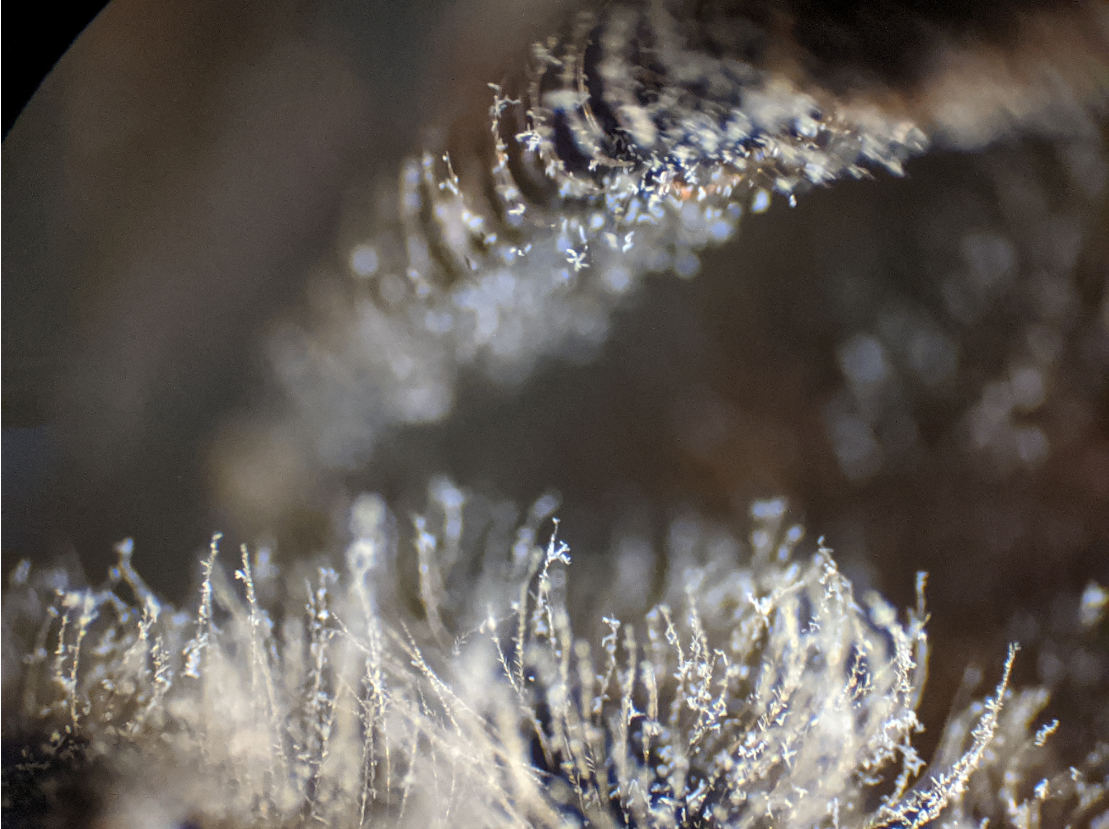
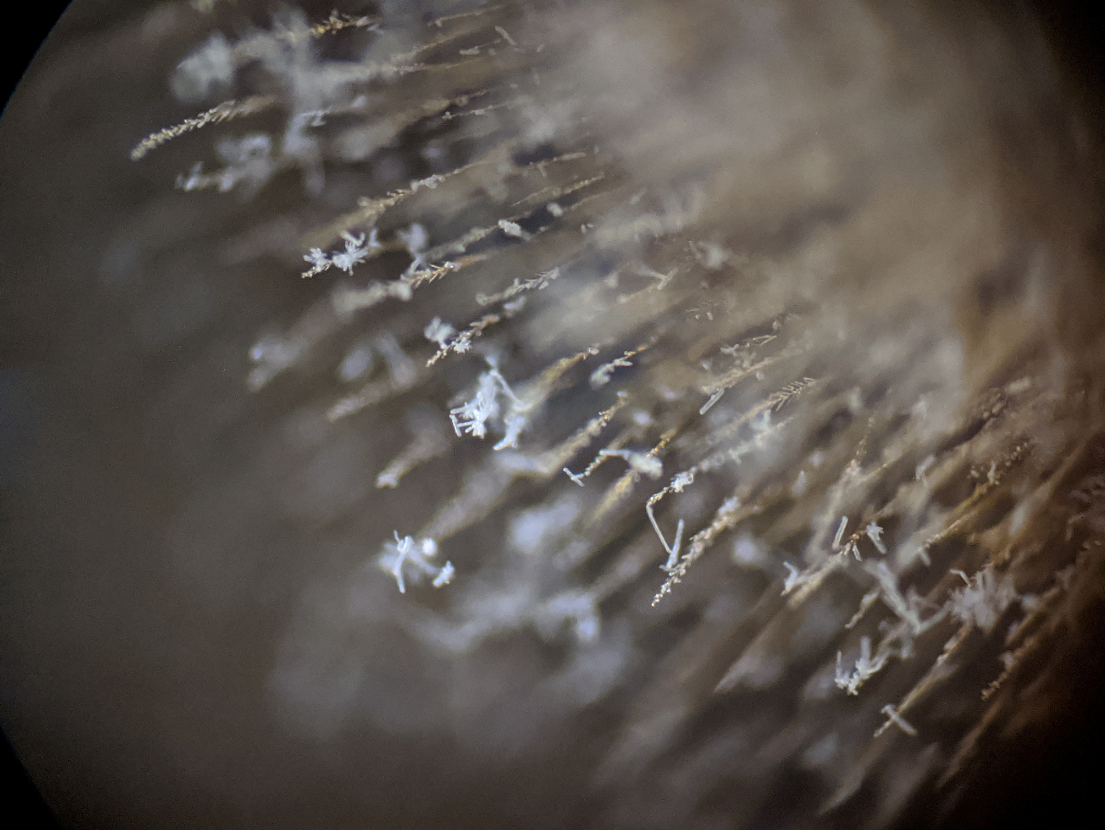
In the Sierra Foothills in autumn, foragers may fill the combs with rust fungus spores, which the nurses either consume immediately, or store as beebread [[7]]. Our colonies quickly go downhill on such a diet. But if we feed pollen sub, the nurses respond by immediately producing more jelly and ramping up broodrearing, thus allowing us to build up colonies destined for almond pollination the following February.
So I ran an experiment to determine whether workers that emerged in autumn would preferentially feed upon those rust spores or fed pollen sub, and whether they would continue to consume proteinaceous food past “normal” nurse bee age. I tested various fluorescent tracers to label the sub, and found some (that fluoresced blue or white), that stood out from any fluorescence from natural pollen or rust fungus spores. I then paint-marked 605 workers (newly emerged in an incubator) on October 13, returned them to their hive, and repeatedly fed the colony fluorescent-labeled pollen sub for the duration of the trial (while the foragers continued to bring in rust spores and some pollen.
Then, daily, and later every few days, I collected 10 of that marked bee cohort from both a brood comb and a honey comb, froze them, crushed them, and viewed their gut contents for the presence of fluorescent material (Figures 6 & 7). Since the guts of foragers are generally free of any food material, it was easy to tell whether the marked bees were consuming pollen, pollen sub, or a combination (most all contained one or both). I continued to sample the marked bees until December 2. The results are shown in Figure 6.
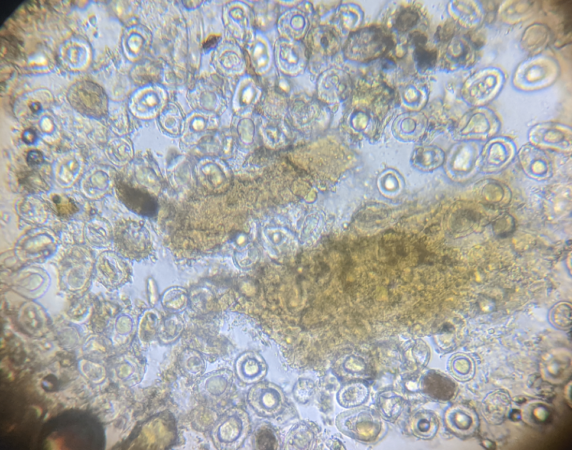
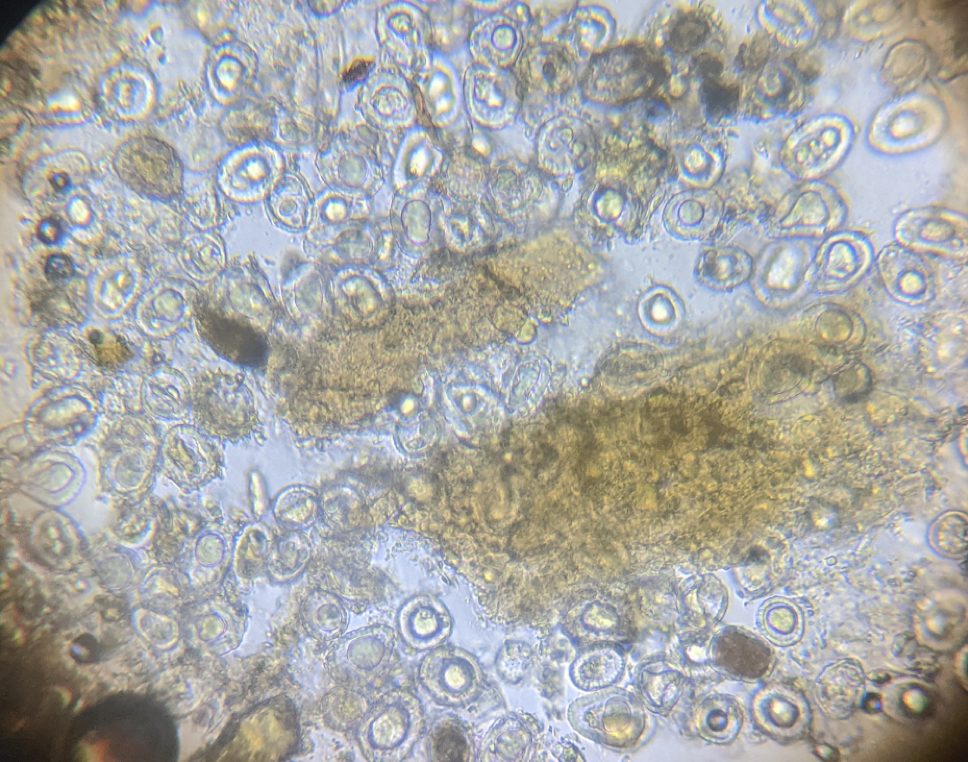
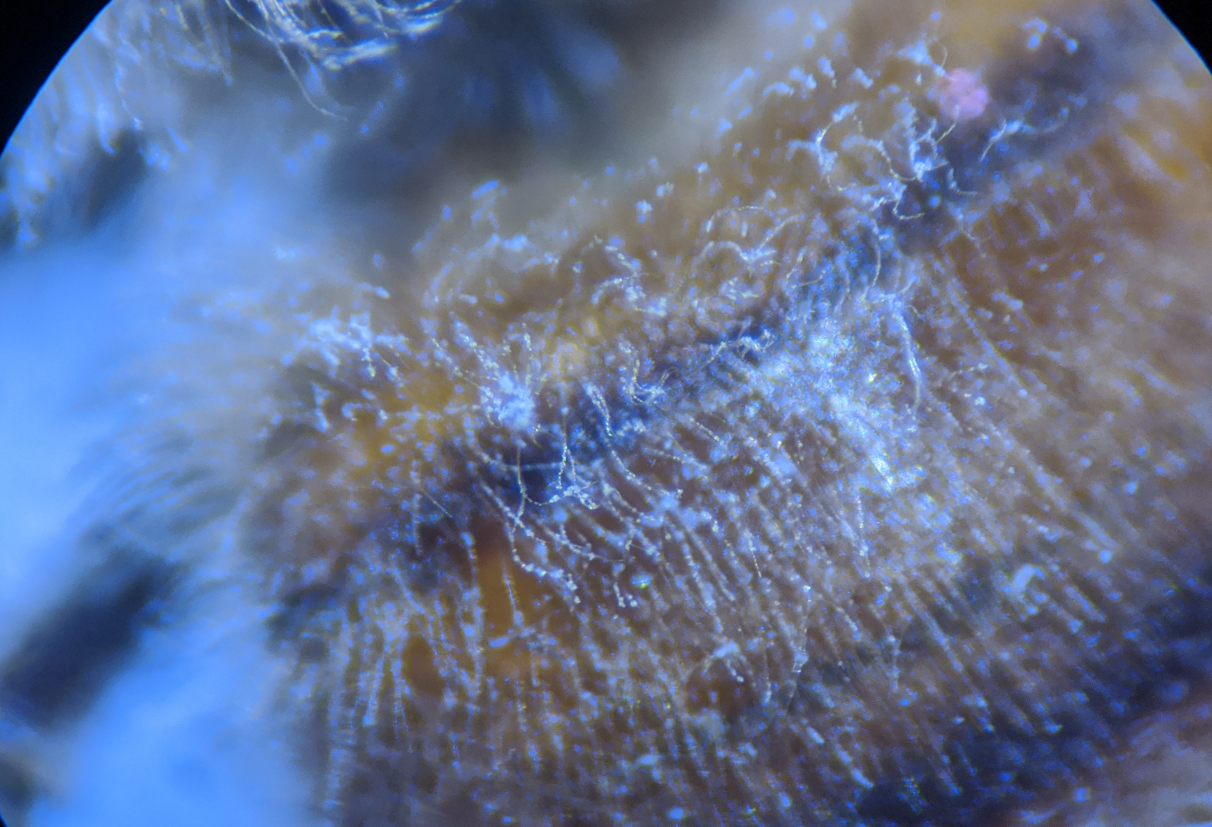
Fig. 6 Typical gut contents of the marked workers over the course of the experiment, viewed under white light at 400x. The yellow-orange blobs are particles of pollen sub; the objects that look like fried eggs are fungus spores, which are a terrible food for bees. This sort of mixture was consistent in the bee guts over the entire course of the experiment from mid-October through November, indicating the benefit of feeding pollen sub during that time period.

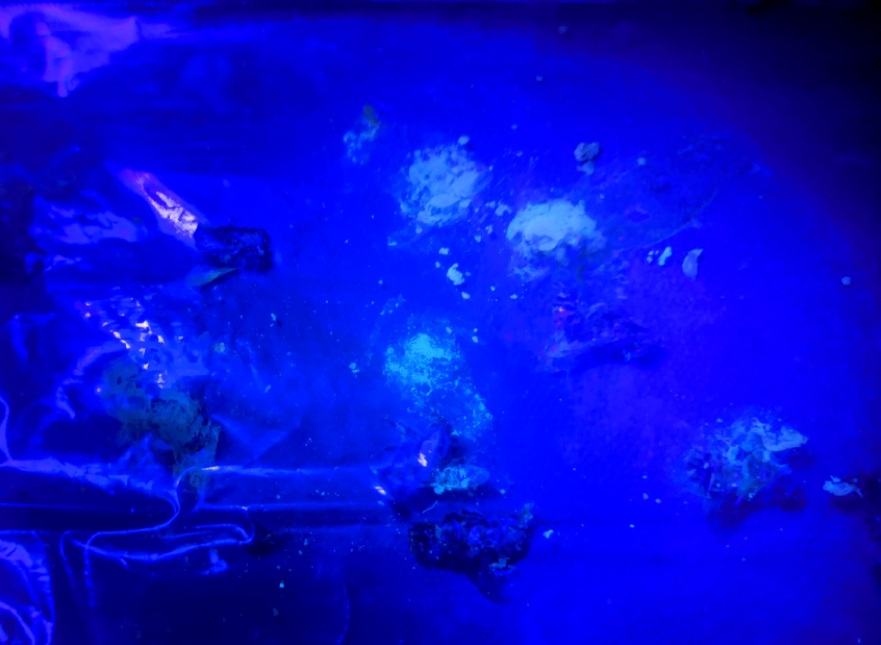
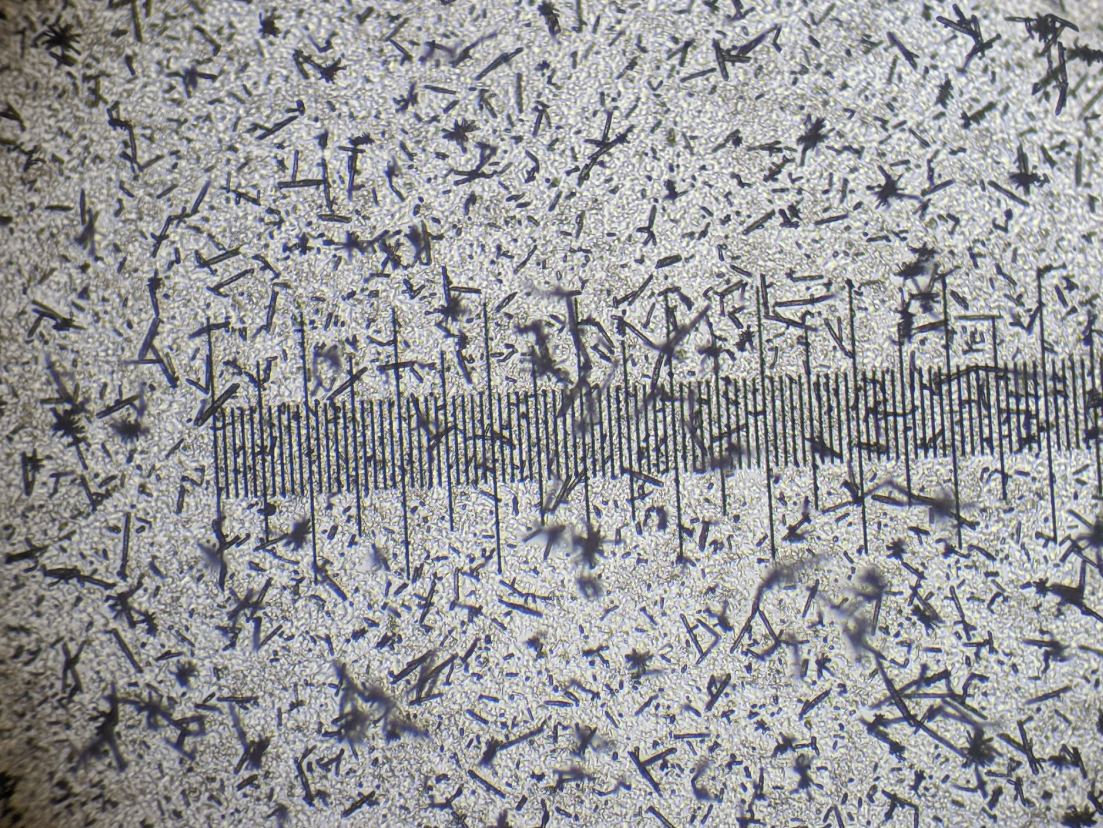
Fig. 7 Crushed bees in a plastic bag viewed under ultraviolet light. I had added white and blue fluorescent tracers to the fed pollen sub. The three crushed guts that glow white are from bees whose guts were filled with labeled pollen sub alone, as opposed to the dark blotches of mostly rust spores in the guts to the left, or mixed spores and pollen sub to the bottom right.
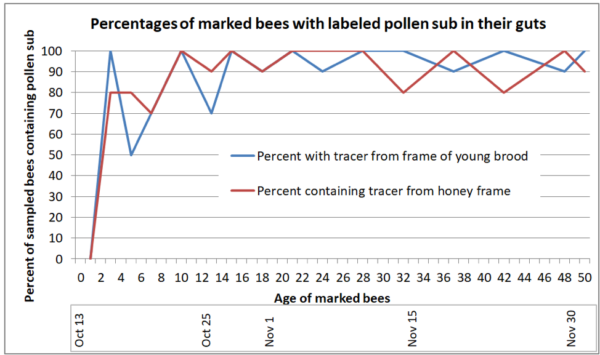
Fig. 8 None of the workers had fed on pollen sub on Day 1, but most had by Day 3. Most every sampled bee had either pollen or pollen sub in its gut — most with a mixture of the two, and a few had consumed nearly straight pollen sub. Brood rearing was winding down, and there were few young larvae as of November 25. These observations indicate that worker bees that emerge late in the season to form the winter cluster do not cease feeding on pollen after the typical cessation (at around 13 days of age) exhibited by nurses, but continue to consume pollen or pollen patty even at 50 days of age.
Practical application: Although the bees do not move fed pollen sub patty to the combs for storage, the “winter bees” do “store it” in their guts. This finding helps to answer the question as to whether late feeding of pollen sub can help the “winter bees” with fat body development, which appears to be critical for their longevity. From practical experience, such artificial feeding really helps our colonies in the arid foothills.
What about Dry Feeding Pollen Sub?
Pollen sub can also be dry fed in the yard. I’ve measured how many pounds of dry sub a group of colonies will collect in a day, and found that it’s as much as if a beekeeper was opening the hives to feed patties. Ideally, dry feeding could be a real labor saver, since all you need to do is place the dry powder out of the rain (Figure 9).

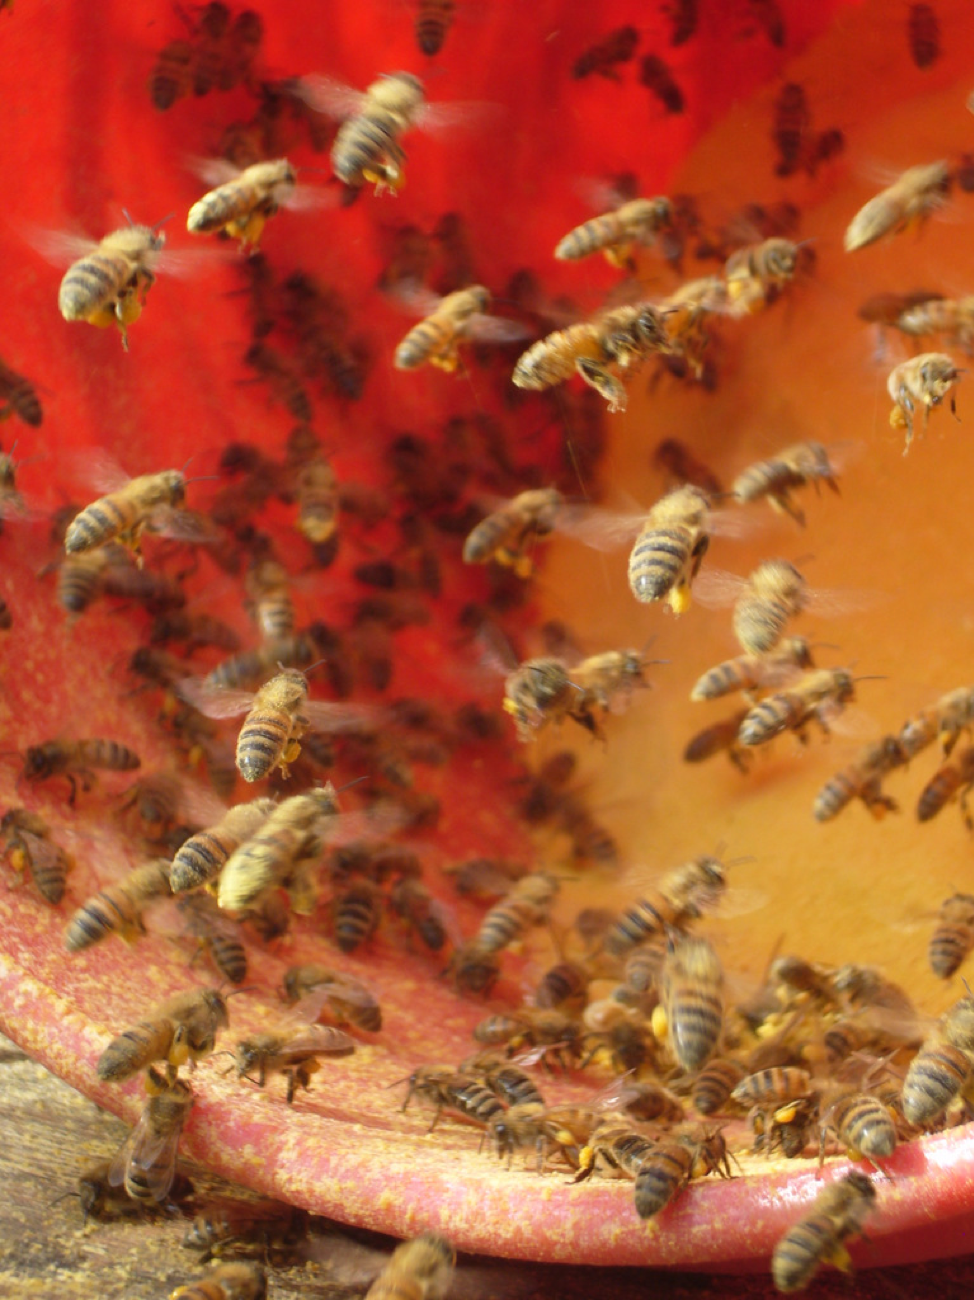
Fig. 9 Foragers eagerly collecting dry pollen sub from an open bucket. But what do they do with it when they return to the hive?

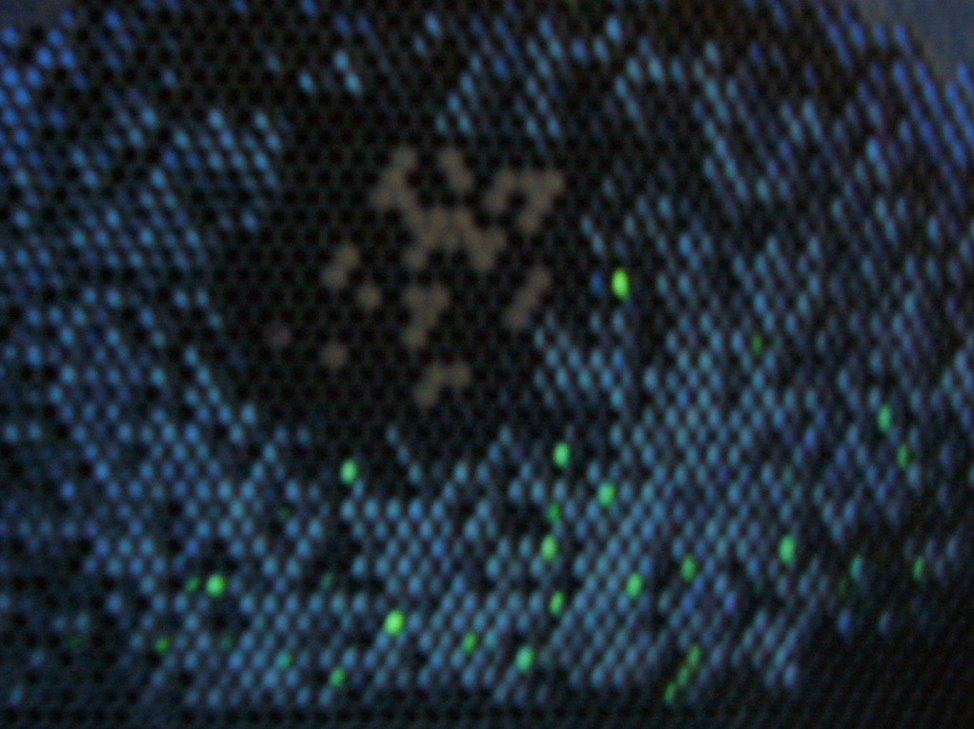
Fig. 10 I took this photo one hour after placing fluorescent-labeled dry pollen sub out at a feeding station. You can make out the patch of brood in the center of the comb, with bluish beebread of rust spores and natural pollen surrounding it. The green glows are from the fluorescent-labeled dry sub fed in the last hour. The bees packed it right into cells along with natural pollen from other foragers.
I removed some of the glowing beebread, and viewed it at 400x (Figure 11).
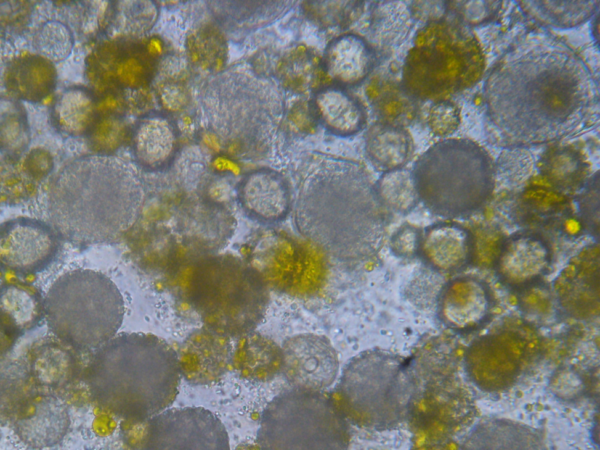
Fig. 11 Beebread consisting of natural pollen grains mixed with powdered pollen sub (the yellowish chunks).
Hungry nurse bees eagerly consume the dry-fed pollen sub from the cells — their gut contents look similar to the photo above. And in response to the dry-fed sub, within a day the nurses increase the amount of jelly being fed to the larvae (Figure 12).
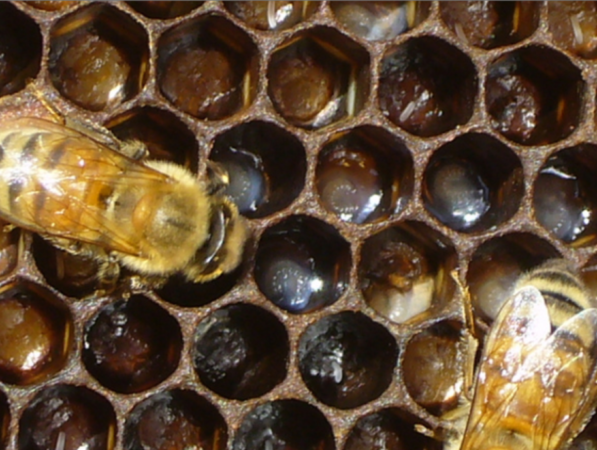
Fig. 12 The larvae in this colony were looking pretty “dry” the day before. The jelly around them was in response to dry-fed pollen sub. It’s easy for the beekeeper to see and monitor the effect of feeding pollen sub.
Aha! I thought — why should I feed patties when dry feeding is so much easier? Well, there were two things:
- The colony-to-colony foraging on the dry sub was very erratic. Some colonies gathered quite a bit and brooded up, but other colonies in the same yard ignored it. Colony buildup was far more consistent when we fed pollen sub in patty form placed into the hives.
- Some large-scale beekeepers (including myself) report that they’ve had negative experiences after dry-feeding pollen sub in autumn.
Because of observation number 2, I collected and froze combs containing either fresh beebread made from natural pollen, or beebread made from dry-collected pollen sub, and shipped them to the USDA Anderson Lab in Tucson, Arizona for testing. Patrick Maes then fed caged bees fresh or aged beebread of both types. He found that when fed fresh, the bees did fine on both the natural and artificial beebread. But when it was aged for 2-3 weeks, the artificial beebread resulted in slightly increased mortality and less thoracic weight gain, compared to aged natural beebread [[8]].
Practical application: As a coauthor of the paper, I’ll be the first to say that we should be careful about interpreting the results of a single cage trial. I’d love to hear from other beekeepers who have had either positive or negative experiences from autumn dry-feeding of pollen sub.
To be Continued
Dang, out of space already. What this article started to be about was trying to figure out why we couldn’t get the colonies to grow during my comparative trial (see the accompanying article). I guess I’ll have to wait until next month.
Citations
[1] http://scientificbeekeeping.com/when-to-feed-pollen-sub/
[2] See Figure 18 at http://scientificbeekeeping.com/a-comparative-test-of-the-pollen-sub/
[3] Mattila, HR & GW Otis (2007) Manipulating pollen supply in honey bee colonies during fall does not affect the performance of winter bees. Can. Entomol. 139: 554-563.
[4] See Figure 3 at http://scientificbeekeeping.com/understanding-colony-buildup-and-decline-part-13b/
[5] Seeley,TD (1982) Adaptive significance of the age polyethism schedule in honeybee colonies. Behavioral Ecology and Sociobiology 11(4): 287-293.
[6] Free, JB (1960) The distribution of bees in a honey-bee (Apis mellifera L) colony. Proceedings of the Royal Entomological Society of London (A) 35: 141-141.
Johnson, BR (2008) Within-nest temporal polyethism in the honey bee. Behav Ecol Sociobiol 62:777–784.
van der Steen, JM, et al (2012) How honey bees of successive age classes are distributed over a one storey, ten frames hive. Journal of Apicultural Research 51(2): 174-178.
[7] http://scientificbeekeeping.com/fried-eggs-identified/
[8] Maes, PW, P Rodrigues, R Oliver, B Mott, K Anderson (2016) Diet-related gut bacterial dysbiosis correlates with impaired development, increased mortality and Nosema disease in the honeybee (Apis mellifera). Mol Ecol 25(21): 5439-5450.
A COMPARATIVE TRIAL OF THE POLLEN SUBS 2020
Part 1
Beekeeper-Funded Research
First published in ABJ July 2021
Randy Oliver
ScientificBeekeeping.com
California has been in a “mega-drought” for a decade. In many areas, there is not enough natural forage in late summer for building colonies back up to cluster sizes large enough to supply strong hives for almond pollination in February. For many years I moved my bees out of state to better summer/fall pasture, but then learned that I could instead build them up near home by providing pollen sub.
My sons and I now purchase a goodly amount of pollen sub each season, so we have considerable self interest in objectively comparing the relative performance of the products on the market. I ran a comparative trial of subs back in 2013 [[1]]. Since then, since I’m continually asked about pollen subs by beekeepers worldwide. That, plus the fact that there are two new products on the U.S. market, had gotten me teetering on the edge of running another field trial (they’re a LOT of work). And then a group of commercial beekeepers from near Bakersfield, California, who wanted to test their “homebrew” formulation against others on the market, kicked in some funding toward me performing a follow-up trial.
Practical application: In the increasingly-arid West, the main income source for many beekeepers is from renting hives for almond pollination. Due to our lack of natural nectar and pollen flows in late summer, many of us depend upon providing our bees with “artificial diets” to stimulate the rearing of the brood that will form the winter cluster. This experiment is essentially a “progress report” on the state of development of such artificial diets.
Experimental Design
I ran this experiment as a “Consumer Reports” type of unbiased comparative trial of what’s on the market. I asked each manufacturer to provide a fresh batch of their “top of the line” product.
Disclaimer: Although the manufacturers generously provided the pollen subs, I received no compensation or other influence from any manufacturer. Our out-of-pocket costs, labor, and lost income due to the poor performers came to over $20,000, which was funded solely by donations from beekeepers to Scientific Beekeeping.
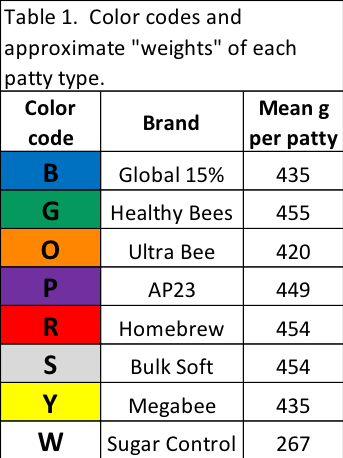
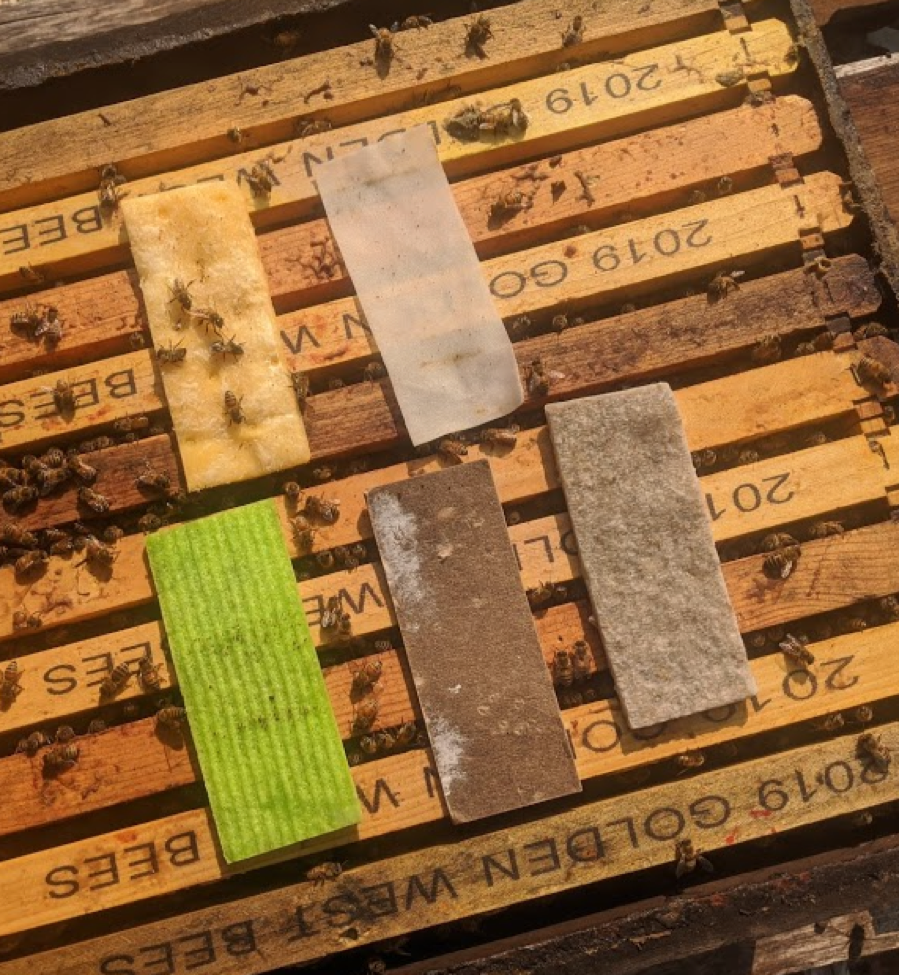
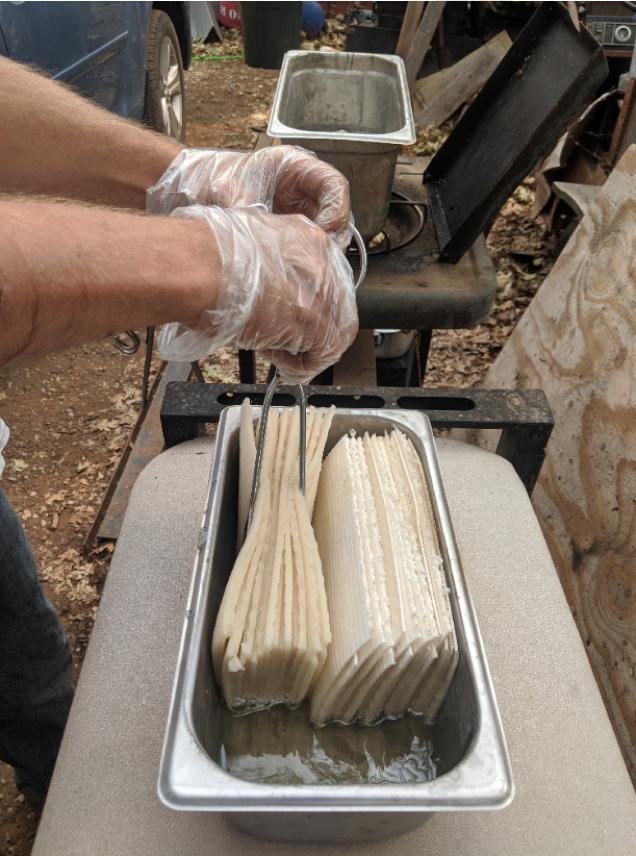
The subs came preformed in roughly 1-pound patties sandwiched between waxed paper sheets (Table 1), with the exception of Mann Lake’s Bulk Soft, which we cut into 1-pound chunks for each feeding. I mixed and rolled out the Sugar Controls myself, consisting of hand-kneaded Drivert sugar mixed with Dadant or ProSweet bulk syrup into a patty, weighed to provide a half pound of sugar (since most of the subs were around 50% sugar). I assigned a color code to each patty type (Table 1), in order to keep them all straight during feeding and analysis (Figure 1).

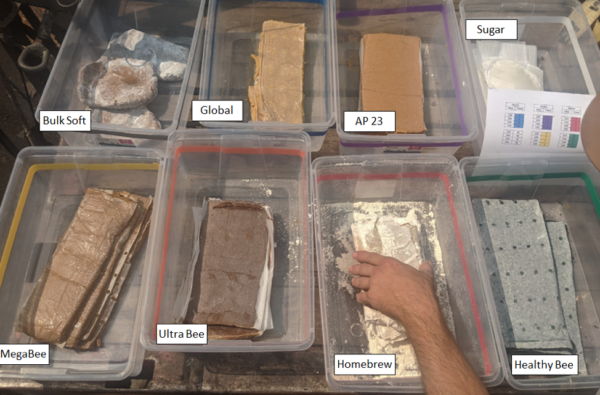
Fig. 1 A view of the tested patties, each type in a color-coded tub for field distribution. Two of the subs contained natural pollen (Global 15% and Homebrew), and thus should be considered as “pollen extender” patties, as opposed to being “pollen substitutes” (artificial diets).
Practical application: Using bee-collected pollen in a diet confers the risk of transmitting pathogens. I’ve long wondered whether there was a connection between the widespread practice of (illegally) feeding bee-collected pollen from China (which could contain pathogens from two species of honey bee, as well as other pollinators), and the rapid spread of Nosema ceranae and viruses prior to the CCD epidemic in the early 2000s. Trapped pollen can transmit AFB, chalkbrood, and nosema spores as well as viruses, so be careful of its source. I checked with Global, and the pollen they use is irradiated by IOTRON before coming to their warehouse.
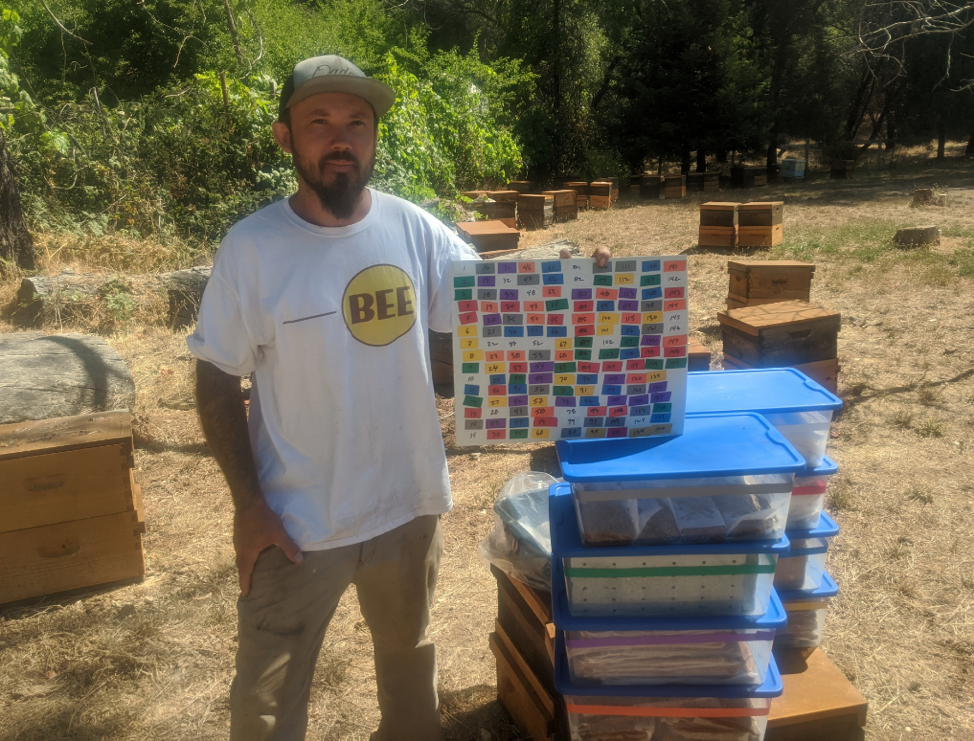
As you might imagine, feeding 144 randomly-assigned hives the proper patty at each feeding required careful handling and distribution of the patties. We couldn’t really “blind” ourselves as to treatment when we were applying the patties or grading, since some of the patties had distinctive looks. So we put a piece of colored tape on the number tag of each hive (Figure 2), and did our best to not pay attention to patty type, although it soon became clear that some “colors” were consistently outperforming others.
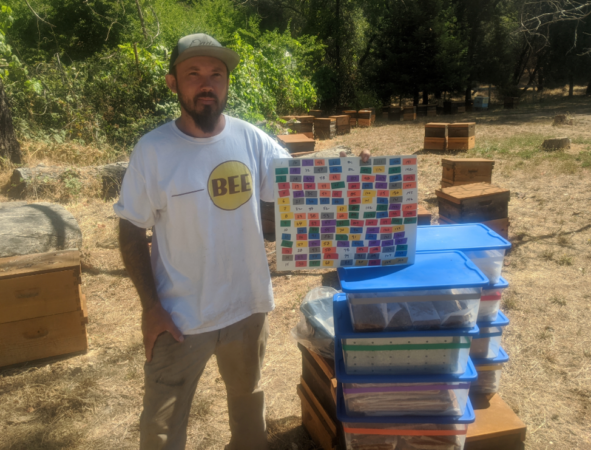
Fig. 2 First feeding: Eric showing the color-coded patty delivery tubs and hive color-code tapes (before placing them on the hive number tags), in order to ensure that every hive got the correct patty type at each feeding.
For every feeding, we carefully first separated each sub type into the color-coded tubs, and then laid the patties out by type on tops of the hives in each yard, and finally double-checked for proper distribution prior to placing the patties into the hives.
Practical observation: The subs varied widely in texture and moisture content. (I strongly suggest to the manufacturers that they make their patties moist, and to wrap each boxful in a plastic bag, so that the patties don’t dry out during storage.)
Choice of Trial Yard Locations
In our California operation, we normally build up established hives up for winter by feeding them pollen sub (and sometimes sugar syrup) during September and October. For this and other tests of pollen subs, I intentionally place the hives in yards which, from previous experience, we know that colonies not given supplemental feeding will go downhill in strength.
We ran three replicates of this trial in different yards, in order to test the subs under various conditions of elevation and vegetation type. Yards E and T were at ~1600 ft), my home yard (H) at 2850 ft; each yard was surrounded by scarce, but differing floral resources.
Experimental history: We ran a pollen sub trial in 2018 in Yard E, in which we were able to successfully nearly double colony strength by feeding from early August through early November [[2]], and assumed that we’d be able to do the same in 2020 (Figure 3).
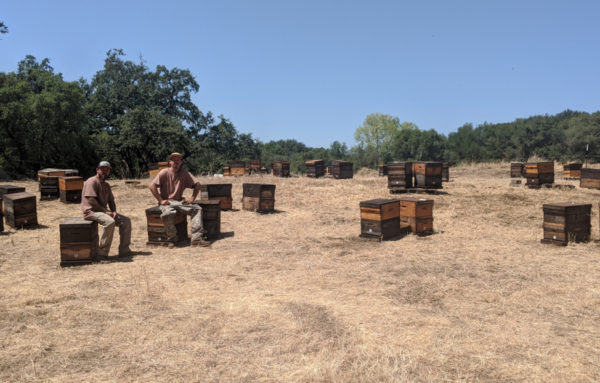
Fig. 3 Yard E is typically a disaster for colonies after mid-July. Because it had worked well for a similar trial in 2018, we intentionally stocked it heavily with 72 hives to ensure competition for any natural pollen.
Grading for Strength and Analysis
We used California-style cluster grading (number of frame interspaces full of adult bees — “FOB”), done on a cold day or at dawn following a cool night, before the clusters have broken (we can consistently grade to quarter-frame consistency). Instead of trying to equalize all 144 test hives for strength, we started the trial with singles from late nucs, ranging from 5-12-frame strength (median 7.5 FOB). I did this intentionally, in order to see whether starting strength made a difference.
Note that the hives were not physically placed in actual groups, but were scattered throughout each yard. For a randomized block design, we recorded the initial grades for strength in each yard, sorted them from strongest to weakest, and then randomly assigned the eight pollen sub types first to the strongest eight hives in that yard — no matter where they were in the yard — and then to the next strongest eight hives, and so forth down the line. Thus, each patty type was fed to hives over the full range of starting strengths.
We graded for starting strengths on 10 August. Unfortunately, nighttime temperatures did not drop low enough for tight cluster formation, so we did our best. Since cluster grading is designed to be a comparative grade (rather than an absolute estimation of the number of bees), we graded consistently, and so we felt that the gradings were accurate enough, relative to the other hives in each yard, for comparison at that time point.
Conversely, the midpoint November grading took place during a sudden cold snap, and the bees were packed as closely as they could get; median cluster size had shrunk considerably. The February endpoint grading was performed on a cool day when the clusters were moderately tight.
Practical application: Despite the effect of temperature on cluster size, for the best-performing pollen sub group, cluster size shrunk only slightly between the hot August (median 7.75 FOB) and cold November gradings (median 6.5 FOB), and had grown larger than starting strength by February (median 8.4 FOB).
Again, since the measurements at any time point were taken at the same time and under the same conditions in each yard, they would reflect the relative strengths of the colonies in that yard at that time. I’m comfortable with the FOB grading data as collected.
Timeline
The trial ran from 10 August, 2020 through 1 February 2021, taking a brief break from feeding when the bees ceased consuming the patties when cold weather hit in November (Figure 4).
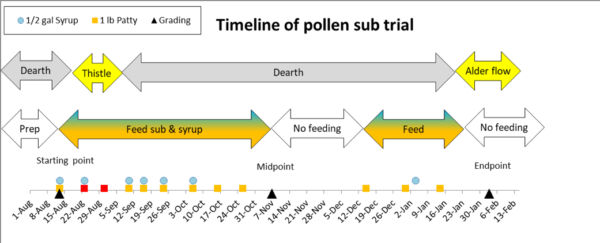
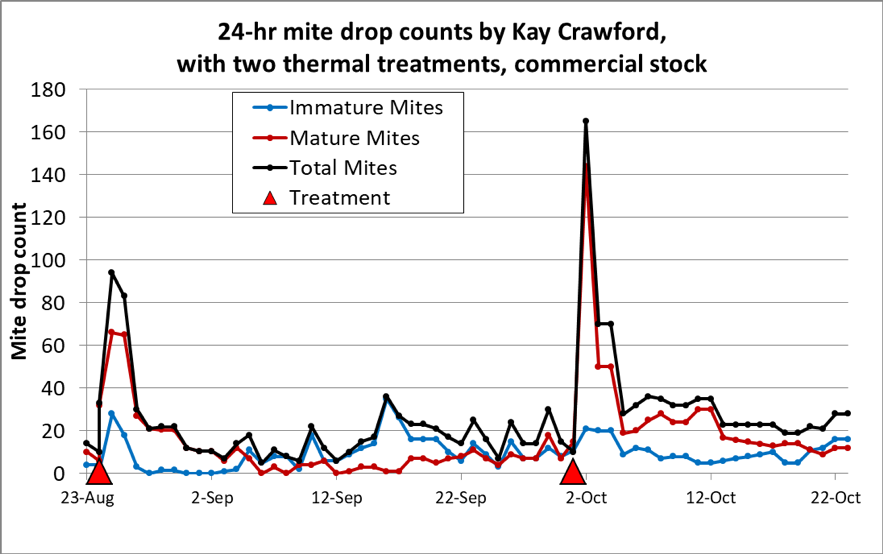
Fig. 4 The above chart shows the timings of feedings and gradings, as well as the occurrence of two natural pollen flows (the thistle flow occurred in only two of the yards; yard H received 2 feedings [red] during that time). We performed final grading prior to the emergence of any bees from the alder flow.
We prepared the hives as singles during July, added second brood chambers containing eight drawn combs and two combs of foundation (in order to give the bees room to store stimulatory sugar syrup without crowding out the brood nests) shortly before the first grading for strength on August 10, and began feeding the pollen subs and syrup on August 15, continuing through October 29, prior to midpoint grading on November 9 and 10. We were surprised by a nectar and pollen flow in yards E & H in mid-August, so skipped feeding those yards during that time. We ceased feeding after midpoint grading, and resumed feeding on 15 December. The final grading was performed three weeks after the start of a natural pollen flow from alder trees, before any bees that could have been reared on alder pollen emerged.
Nutritional Physiology Measures and Gut Microbiome Analyses
In order to see whether the feeding of different pollen subs affected the gut microbiota, vitellogenin levels, or body weights of the bees, we also took samples of worker bees from a pollen comb at the start and midpoints, froze them on dry ice, and shipped them to my collaborator, Dr. Vincent Ricigliano at USDA for molecular analysis.
Feeding of Pollen Subs and Sugar Syrup
We monitored consumption of sub for each yard, and as soon as the most-attractive subs were nearly consumed, we would give the yard another round of feeding. Thus, the feeding of pollen sub was essentially ad libitum, with unconsumed patty remainders being removed and weighed (Figure 5). We generally fed a half gallon of light syrup at each feeding of pollen sub, along with some intermediate feedings, but refrained from feeding syrup when the clusters were still surrounded by ripening syrup from the previous feeding. By November, all colonies had largely filled the second chamber with sugar “honey.”
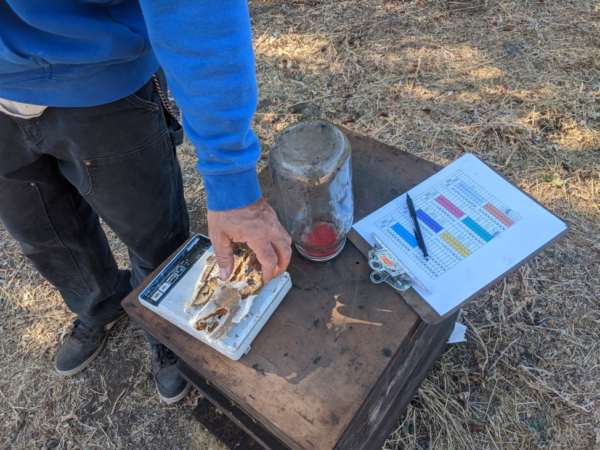
Fig. 5 At each feeding, we removed and weighed any sub that had not been consumed.
Overall, between mid-August and the end of October we fed every hive seven 1-lb. patties (nine in Yard H, plus 13 half gallons of light syrup (diluted ProSweet or Dadant).
Details and Observations
At the first feeding, the bees eagerly consumed all the subs. Not surprisingly, the most rapidly consumed patties were the two containing natural pollen. The only sub for which we saw bees kicking out unconsumed portion was the Healthy Bee (I suspect due to its thyme oil content), which we consistently observed in front of the hives (Figure 6).

Fig. 6 Unconsumed green Healthy Bee patty debris in front of a hive. This was the only patty type for which we consistently saw removal.
In mid-August, once daytime highs exceeded 95°F, there was an unexpected nectar and pollen flow from Yellow Star Thistle in the E and T yards (I will expand on this in another article). In response, the colonies packed a couple of combs with beebread, and seriously ramped up broodrearing. Since I’ve previously found that there is no benefit to feeding pollen sub when there is a flow of natural pollen going on [[3]], we skipped two feedings of pollen sub at those two yards, until the colonies had consumed most of the natural pollen, and had cut back again on broodrearing.
There were also at least two tiny surprise swarms in Yard E (Figure 7).
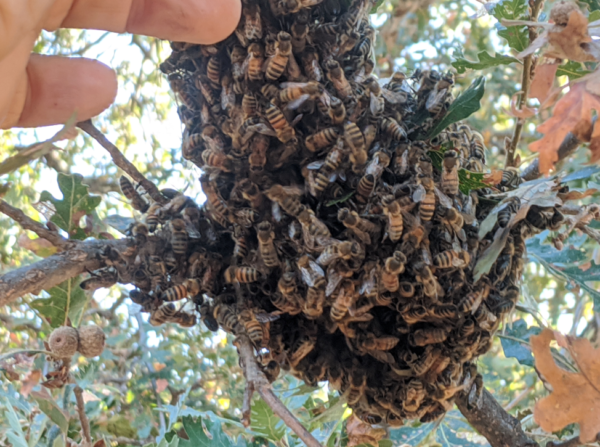
Fig. 7 We also found a couple of small swarms in Yard E, but were unable to determine which colony or colonies they had come from. At any feeding, whenever I suspected that a colony had an issue, I’d check to confirm queen rightness and good larval survival.
This was also the first year that we regularly saw Small Hive Beetle larvae on pollen patties. We removed any infested patty parts, weighing them before disposing of them (Figure 8).
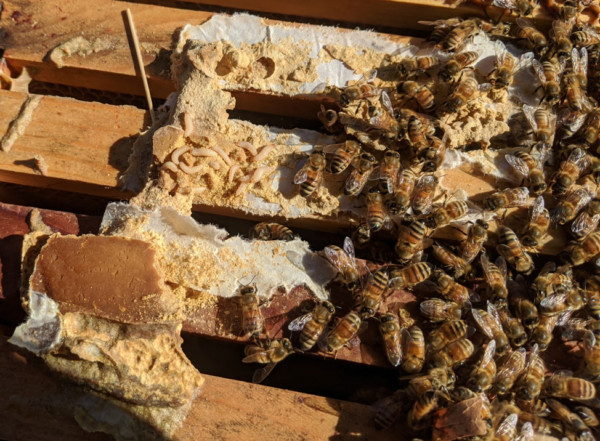
Fig. 8 There were only minor issues with Small Hive Beetle larvae, and we seldom observed them on the thyme-scented Healthy Bee patties. Note how the portion of this patty outside of the cluster has dried, which was typical for those which were not rapidly consumed (we made a point to place all patties within the cluster as best possible).
The Refusal of Colonies to Grow
Contrary to our experience in previous years in the same yards, during which fed colonies increased in strength [[4]], we were frustrated by the number of colonies that didn’t grow, despite having very low mite counts and consuming a goodly amount of their patties at every feeding. This went on week after week during September and October. A number of colonies cut back on their consumption of pollen sub, and we could often see a small number of cells filled with incoming natural pollen throughout the trial. The colonies continued to gain plenty of weight from the fed sugar syrup, but simply refused to grow in strength. I will discuss this frustrating turnout in another article.
At each feeding, whenever I saw a colony that was unusually week, I pulled frames from the brood nest to confirm that it was queenright, exhibiting good larval survival, and free from brood disease. I also regularly spot-sampled to confirm that varroa was not an issue. I took photos in mid-October of the brood in one very weak colony (approximately a 3-frame cluster) that was consuming its pollen sub well (Figure 9).
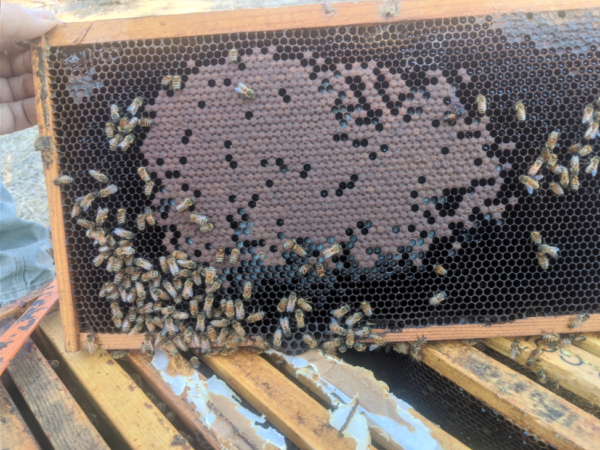
Fig. 9 A brood comb from a very weak hive on October 15. Note the solid brood pattern, indicating good survivorship of the larvae. Yet despite rearing healthy brood, these weak colonies simply refused to grow.
Was the poor colony growth due to the high temperatures? The temperature on the day (October 15) of the photo in Figure 9 reached 95°F — 15 degrees hotter than on the same day in 2018 (when colonies grew well in the same yard). The colonies were anything but hungry — they were being continuously fed pollen sub, and many stored so much sugar syrup “honey” in their upper brood chambers that I checked every hive to ensure that every queen had access to a frame of empty dark drawn comb above the cluster in which to lay eggs, exchanging frames if necessary (Figure 10), and held off on syrup feeding for several days afterwards so that they wouldn’t fill them with syrup and prevent the queen from utilizing them. To my surprise, in no case did I observe a colony utilizing that comb to expand the brood nest.

Fig. 10 I placed a drawn comb centered above the brood of every hive to provide open cells for brood nest expansion upwards. Unfortunately, none of the colonies took advantage of them.
Practical application: During the hot, dry weather many colonies appeared to go into “survival mode” (as opposed to “buildup mode”), storing fed syrup and cutting back on their consumption of the pollen subs. Even colonies that consumed every bit of their continually-fed subs barely held their strength. I spoke with several other professional beekeepers in hot climates, who often observe the same — that colonies cease growing until the weather cools or a nectar flow begins. But as I will discuss in another article, it’s not clear that temperature alone is the issue.
Midpoint Grading and Winter Break
We stopped feeding shortly before midpoint grading on 9 November, since the colonies were winding down broodrearing as the weather cooled. After grading, we swapped frames of honey to roughly equalize the amount of honey above the clusters for all hives.
Resumption of Feeding
We resumed feeding pollen sub on 15 December, and gave each hive a half gallon of light syrup on 5 January for stimulation. During this final feeding period, due to there being a wide range of cluster sizes, we fed each colony as much patty as it would consume (so as not to hold back the stronger colonies) — up to 4 lbs. per hive — and didn’t remove any unconsumed patty.
Since I suspected that the high concentration of thyme oil in the Healthy Bee patties was causing problems, after consultation with the manufacturer, he supplied me with a batch of thyme-oil-free patties, which we used at the resumption of feeding (Figure 11).

Fig. 11 A photo at final grading of one of the better Healthy Bee hives. It had been consuming a version of Healthy Bee without essential oils starting in December. But there had been some alder pollen coming in, so I can’t say that this nice pattern was entirely from the thyme-oil-free Healthy Bee.
We ceased feeding additional pollen sub once our expected natural flow of alder pollen began in January. The grand total of patty consumption over the entire course of the trial ranged from 9-13 lbs. per colony.
As February approached, there was a goodly amount of sealed brood in the hives, and the colonies would soon be rapidly increasing in strength for almond pollination. In my 2013 trial, we learned that once alder pollen started coming in, all colonies grew equally. So we performed final grading 20 days after the beginning of the alder pollen flow, prior to when any brood that could have been fed by nurses consuming alder pollen could emerge. We graded on the cool morning of 1 February (Figure 12).
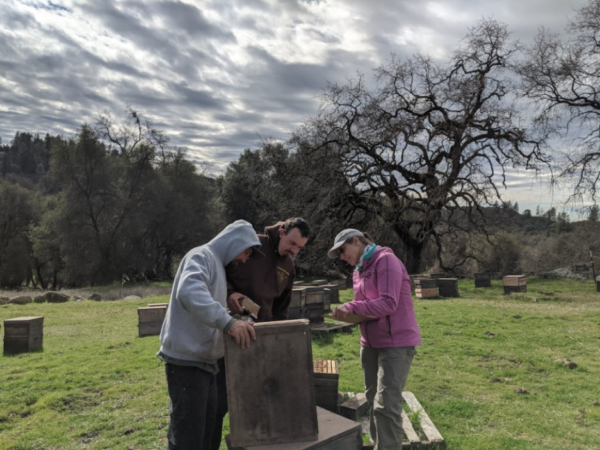
Fig. 12 During grading, I stepped back to snap a photo of Eric, Ian, and Alice Dunbar recording the number of filled frame interspaces in an upper box.
Results
Despite the disappointing growth of some of the test colonies in response to ad-libitum feeding of artificial diets (compared to the amount of growth in previous years), by the time we were ready to take the colonies to almonds, there was nonetheless a very clear benefit from feeding pollen sub, with a return of around $5 value in rentable frames of bees for almond pollination for every dollar invested in pollen sub (compared to the Control colonies fed sugar alone).
Coming Next
I’m out of space, but will present a detailed breakdown of the results of this trial in subsequent installments. A teaser: Some of the results were surprising to us, and sometime conflicting. As far as the resulting numbers of frames of bees for rental in the almonds, some subs clearly outperformed the others. But even more exciting, it appears that we could have predicted their performance, relative to each other, based solely upon an analysis of their amino acid contents. This finding may allow all beekeepers and manufacturers to improve the formulations of their pollen subs, and I’ve created a handy calculator to allow them to do so.
Acknowledgements
I wish to thank the manufacturers who donated fresh batches of their products, beekeeper Peter Borst, who assisted me greatly in library research, and Dr. Vincent Ricigliano, who will coauthor the next installment. This research was funded by donations by beekeepers, which allow me to perform these expensive field trials. Thank you for your support!
References
[1] http://scientificbeekeeping.com/a-comparative-test-of-the-pollen-sub/
[2] http://scientificbeekeeping.com/an-experiment-to-improve-pollen-sub-part-2/
[3] http://scientificbeekeeping.com/when-to-feed-pollen-sub/
[4] http://scientificbeekeeping.com/an-experiment-to-improve-pollen-sub-part-2/
Always use the most current version, as I continually improve, correct, and update the calculator — many thanks to beekeeper Yannis Petrakis from Crete, Greece for testing it and pointing out errors and improvements!
Current version (updated 31 May 2023) Randys-amino-acid-ratio-calculator-V2023-c
In my research on pollen subs, I’ve come to find that some outperform others.
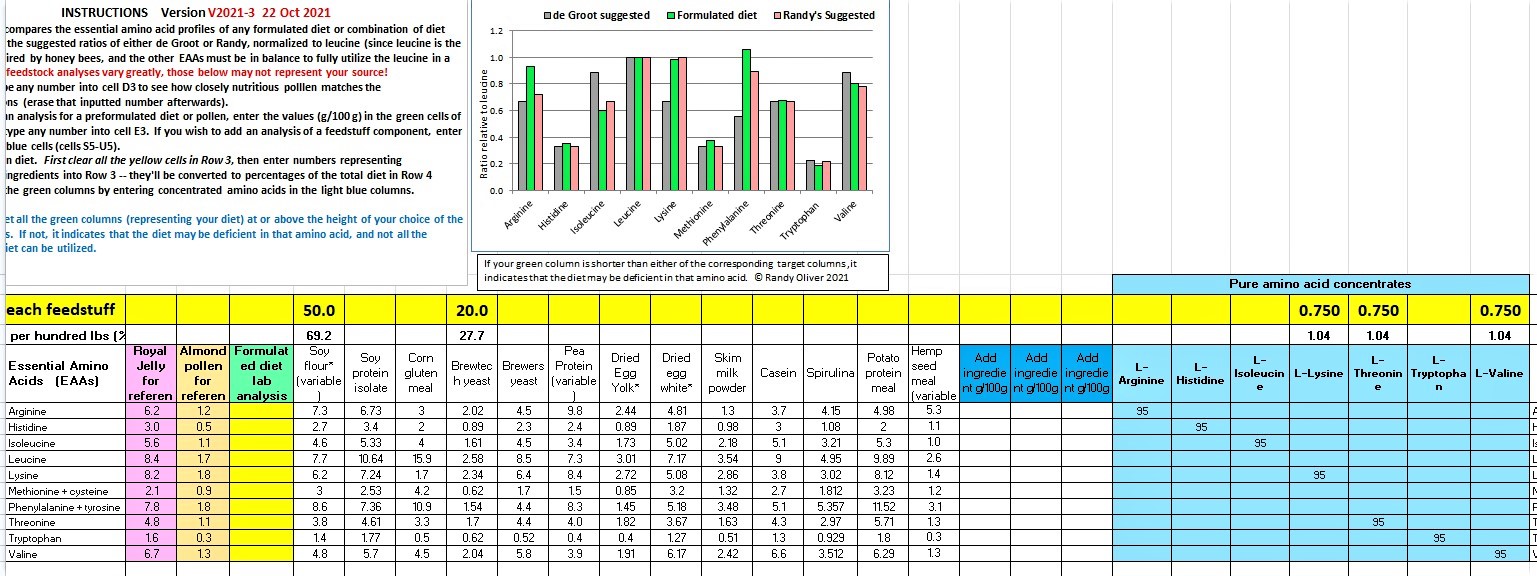
Based upon their analyses, there’s a strong case to be made that getting the essential amino acids (EAAs) into proper balance is very important.
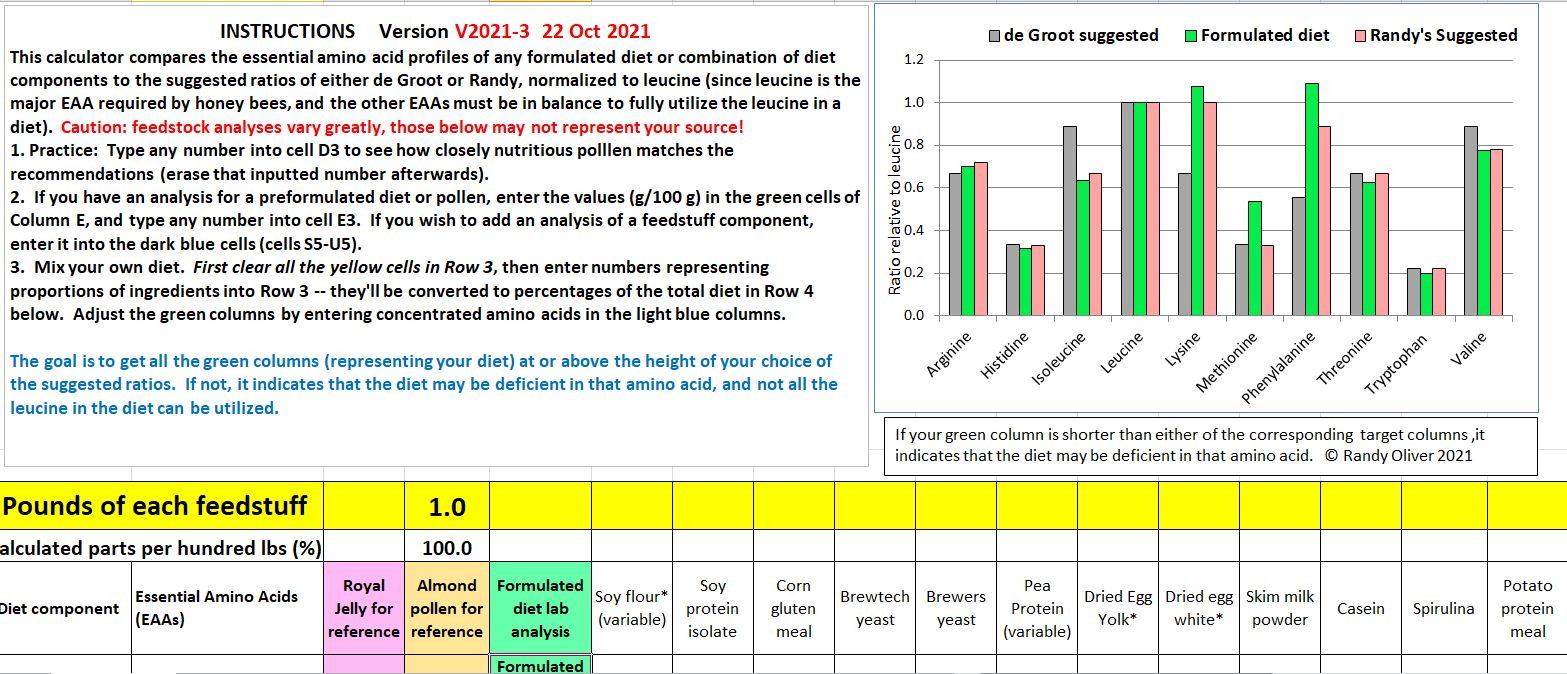
So I created a calculator to help any beekeeper or manufacturer to check the EAA ratios of their formulations against de Groot’s recommendations. Here’s a snip of the worksheet in Excel. The gray columns represent de Groot’s recommendations; the red columns indicate my revised suggestions (justification currently in press in ABJ), the green columns represent the diet that you input. Any green columns shorter than their corresponding gray (or red) column may indicate a deficiency in that EAA.
The calculator allows you to determine the amount of any EAA concentrate to add to your formulation in order to reach the correct balance.
March 2023: I updated the calculator to show percent total protein, the EAA: total protein ratio, and corrected some errors for the EAA concentrates, which now show how little of them you need to add to balance a formulation.
Here’s an example of it being used to balance a diet:
Have fun!
Randy
A Field Trial of Probiotics
Beekeeper-Funded Research
First published in ABJ May 2021
Randy Oliver
ScientificBeekeeping.com
In recent years, we’ve learned that the honey bee gut hosts a microbiome consisting of several core groups of bacteria (Figure 1), which if disrupted, may have detrimental effects upon bee health [[1]]. Many beekeepers, in the hope of improving colony health, especially when feeding artificial diets, or after application of antibiotics, have asked me whether there is a benefit from feeding a probiotic supplement. So I ran two field trials to find out.
Introduction
Probiotics are products containing live “beneficial” microorganisms, typically promoted with claims that they provide health benefits when consumed, generally by improving or restoring the symbiotic bacteria living our human gut, or those of our managed livestock. However, there is often little supportive evidence for those claims [[2]]. And in the case of the honey bee, such claims are especially questionable, since the inoculation of the bee gut occurs naturally in the hive during its first week after emergence [[3]], during which time the core microbiome is obtained not so much from trophallaxis, but rather from beebread and the “fecal oral route” via grooming and contact with comb [[4]].
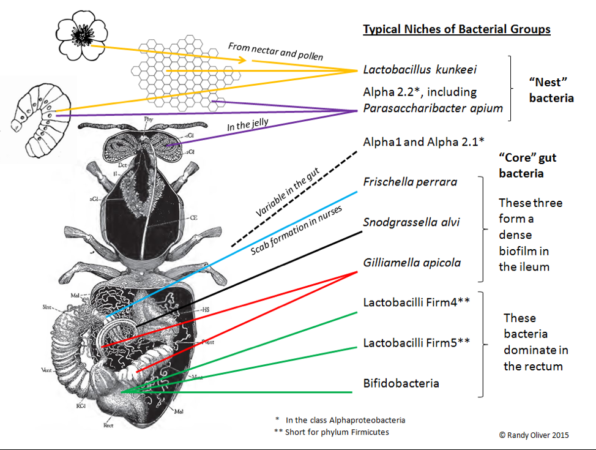
Fig. 1. The core gut bacteria of the honey bee.
Practical questions: Since worker bees easily obtain their core gut bacteria from the combs, why would they need to be fed a probiotic product? Would it make any difference?
This field trial was designed to determine whether monthly feeding of either of two commercial probiotic formulations specifically marketed for honey bees would provide a benefit to colony strength (as measured by cluster size) or performance (as measured by weight gain).
I like to use the above two simple metrics for two reasons:
- Both reflect the final calculus of every aspect of colony health and adult survival, and
- They are the only two metrics that put money in the beekeeper’s pocket.
I ran two simple trials, coupling field measurements with high-tech molecular biology (“next-gen” sequencing), to first see whether either probiotic affected either colony strength or weight gain, and then (to be published later) to learn whether the feeding of the probiotics resulted in any other biological benefits.
Hypotheses to test
Scientifically, the trials were designed to test the following hypotheses:
- Whether feeding a commercial honey bee probiotic over time will result in better colony performance, as measured by cluster size or weight gain.
- Whether one of the two tested probiotics shows greater improvement in colony performance than the other.
- If so, whether such treatment is cost effective (the probiotics aren’t cheap).
- Whether any of the bacterial strains in the probiotics actually establish in the gut.
- Whether feeding of probiotic affects virus, yeast, or nosema prevalence or intensity.
- Whether the gut microbiome is affected by the application of oxalic acid as a varroa treatment.
- Whether feeding of probiotic affects gene expression.
- Whether a probiotic improves reestablishment of the core gut microbiome after treatment with antibiotics.
Yes, quite a list, but we’ll see what we can tease out of the trials.
Experimental design
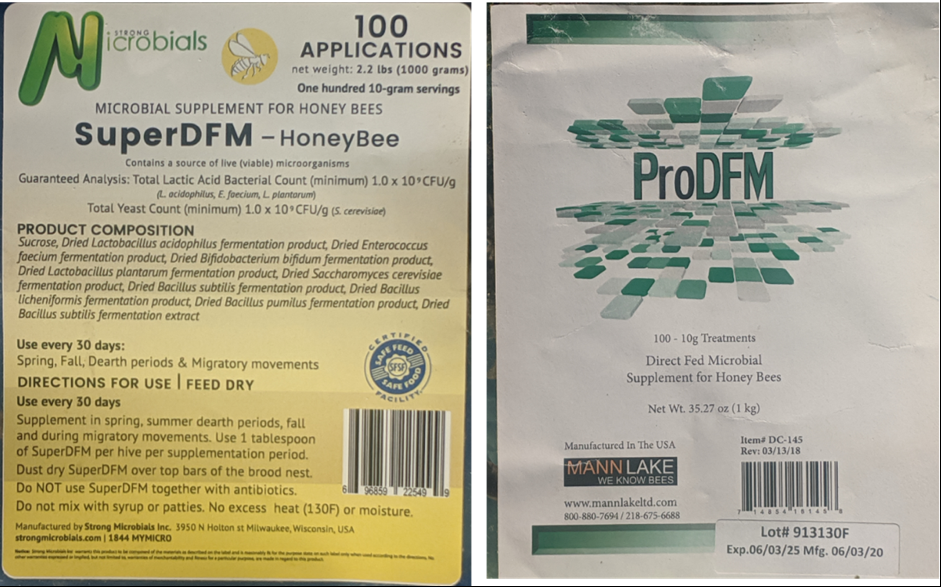
The trial was set up to determine whether there were measureable effects upon colony performance resulting from monthly feedings of either of two commercial probiotics — SuperDFM (Strong Microbials ) or Pro DFM (Mann Lake) (Figure 2)— compared to feeding a sham control of powdered sugar.
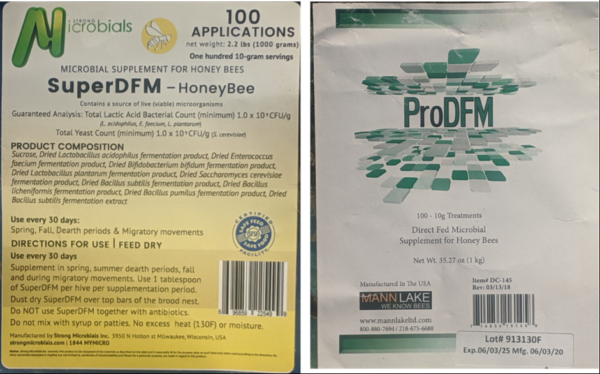
Fig. 2. The two probiotics tested. Will field data support the claims made by the manufacturers?
Methods
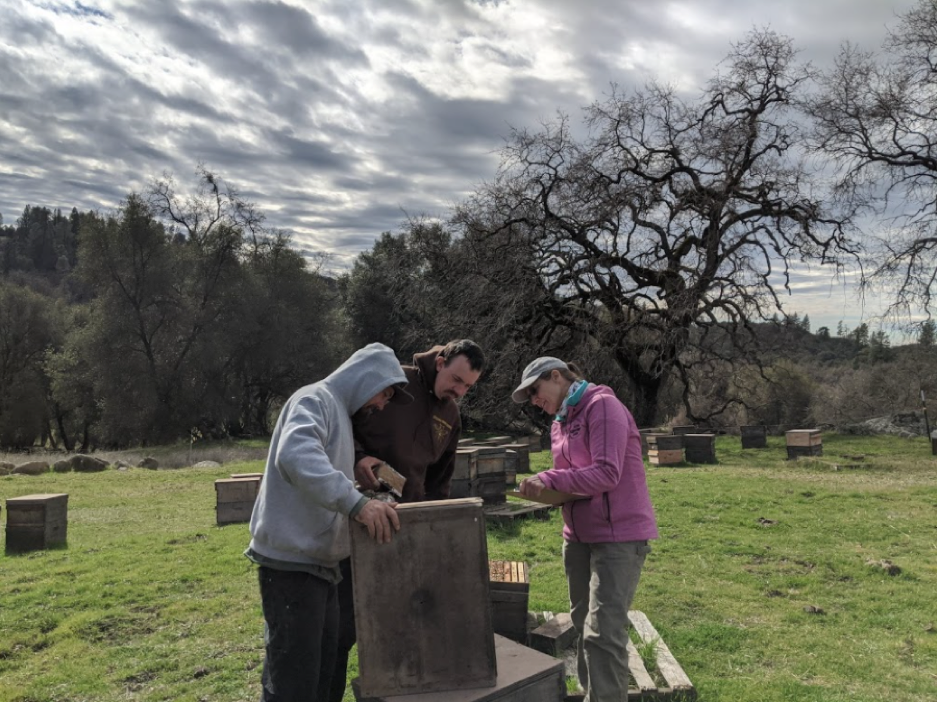
We ran the trial in two apiaries (one sunny, one shady; Figures 3 & 4) in the Sierra foothills at approximately 2900-foot elevation. We’d established the yards in April as nucs with queen cells, mating the queens in the yards, each apiary established with cells from different queen mothers. In late June, as the honey flow was winding down, we selected only healthy hives with good brood patterns for the trial, and roughly equalized them for strength (to a median 8.5-frame cluster size) by swapping combs (due to a miserable spring, most colonies in our operation were still weak in June). We treated all hives with formic acid prior to starting the trial, and checked each colony for queenrightness afterwards (taking a replacement queen from the few extra colonies in each yard if necessary).
We then consecutively numbered the hives, and randomly assigned one of three treatments to one hive in each numerical block of three hives. We blinded ourselves as to which treatment was which by asking a visiting researcher to pour the probiotics (or powdered sugar control) into mason jars, labeling them A, B, or C.
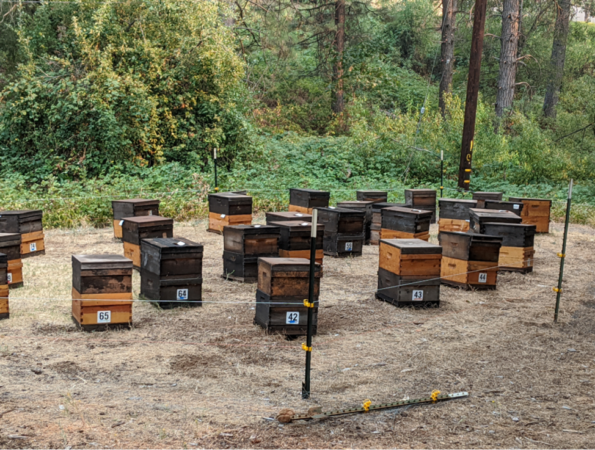
Fig. 3. The sunny yard. To eliminate any possibility of bias, we blinded ourselves as to which treatment was which.
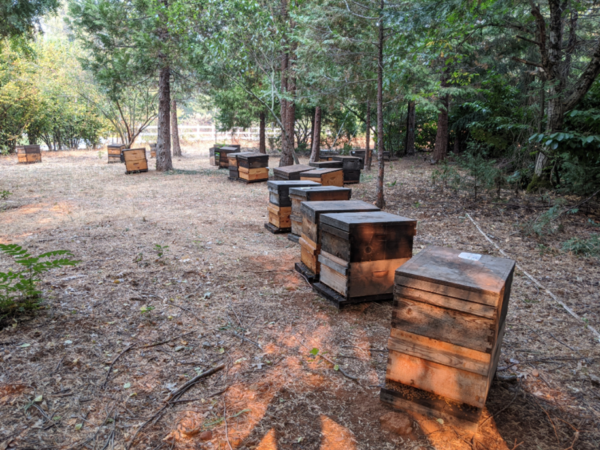
Figure 4. The shady (and cooler) yard. This yard receives a flow of cedar honeydew in late summer. We expected the colonies to grow in strength during the trial, but most didn’t, apparently due to drought and hot weather.
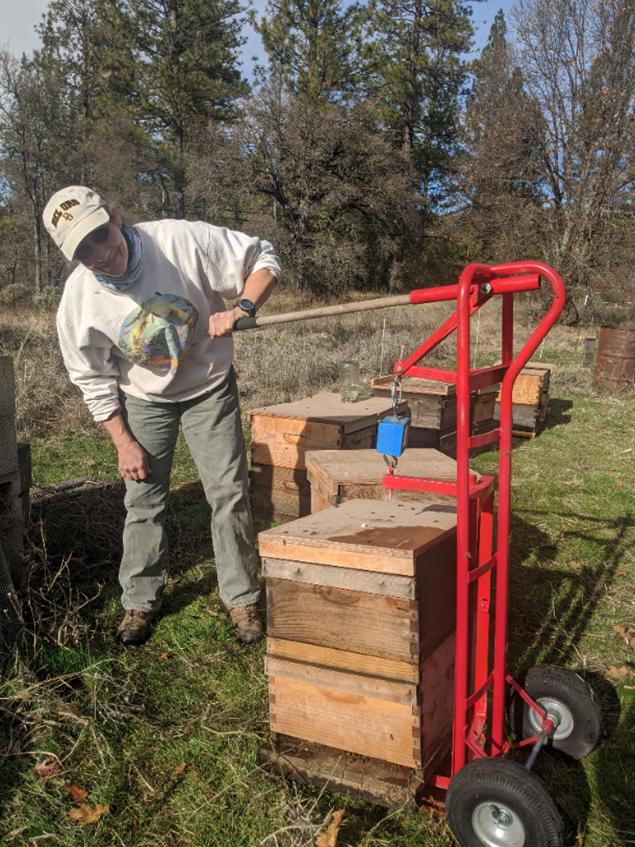
At the start point on July 2, we graded for pretreatment cluster strengths (Figure 5) and hive weights (Figure 6).
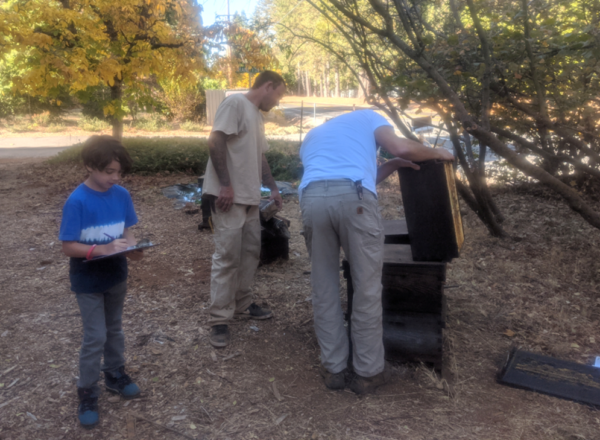
Fig. 5. We perform grading for strength early in the morning (or on cool days) before the clusters have broken, looking between the frames of each box from both top and bottom. My grandson Ryder was schooling online due to covid, and proved himself to be a first-rate recording field technician throughout the trial, making sure that all data was correctly entered, and that every hive received the correct feeding.

Fig. 6. Another technician who helped me greatly was beekeeper Alice Dunbar, here showing the custom hand truck that I welded together for quick and accurate weighing. The blue digital crane scale weighed each hive to the tenth of a pound.
We also took samples of ~50 bees from a brood comb from every colony and immediately froze them on dry ice (Figure 7) for next-gen sequencing of the gut microbiota to be performed by our collaborator — the Anderson Lab at the USDA Carl Hayden Bee Lab.
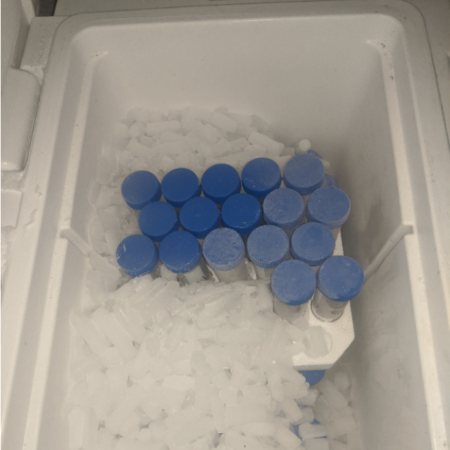
Fig. 7. We placed samples of ~50 bees into plastic tubes, immediately packed them in dry ice, and then shipped them overnight (at great cost) to the USDA lab for later analysis.
Once initial grading and sampling was completed, we dry-fed the probiotic treatments at the manufacturer-recommended rate of one tablespoon per month, sprinkled over the top bars of the lower brood chamber the first week of each month (four applications in all) (Figure 8).
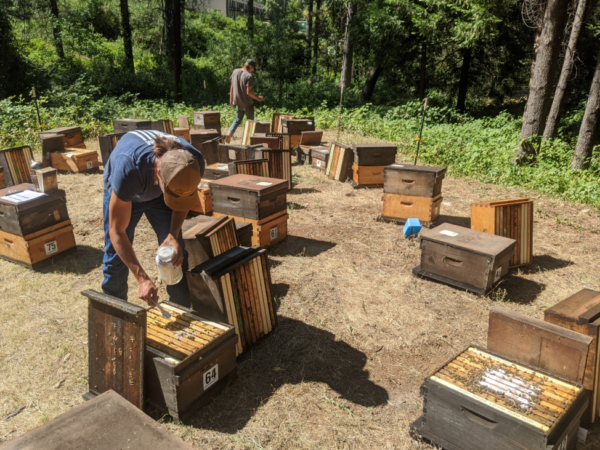
Fig. 8. The first feeding. All colonies had been set up as singles, above which they received a box with 6 empty drawn combs and two combs of foundation. They were set up this way so that there was enough room for them to store any late honey plus sugar syrup, without needing a third box. We color coded the hives and probiotic jars to avoid misapplication of the white powders.
The trial intentionally spanned the stressful summer dearth period, so the colonies were supplementally and equally fed an artificial diet of pollen subs (Healthy Bee, followed by Mann Lake Bulk Soft) and 1:1 sugar syrup in addition to the minor natural pollen flows over the next four months. By the end of the trial, the colonies had largely filled the upper brood chambers with honey, honeydew, and sugar syrup “honey.” Throughout the trial, we monitored varroa infestation rates, and used extended-release oxalic acid to keep mite counts below the 1% level.
We repeated the grading, weighing, and sampling for endpoint results on November 4 & 5, as the bees were ramping down broodrearing prior to winter.
Results
Rather than bury you in means and statistics, I’ll show the actual raw data for each group of hives below (Figures 9 – 14). Unfortunately, the results were a bit disappointing.
Change in Colony Strength
Due to unusually hot and dry weather, most colonies did not increase in cluster size, although part of that was due to grading them during much cooler weather in November. Of interest is that there was scant correlation between starting and ending strengths — indeed, the stronger the colony at the start, the more they tended to shrink by November (Figure 9).
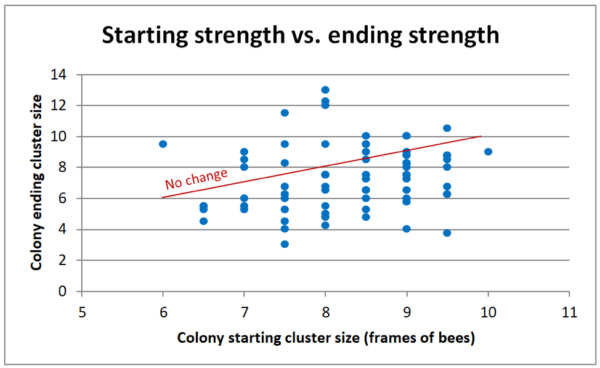
Fig. 9. I added a “no change” line to help to see that the stronger the starting strength, the more likely a colony shrunk in size by November (compare the number of data points above or below the line). I have no idea why, but we observed the same thing in another field trial that I ran in other yards at the same time.
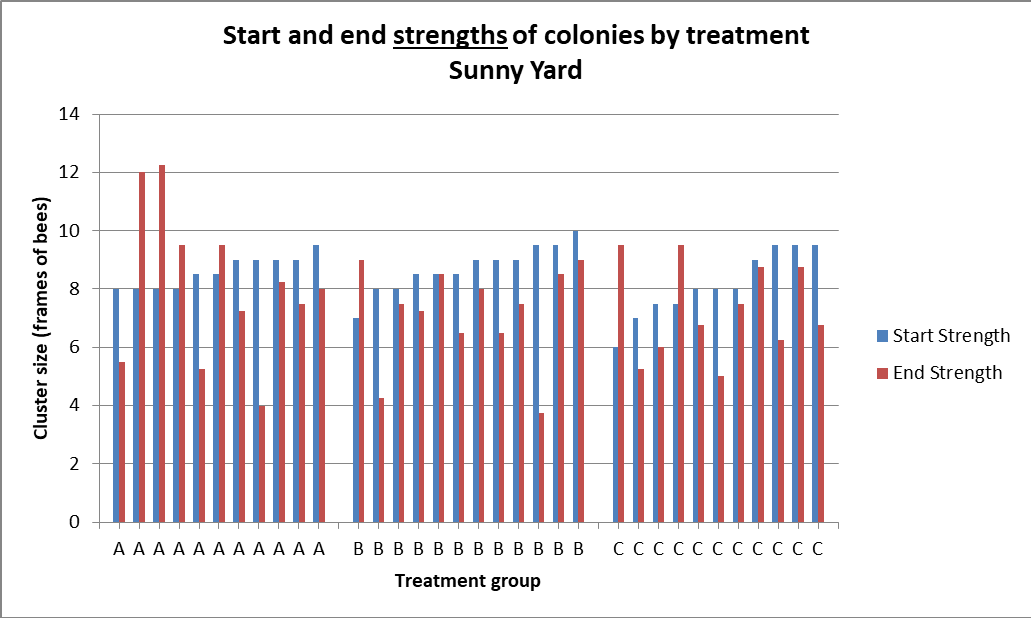
But our question is, did the feeding of a probiotic lead to larger cluster sizes (indicating healthier colonies) going into winter? I’ll let you decide for yourselves from the graphs below. Here’s the raw data of absolute change in strength for each colony (Fig. 10a).
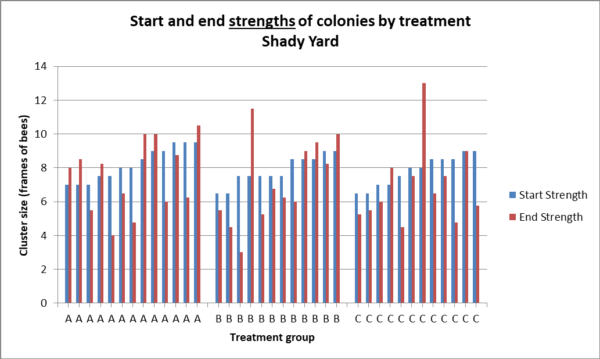
Fig. 10a. Starting strengths of each colony are in blue, ending strengths in red, hives sorted by starting strength. Compare the differences, by group, in the heights between the tops of each pair of columns, which indicates the change in strength. There was no statistical difference between treatment groups in change in colony strength in the shady yard (Kruskal – Wallace p = 0.89), or absolute strength (p = 0.67).
Since the colonies started at different strengths, the best way to compare changes might be to compare the distributions of relative changes in strength by dividing the ending strength by the starting strength (Fig. 10b).
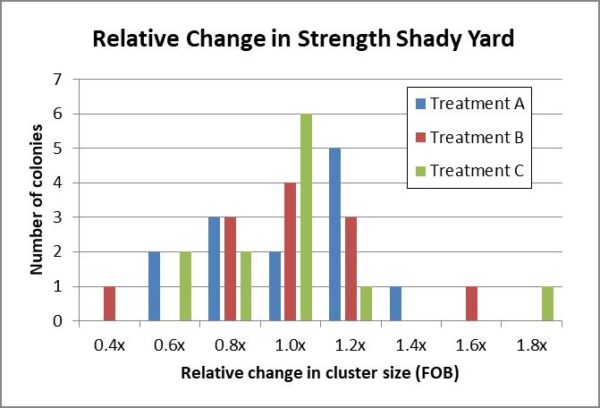
Added: Figure 10b. Histograms of the distributions of relative changes in strength by the colonies for all three test groups in the shady yard appeared to fall into similar normal curves.
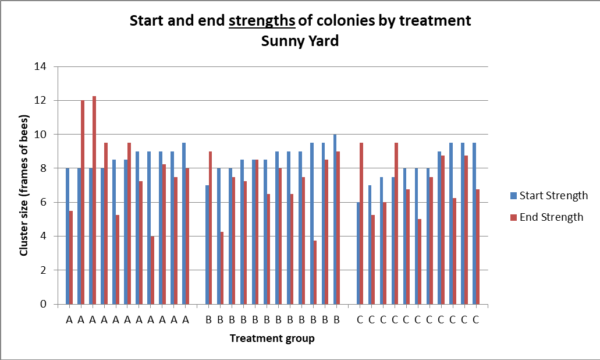
Fig. 11a. There was no statistical difference between treatment groups in change in colony strength in the sunny yard (Kruskal – Wallace p = 0.88) nor absolute strength (p = 0.66).
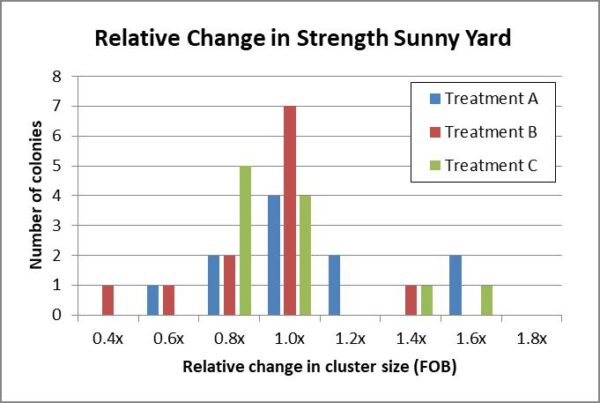
Added: Figure 11b. Historgrams of the relative changes in strength by the colonies in all three test groups in the sunny yard also appeared to fall into similar normal curves.
Practical application: The data from this trial unfortunately do not support the claim that the feeding of either of the probiotics resulted in stronger colonies.
Change in colony weight
Between the natural nectar and honeydew flows, plus some supplement feeding of equally-fed sugar syrup, every colony put on weight, with a median gain of nearly 27 lbs. Not surprisingly, the colonies with the largest ending strengths tended to put up more stores (Figure 12). But did the feeding of a probiotic increase weight gain?
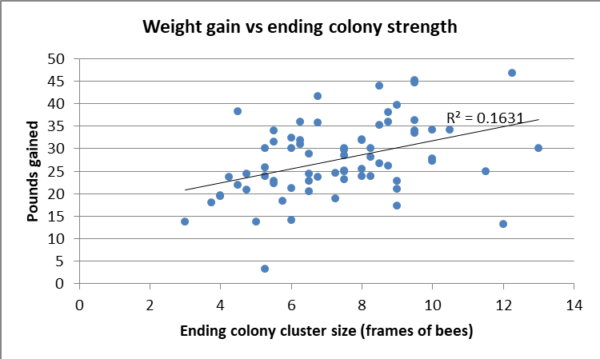
Fig. 12. The colonies that were stronger at the end point tended to have put on more weight, but the correlation was slight.
But did the feeding of either of the probiotics result in greater weight gain? Again, see for yourself.
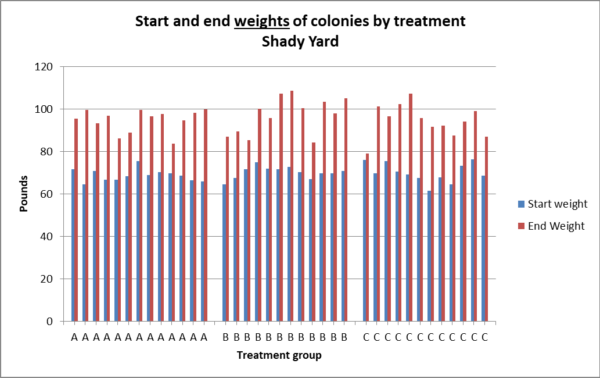
Fig. 13a. There was no statistical difference between treatment groups in weight gain in the shady yard (p = 0.73).
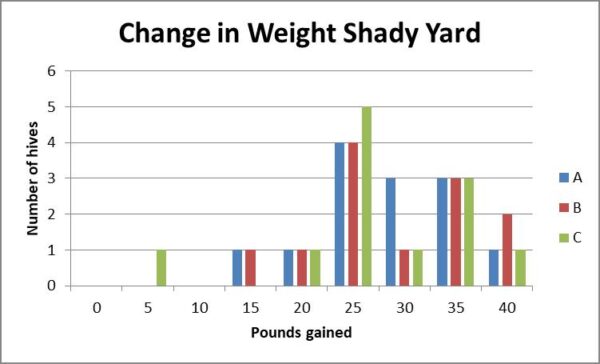
Fig. 13b. The number of pounds gained by hives in the shady yard appear to exhibit similar normal distributions.
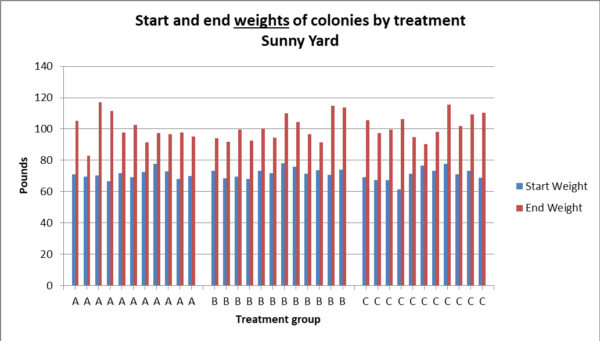
Fig. 14a. There was no statistical difference between treatment groups in weight gain in the sunny yard (Kruskal – Wallace p = 0.35).
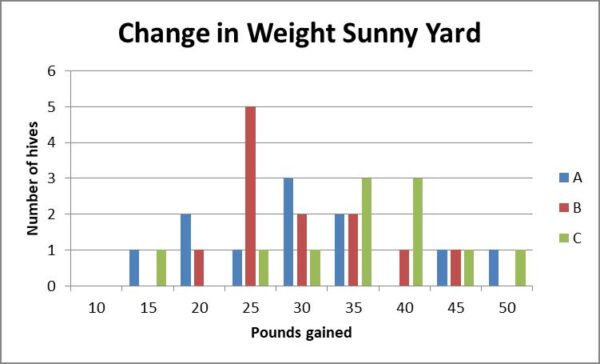
Fig. 14b. The distributions of weight gain by hives in the sunny yard, although not significantly different, suggest that Treatment C may have resulted in somewhat more weight gain in this yard.
Practical application: The data from this trial unfortunately do not support the claim that the feeding of either of the probiotics resulted in stronger colonies.
Discussion
The data collected unfortunately does not support the claim that monthly feeding of either tested probiotic resulted in a measureable benefit in either colony strength or weight gain, compared to the monthly application of the powdered sugar control.
That said, there is still the possibility that the probiotics caused other effects (beneficial or not), upon the gut microbiomes. Below are the remaining questions to be answered by my collaborator — the USDA-ARS Anderson Lab.
- Do any of the applied bacterial strains establish in the bee guts?
- Does feeding of either probiotic affect the microbial community structure of the gut?
- Does feeding of either probiotic affect pathogens?
- Does feeding a probiotic help to restore the gut microbiome after treatment of the hive with the antibiotics oxytetracycline or tylosin?
In order to answer the last question, at the end of the trial, I subdivided each of the treatment groups into three, and applied an antibiotic to two of them, then reapplied probiotics, and took bee samples at three time points to track the recovery of the gut microbiomes. I will publish the results once the samples are analyzed.
Funding
This research (by a beekeeper, for the benefit of beekeepers) was funded by donations from individual beekeepers and beekeeping associations. Feel free to contribute at http://scientificbeekeeping.com/
citations
[1] Raymann,K,et al (2017) Antibiotic exposure perturbs the gut microbiota and elevates mortality in honeybees. PloS 470 Biol 15:e2001861.
[2] https://en.wikipedia.org/wiki/Probiotic
[3] Martinson, VG, J Moy, N Moran (2012) Establishment of characteristic gut bacteria during development of the honeybee worker. Appl. Environ. Microbiol. 78: 2830 –2840.
[4] Powell, JE, et al (2014) Routes of acquisition of the gut microbiota of the honey bee Apis mellifera. Appl. Environ. Microbiol. 80: 7378–7387.
Beekeeper-funded Research
A Test of Thermal Treatment for Varroa
Part 2
First published in ABJ April 2021
Randy Oliver
ScientificBeekeeping.com
Last month I covered the theory of using thermal treatment (hyperthermia) to control varroa, and some of the designs of devices on the market. I’d like to now answer some questions regarding thermal treatment. I also asked users for reports on their observations, and tested thermal treatment myself on four hives.
Effects of Heating upon the Workers
Allow me to quote from the manufacturers of the Thermosolar Hive [[1]].
Q: Can the thermotherapy harm the colony?
A: No. The upper limit for thermotherapy is 47°C (116.6°F). The temperature might rise maximally by 1 – 2°C (1.8 – 3.6°F) for a few minutes after the roof is put back…The adult bees have the chance to move to the bottom box, bottom board or to leave the hive. Relative humidity of the air decreases during the heating; the bees tolerate the dry air easily. The house bees withstand the higher temperatures easily as well, they remain on the heated brood during the whole therapy… The brood remains intact, healthy bees do hatch even at 50°C (122°F). It is not recommended to exceed the healing temperatures (40 – 47°C, 104 – 116.6°F), nor the duration of the treatment (2,5 hours).
Now compare the above answer to the hard data from a recent study (Figure 1).
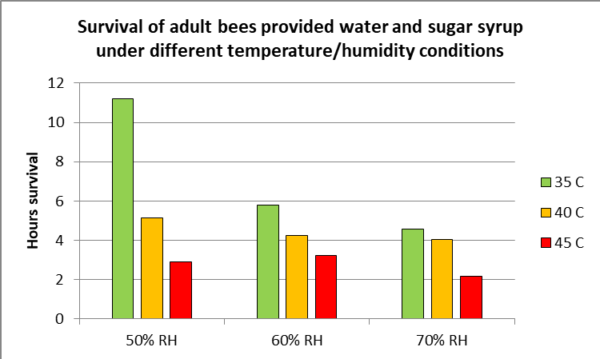
Fig. 1. Note how dramatically the survivorship of adult bees drops as the temperature rises from 35 C to 45 C (95F – 113 F). These results indicate the effect of humidity of adult bee survival at elevated temperatures. This may be how the bees survive in hyperthermia devices that don’t add humidity — by evaporating water from their mouthparts. Data from Li (2019)[[2]].
The above graph is for exposures of hours. With any thermal device, the heat must be applied gently and evenly, since Kovak [[3]] found that even 5 minutes exposure to 51.7 C (125 F) caused immediate or delayed death of 50% of Italian bees, and that Carniolan bees were even more sensitive.
Practical application: Some races of honey bees are more heat tolerant than others. If you keep “Carnies,” be aware that they don’t handle heat as well as do Italians. And make sure that your thermal device doesn’t create any “hot spots” in the hive.
Neither I, nor other beekeepers I’ve spoken with, notice many dead adult bees after thermal treatment. But that doesn’t mean that there’s no adult mortality, since as a general rule, adult workers that are stressed fly out of the hive to die elsewhere. Free [[4]] found that exposure of caged workers to a temperature of only 40°C (104°F) for 1 hour resulted in some of them dying within the next 24 hours. In any case, the benefit from reducing the mite infestation appears to outweigh the adverse effects upon the colony, and the beekeepers I’ve spoken with generally say that their colonies perform well after thermal treatment.
Effect upon the Brood
The honey bee colony carefully regulates the temperature its brood within a very narrow range. It is reasonable to suspect that heating the brood to a higher temperature my cause “adverse effects” upon the larvae or pupae, either immediately, or later in their lives. There have been a number of studies on this subject, well reviewed by Kablau [[5]], suggesting that we may have more to learn.
As I mentioned in the first part of this series, Kablau found that to effectively kill the mites in the brood, you needed to apply a temperature that also kills drone brood. It’s up to the beekeeper to weigh the tradeoff.
In the hives that I’ve thermal treated (at 41 C), I did notice a few dead older larvae, presumably killed by the heat, but not enough to be concerned about — unless there is a delayed effect upon them once they emerge as adults. I didn’t check for survivorship of eggs or very young larvae, which may suffer not only from heat, but from desiccation.
Effect upon the Drones and Queens
Another concern is the effect upon the queen, since it’s been found that even brief exposure to 40°C (104°F) can cause substantial degradation of sperm viability [[6], [7]]. And it appears that drones are more sensitive to heat than are workers [[8]].
Practical application: We’re learning more and more about how temperature extremes can affect sperm viability, whether in the drone’s testes, or the spermatheca of the recipient queen. I suspect that queen producers may wish to steer clear of thermal treatment.
Beekeeper Doug Severt from Montana, who has used thermal treatment on several hives over the course of three years, reports that he’s noticed some queens failing after thermal treatment, as did I in my tests. Other users tell me that they don’t notice this.
Practical application: Without performing a field trial with marked queens in test and control colonies, it can’t be determined whether thermal treatment actually causes queen failure. And even if it does, as with queen “issues” due to formic acid treatment, colonies may simply rear replacement queens.
Effect upon Small Hive Beetle
A number of beekeepers report that thermal treatment kills Small Hive Beetles (SHB). SHB prefers cooler parts of the hive, and has reduced longevity at broodnest temperature [[9]]. I haven’t been able to find any studies testing the effect of short-term thermal treatment upon SHB.
Does Thermal Treatment Sterilize the Mites?
One manufacturer claims that “Should any of Varroa mites survive, they are so damaged that they can no longer reproduce. “ If this is indeed true, then we shouldn’t see any rebound in the mite population after thermal treatment. We’ll take a look at field data further down to see if this is true.
How about the “Phoretic” Mites on the Adult Bees?
Several beekeepers report that high numbers of mites fall to the bottom of the hive during thermal treatment, but as I pointed out last month, they may still be alive. This would be one advantage to a bottom-plate thermal device, since any fallen mites would perish on the hot plate. But how about the mites on the bees that beard on the front of the hive when using thermal devices that allow them to do so? Lynn Williams used carpenter’s chalk dust to mark the bearded bees, and observed bees moving not only out of the hive, but also back in. Further down I’ll show the change in the mite infestation rate of the adult bees 24 hours after thermal treatment.
Reports from U.S. Beekeepers
I put out the word that I wished to hear from beekeepers who not only have tried thermal treatment, but had also collected some data on its efficacy. Adding the condition that the person had made the effort to collect data helps to sort those with scientific interest from “true believers,” and I enjoyed objective discussions with the beekeepers below. They had all used the popular Mighty Mite device (which has a Facebook page [[10]]). The Mighty Mite is a bottom-inserted, thermostatically-controlled, open-entrance unit, so the data below only reflect the results for this specific device, which holds a temperature of approximately 41 C (106 F) for 2.5 hours.
Mike Immer
Mike [[11]] is a beekeeper from Missouri, who has customers who wanted nucs that had not received any chemical treatments. So he tested thermal treatment on 30 hives in an isolated experimental yard, and graphed his results (Figure 2).
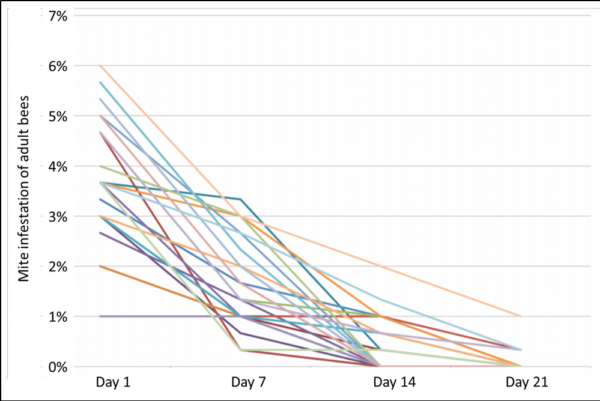
Fig. 2. Mike Immer’s alcohol wash counts prior to, and following, thermal treatment of 30 hives with the Mighty Mite during the summer. These results were impressive! Mike also reported a substantial reduction in SHB counts.
Mike also related to me that he tested the device again the next year on four hives in a different yard, and that the results were not quite as impressive. You can read more about Mike’s experience with thermal treatment here [[12]].
Stickyboard Counts
Mike took alcohol wash counts from samples of adult bees. Such counts accurately reflect the infestation rate of the workers, which shows strong biological relevance with regard to the degree of viral infection of the bees [[13]]. That said, the next two data sets, instead of being mite wash counts, are of 24-hour stickyboard counts of natural mite fall.
Although stickyboard counts are used by many beekeepers for mite monitoring, they are more difficult to interpret, since they exhibit far more day-to-day variation than do mite washes [[14]], and must be interpreted relative to colony size and amount of brood present. Unlike mite wash counts, for which there is plenty of data that shows that once the infestation rate exceeds 5% (~15 mites per half cup of bees) that colony performance and survivability begins to seriously suffer, extension agents can only give ballpark figures as to seasonal “economic damage thresholds” based upon stickyboard counts. My Google search found a treatment threshold of 50 mites per day late in the season to be a common recommendation. That figure astounds me, since at the normal rate of natural attrition of varroa of about 1% of the varroa population per day [[15]], a drop count of 50 would indicate an in-hive population of 5,000 mites — 5x higher than the 1000-mite maximum recommended in Europe. A more realistic treatment threshold is suggested by Dr. Yves Le Conte [[16]]:
Today, German beekeepers are required to start treatment if the natural mite drop exceeds 10 mites per day, a level that indicates the colony is close to collapse.
There is unfortunately no straightforward conversion between the two monitoring methods, and natural mite fall may greatly underestimate the actual infestation rate of the colony (Figure 3).
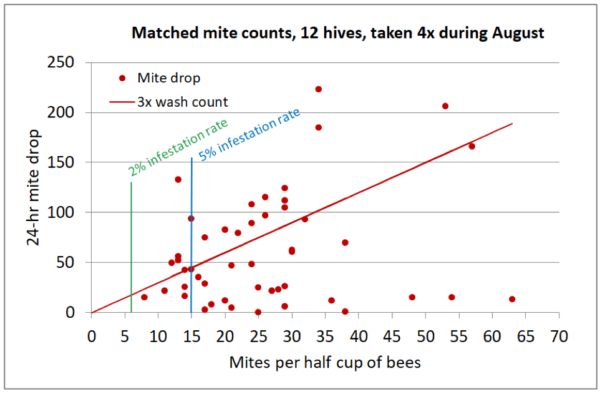
Fig. 3. A plot of data that I collected a few years ago, from 12 double-deep hives, averaging 13 frames of bees, during August. Although there is only a very rough correlation between infestation rates and mite drops, I eyeballed a regression line of 3x the alcohol wash count, ignoring the few outlier hives that exhibited unexpectedly low mite drops. Note that stickyboard counts can greatly underestimate the infestation rate of the adult bees in the hive.
In the above graph I inserted two mite wash infestation rates —the 2% rate is the treatment threshold that we use in our operation; above 5%, colony performance and winter survival start to drop off. Note that my graph above exactly matches the German recommendation of 10 mites dropping per day for a treatment threshold at the 2% infestation rate, and that 50 mites dropping per day would indicate an infestation rate of above 5%.
Practical application: I’m surprised to see Extension webpages suggesting that a late-season 24-hr stickyboard count of 50 mites would be acceptable. I’d treat by the time 10 mites start dropping per day.
With the above information in mind, let’s see what we can learn from some stickyboard counts.
Carl Chesick
Carl heads the citizen science Center for Honey Bee Research in South Carolina. As opposed to Mike, who took mite wash counts of the adult bees, Carl’s group recorded stickyboard counts of mite fall. Below are representative graphs from four of the ten that he sent me, all having been given a Mighty Mite thermal treatment on September 5 (Figure 4).
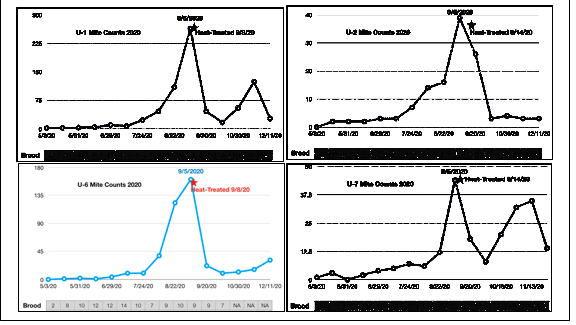
Fig. 4. Stickyboard counts (24-hr) from representative hives given thermal treatment (note that the y-axes are of different scales). I picked hives that contained a substantial amount of brood at time of treatment, in order to see whether there was much mite recovery post treatment.
Practical application: Thermal treatment in early September definitely caused major reductions in natural mite fall, and was able to at least temporarily reduce the daily count to 10 or less in six of the ten treated hives. But also in six of the ten hives, the mite drop counts were back at dangerous levels by November, indicating that a thermal treatment in early September might not prevent virus issues in the population of “winter bees.”
Kay
Beekeeper Kay Crawford in Washington kept track of the effect of thermal treatments by a Mighty Mite device in two Slovenian AŽ hives (hives kept in a shed, with the frames pulling out horizontally). Her data were also of natural drop on a stickyboard, but Kay went a bit further, and counted immature mites separately from dark mature mites, and took counts more frequently (Figure 5).
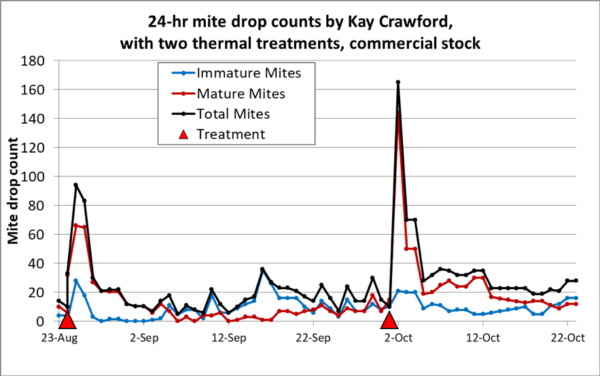
Fig. 5. Mite drop counts for a colony headed by a commercial queen. Each treatment clearly caused a spike in mite fall, especially of mature mites (note the shift in the red plot compared to the blue plot). But this data set indicates that thermal treatment didn’t cause much of a change in mite drop counts from the baseline values prior to treatment. Nor did it reduce the mite drop to a level that would indicate good mite control.
Having done a fair number of stickyboard counts myself, I was surprised by the number of immature mites that Kay counted. So I checked with Dr. Lilia De Guzman, who during her tenure at USDA, has perhaps counted (and dissected) as many varroa mites as any human being. I’ve always been impressed by Dr. De Guzman’s meticulous research, and reviewed a study in which she had recorded the proportions of older, younger, and nymphal mites. From colonies engaged in broodrearing, she recorded that 42% of fallen mites fell into the young or nymph class. So Kay’s counts are not surprising. However, of considerable interest, we can use her counts to see how thermal treatment affected the “phoretic” mites compared to those emerging immature from the brood.
Kay also treated a hive headed by a “survivor stock” queen (Figure 6).
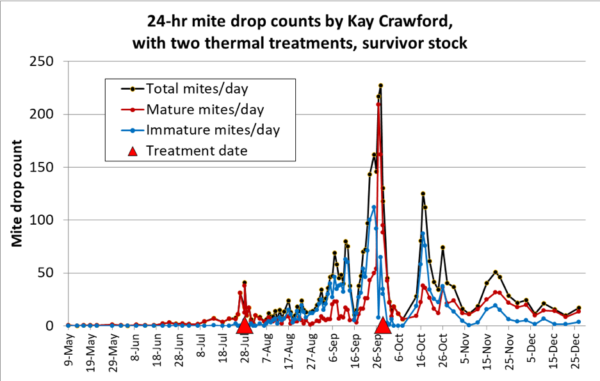
Fig. 6. Daily mite drop counts (some averaged from multi-day counts) of a “survivor stock” colony over a season, punctuated by two thermal treatments. Again, note that hyperthermia appeared to cause elevated mortality of mature “phoretic” mites for a period of time post treatment. By mid-October, the mites appear to have resumed another round of vigorous reproduction, tapering off in December.
Practical application: So just how efficacious were the thermal treatments, as far as reducing the mite population? I used my varroa model [[17]] to see if I could come up with a rough estimate, based upon Kay’s mite drop data, to estimate the efficacy of the treatments in the graphs above. It suggests that each treatment killed around 40-50% of the mites in the hive. The model also indicates that 40-50% would have been the proportion of “phoretic” mites in the colony at that time, supporting the explanation that the treatment mainly hit the mites on the adult bees. The relatively rapid rebound of the mite populations after treatment is further evidence suggesting that a healthy population of mites remained in the colony post treatment.
My own Preliminary Investigation of a Thermal Treatment
At the request of beekeeper Bill Hurd, who sent me a thermal unit to test, I did some quick and dirty preliminary investigations of thermal treatment.
Disclaimer: I did not run an actual scientific experiment to test efficacy of thermal treatment, but rather performed only a preliminary investigation on:
- Using the method in the field,
- Confirmation of temperature penetration of the combs,
- To determine the impact of treatment upon the course of mite infestation rate of the adult bees following treatment,
- To determine the short-term mortality of mites in the brood following treatment.
For the investigation, I used a thermostatically-controlled and timed heating plate installed on the bottom board, with temperature monitored by a thermistor set on a central top bar of the lower brood chamber. After some practice rounds, I treated four moderate-strength hives, all double-deep with ample brood, exhibiting relatively high mite counts. I performed the treatments July and August, during daytime, with ambient temperatures ranging from 85 to 105 F (Figures 7-9).
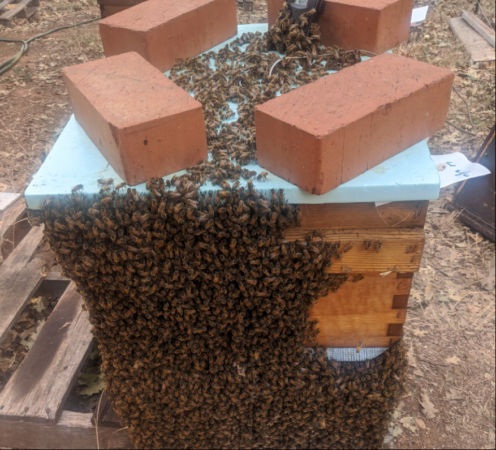
Fig. 7. I taped any cracks between the brood chambers, and weighted a piece of insulation board tight against the propolis at the top of the hives. Many of the adult bees chose to move out of the hive as it warmed up.
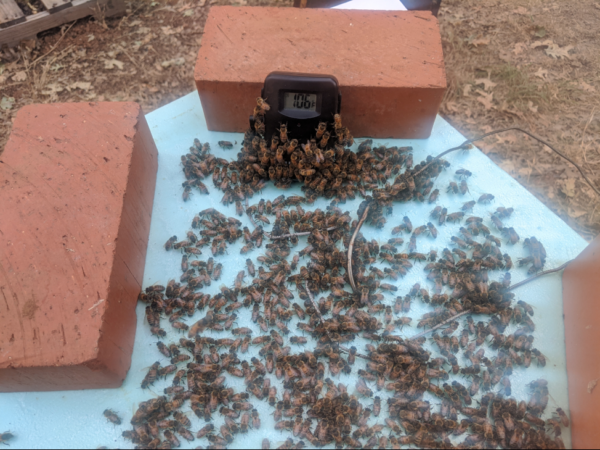
Fig. 8. I used a separate thermistor from that of the heating unit to monitor the temperature between the combs of the upper box. Although I used the same device and setup for each hive, in one run the temperature of the upper box only reached 101 F, perhaps due to the ambient temperature being only 86 F.

Fig. 9. I also inserted a thermistor beneath sealed brood, against the midrib of a comb in the middle of the upper box, in order confirm that the heat penetrated to the bottoms of the cells (it did).
Dissection of the Brood after Treatment
In researching thermal treatment, at the Varroa Controller website I’d found an interesting observation. Dr. Stefan Berg [[18]] writes (roughly translated from German):
If you heat the brood combs to 41 C for two hours, the young daughter mites and the males are killed, but the mother mites survive this quite well. After the treatment we plucked brood, only ten percent of the mother mites were damaged. At three hours and 42 C almost all of the mites were dead.
Since in my test, I’d heated to 41 C for 2½ hours, I was curious as to how what percentage of the mature female mites under the cappings survived the sauna experience (Figures 10-11, Table 1).

Fig. 10. It was easy to determine whether the mature (dark colored) female mites had been killed or not by their unmistakable rapid movement, or lack thereof. In some of the drone cells that I dissected, there were as many as five mature mites. I couldn’t find mites in worker cells in one of the hives. I dissected both solid patches of cells, as well as cells next to empty cells (which would allow better heat penetration), and didn’t notice any difference in mite mortality.

Fig. 11. I pulled brood frames from the upper box, 24 or 48 hours after thermal treatment, and dissected out 5th-instar larvae and pupae of various ages. This photo shows drone brood that I pulled from the patch of cells above the plate. You can’t tell from the photo, but to my surprise, most all the mites were actively walking about.
A summary of my dissection data is shown in Table 1.
| Table 1. I recorded the counts of live or dead mites from combs from three of the test hives. In only one row of drone cells was the number of dead mites greater than the number of live ones. Of the 153 mites that I pulled out, only 29% of them were dead. |
|
| MITE SURVIVORSHIP POST TREATMENT |
|
| All inspected cells from a central frame in the upper brood chamber. |
|
|
| Hive (temperature held) Time of dissection |
Drone |
Worker |
|
| Live |
Dead |
Live |
Dead |
|
| T1 (106-107 F) 24 hr |
2 |
16* |
22 |
2 |
|
| T2 (107 F) 24 hr |
34 |
3 |
0 |
0 |
|
| T2 (107 F) 48 hr |
12 |
4 |
n/a |
n/a |
|
| T3 (101 F) 24 hr |
40 |
8** |
9 |
1 |
|
| * These drone cells were along the bottom bar of the upper brood chamber.
**In this run, the upper box temperature did not exceed 101 F. |
|
|
Practical application: My observations support those of Dr. Berg. A 2.5-hour treatment at 106 F is not adequate to obtain a high rate of kill of the mature mites in the brood, even at 48 hours after treatment.
This leaves the question as to the reproductive capacity of the surviving mites post treatment. If they are all sterilized, we wouldn’t expect the mite population to rebound. The mite fall data reported above suggests that the surviving mites are indeed able to reproduce. So let’s take a look at my alcohol wash counts.
The Effect of Treatment upon the Mite Infestation Rate of Adult Bees
I performed mite wash counts for each hive before treatment, at 24 hours post treatment, and then at Days 15 and 31. In addition, for the first treated hive, I took an additional count at Day 42. I took the bee samples from the same marked frame (immediately adjacent to brood) each time in each hive in order ensure consistency [[19]] (Figure 13).
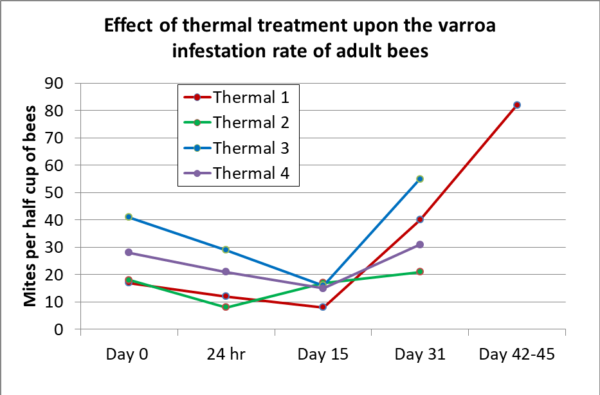
Fig. 13. In no case did my results match those of Mike Immer. Surprisingly, the average reduction in infestation rate of the adult bees at 24 hours post treatment was only 35%, and by Day 15 only 41%. And then the mite counts shot right back up, indicating that the reproductive ability of the surviving mites was not hampered to any great extent. Note that the upper-box of Thermal 3 held at only 101 F (38 C), but surprisingly showed the greatest reduction in mite count. Also of interest is that its mites didn’t recover any faster than in Thermal 1, which held at 107 F (41.7 C).
My modeling these results suggests that the overall kill rate of the total mite population in the hive ranged from around 40% to 55%.
Practical application: I applied a 106 F for 2.5 hours thermal treatment regimen to three of these hives, under ideal conditions (hot weather), confirming both the temperature held, and duration of, the treatment, as well as the penetration of the heat to the midrib of the brood combs in the upper box. My results are in agreement with the “thermal death time” curves in Fig. 4 of my previous article — that this regimen would be very well-tolerated by the bees and brood, but unfortunately fairly well-tolerated by adult mites also. So yes, it indeed killed a proportion of the mites, but only enough to set their buildup back by a month to a month and a half.
Discussion
The honey bee colony maintains its broodnest within a consistent and very narrow range of temperature and humidity. For successful thermal treatment — meaning that you’d kill most of the mites, with minimal damage to the colony as a whole — we’re dealing with a very narrow range of temperature and time. Too low a temperature, or too short a time, and mite control will be inadequate. But only a few degrees higher, or an hour longer, and the brood can be damaged, and the queen and drones could potentially be largely sterilized. And even then, the adult bees that move outside to escape the heat take their hitchhiking mites with them, and may then carry them back in when it’s safe. Since half the mites are typically on the adult bees, this is an entrenched limitation to thermal treatment, unless coupled with a different treatment to kill those mites.
Practical application: Hyperthermia of hives has the potential to greatly reduce mite levels, but the trick will be for the device and treatment regimen to hone in on the “sweet spot” of time and temperature that will kill most of the mites, with the least damage to the bees.
FWIW, hyperthermia is far more time-consuming and labor-intensive than cracking open a hive and tossing in a treatment. All devices require a power source — the grid, generator, battery, or solar. Thermal treatment could be used by the small-scale beekeeper who is adamantly against using any “substance” for mite control, but it’s hard for me to imagine it being cost effective for beekeepers with many hives.
Acknowledgements
Thanks to Bill Hurd, Lynn Williams, Mike Immer, Carl Chesick, Amy Musante, Kay Crawford, Darwyn Flynn, Doug Severt, Samuel Ramsey, and Lilia De Guzman for their research efforts and helpful correspondence. And to Peter Borst for his research assistance. A tip of the hat to Patricia Loreto Aldea Sánchez for her instructive thesis.
I’d like to honor the passing of my friend Aaron Morris, who moderated the Informed Discussion Group of Beekeeping Issues and Bee Biology (Bee-L) until his recent passing. The beekeeping community is full of selfless individuals who give all they’ve got for the benefit of the rest of us.
Citations
[1] https://www.thermosolarhive.com/faq/
[2] Li X, et al. (2019) Tolerance and response of two honeybee species Apis cerana and Apis mellifera to high temperature and relative humidity. PLoS ONE 14(6): e0217921.
[3] Kovac H, et al (2014) Metabolism and upper thermal limits of Apis mellifera carnica and A.m.ligustica. Apidologie. 45(6):664–677.
[4] Free, JB & Y Spencer-Booth (1962) The upper lethal temperature of honeybees. Entomologia Experimentalis et Applicata 5(4): 249-254.
[5] Kablau, A, et al (2020) Hyperthermia treatment can kill immature and adult Varroa destructor mites without reducing drone fertility. Apidologie 51:307–315.
[6] Stürup, M, et al (2013) When every sperm counts: factors affecting male fertility in the honeybee Apis mellifera. Behavioral Ecology 24(5): 1192–1198.
[7] Pettis, J, et al (2016) Colony failure linked to low sperm viability in honey bee (Apis mellifera) queens and an exploration of potential causative factors. PLoS ONE 11, e0147220.
[8] McAfee, A, et al (2020) Vulnerability of honey bee queens to heat-induced loss of fertility. Nat Sustain 3, 367–376.
[9] Meikle, W. G., & Patt, J. M. (2011). The effects of temperature, diet, and other factors on development, survivorship, and oviposition of Aethina tumida (Coleoptera: Nitidulidae). Journal of Economic Entomology, 104(3), 753–763.
[10] https://www.facebook.com/groups/275791919813444/
[11] Mike Immer www.BeeResQ.com
[12] https://www.beeresq.com/post/thermal-control-of-varroa-and-shb-blog-version-pictures-and-graphs-removed
[13] Francis, RM, et al (2013) Varroa-virus interaction in collapsing honey bee colonies. PLoS ONE 8(3): e57540
[14] http://scientificbeekeeping.com/mite-management-update-2013/
[15] Branco, MR, et al (2006) A comparative evaluation of sampling methods for Varroa destructor (Acari: Varroidae) population estimation. Apidologie 37: 452–461.
[16] Le Conte, Y, et al (2010) Varroa mites and honey bee health: can Varroa explain part of the colony losses? Apidologie 41(3): 353 – 363.
[17] http://scientificbeekeeping.com/randys-varroa-model/
[18] https://www.varroa-controller.com/wp-content/uploads/2020/06/dbj-2017-1-Seite-16-17.pdf
[19] http://scientificbeekeeping.com/re-evaluating-varroa-monitoring-part-3/
calculation of nosema spore counts using hemacytometer
Randy Oliver, ScientificBeekeeping.com
From Cantwell 1970, assuming that each sampled bee is diluted with 1 mL of water.
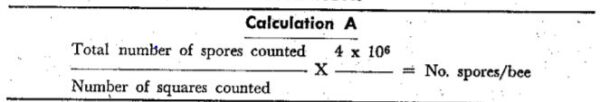
Average spore count per bee is then:
Average count per single small square x 4,000,000.
Total count per large square (16 small squares) x 250,000.
Or total count per 5 large squares (80 small squares) x 50,000.
Beekeeper-funded Research
A Test of Thermal Treatment for Varroa:
Part 1
First published in ABJ March 2021
Randy Oliver
ScientificBeekeeping.com
Last month I wrapped up the report on my testing of mite treatments suitable for application during a honey flow. A number of beekeepers have also asked me about using thermal treatment. I found that there was scant data available on the subject, so I ran a small test myself. But before I share my results, I’d like to review what we currently know about thermal treatment.
BACKGROUND AND HISTORY
Adult varroa mites in the hive appear to prefer temperatures in the range of 79 and 91 F (26 and 33 C) [[1]]. As far as the mite’s ability to reproduce, Le Conte [[2]] found that the optimal temperature for varroa reproduction was between 90 and 94 F (32.5 and 33.4 C). Note that this is a bit lower than the temperature at which Apis mellifera maintain their brood (approximately 94–95 F (34.5–35 C)). Above 100 F (38 C), female mites began to die without reproducing.
Kraus [[3]] followed up on Le Conte’s research, and carefully measured broodnest temperatures in Apis cerana hives. They found that A. cerana does not thermoregulate the brood as closely as does A. mellifera, and the authors make the case that varroa is better adapted to brood held at 92 F (33 C), than at the higher temperature typical of A. mellifera. Kraus proposed that this may be a regulatory factor that the Asian bee uses against the parasite.
Practical application: It appears that varroa is still adapted to the lower temperatures maintained by its original host, and has not yet fully adapted to Apis mellifera. And also, with respect to this article, that varroa starts to stress at temperatures lower than those tolerable by bees.
However, in order to disperse from hive to hive, mites must be able to deal with short-duration heat spikes, since hitchhiking mites can survive on bees flying with thoracic temperatures of 105 F (40 C). Le Conte exposed mites in cells to a range of temperatures and durations, and found that 12 hrs exposure to 106 F (41 C) would kill nearly half the mites, and 6 hrs exposure at 108 F (42 C) would kill nearly all of them. But 2 hrs exposure at 108 F (42 C) killed very few.
Adult honey bees, on the other hand, appear to be able to handle short-term exposure to temperatures as high as 110F (44 C) [[4]]. It didn’t take long for researchers to realize that due to the differences in temperature tolerance of bees and mites, that we might be able to use high-temperature (hyperthermia) to control varroa.
In order to allow you to unscramble your brain from all the converted numbers, I’ve created a table for honey bee and varroa temperature tolerance (Table 1).
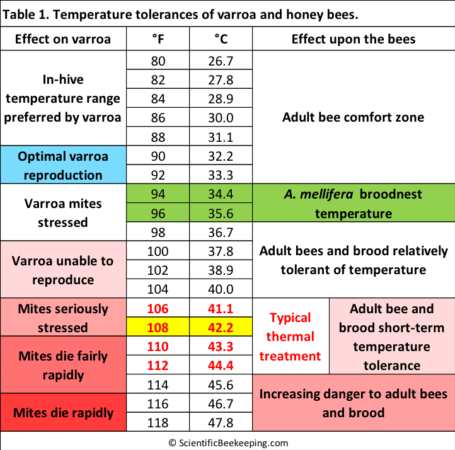
Practical application: Note above the relatively narrow range of temperature for thermal treatment at which we can kill the mites without hurting the bees. I’ve highlighted in yellow what appears to be the minimal temperature required to kill most of the mites in the brood within 3 hours of treatment.
HOW MUCH WIGGLE ROOM IS THERE?
Harbo [[5]], in the year 2000, after testing thermal treatment to remove mites from adult bees, concluded that:
Even 40°C, the lowest temperature that can remove all the mites [from caged adult bees], is perilously close to temperatures that kill bees.
So just how much wiggle room do we have? If we want to kill a parasite while it’s on or in its host, we want to use a treatment that has a wide margin of safety between its lethal levels to the two species. The margin of safety is often expressed as a “selectivity ratio” — for varroa treatments, calculated by dividing the dose that kills bees by the dose that kills mites. In Table 2, I’ve listed some approximated selectivity ratios for some common varroa treatments.
| Table 2. Approximate selectivity ratios of common miticides. |
| Treatment |
Selectivity ratio |
Author |
| Amitraz |
7000:1 |
Santiago[[6]] |
| Fluvalinate |
1000-4000:1 |
Santiago, Lindberg[[7]] |
| Oxalic acid |
400:1 |
Aliano [[8]] |
| Formic acid |
2-4:1 |
Lindberg |
| Thymol |
3-4:1 |
Lindberg, Imdorf [[9]] |
Note how much a wider margin of safety there is for the synthetic acaricides than for the organic acids or thymol. By comparison, the margin of safety for thermal treatment is tiny. Refer back to Table 1 to see that there’s only a few degrees difference between the temperature required to kill mites in the brood, and that which starts to harm the bees themselves.
Dalman [[10]] recently confirmed that worker bees suffer adverse effects at temperatures above 40 C (104 F) over the long term, and from even an hour’s exposure to 43 C (110 F). As a side note, although they found that high temperature may suppress virus multiplication, they concluded that thermal treatment was not a useful tool to control viruses in bees.
Practical application: Exposing bees to temperatures only a few degrees higher than normal broodnest temperature has the potential to harm them. The challenge then is that it takes such a high temperature for some period of time in order to kill the mites. Thus, any thermal treatment device or system must control the temperature precisely within a narrow range, for a specific number of minutes or hours.
So let’s take a look into exactly what we know about the required temperatures and durations of treatment required.
USING HYPERTHERMIA TO KILL MITES
Years ago, when I was visiting beekeeper Leonid Zaytsev in Oregon, he showed me a screened tumbler that Russian beekeepers had long used to shake adult bees into, so as to heat them up temporarily to kill the mites. As explained by Harbo:
Bees are removed from their colony in autumn when there is very little brood. They are caged, placed in a chamber, and rapidly heated to 46 °-48°C (RH ~ 20%) until mites stop falling from the bees (c. 2-15 min). This technique is 85-95% effective.
Update: Jeff Cunningham performed a SARE project of testing the method in 1996. Read it at https://projects.sare.org/project-reports/lne96-066/
The above treatment was both tedious, and wasn’t of much use when colonies contained brood (which typically contains 50-75% of the mites in the hive). Appel and Büchler [[11]] in 1991 tested a thermal chamber to treat frames of brood without adult bees:
100% of the mites were killed after at least 4 h treatment with 44 °C… A 4-h treatment at 44 °C had a limited but non significant…effect on bee longevity; no difference was recorded in emergence rate and food consumption. Stronger treatments, in particular a rise in temperature to 45 °C, had a negative and frequently significant effect on emergence rate and longevity of bees. Younger brood (9 -10 d) reacted in the most sensitive manner…In principle, heat treatment of trapping combs seems suitable for Varroa control, but this technique requires exactitude in controlling temperature and heat regulation.
Another device is the Thermosolar Hive [[12]]. This design uses glass windows to absorb the sun’s heat, and maintains an elevated internal temperature during the course of treatment. The beekeeper must monitor the temperature and manually replace the window covers to avoid overheating. An open entrance is maintained for the adult bees to move out. I was surprised by the manufacturer’s own measurements of the temperature reached in the broodnest — holding at up to 117 F (46.7 C). Their data [[13]] indicate good mite control. They do recommend retreatment to hit any returning mites that were on the adult bees during treatment, after they’ve reentered the brood.
There’s also the Varroa Controller, into which the beekeeper places adult-bee-free combs of brood for thermal treatment (temperature not specified). They have a very informative online book about varroa management [[14]], which describes how to use the device, in commendable German detail. Of interest is that this device uses distilled water to maintain humidity during treatment. They claim 60–80% kill of the mites in the treated brood frames. Of interest, they state that mites may continue to die for up to 50 hours after treatment, a point that I kept in mind when I dissected brood to confirm mite kill in my own testing of thermal treatment.
The device was tested by Bičík [[15]], who confirmed 99-100% mite kill in the brood frames, following holding them at a temperature of 40 – 47 °C (104 – 116.6 °F) for 2½ hours.
THE REQUIRED DURATION OF TREATMENT
A Greek company patented the Thermovar device, which is attached to a colony with minimal brood to create a closed system from which the bees cannot escape. The device then circulates heated air through the hive. Of great interest is the meticulous data from tests of the device by Goras [[16]]. In their trial, in which they measured the air temperature between the combs:
The device temperature was adjusted to 42°C and the thermal treatment was applied on 27 complete bee colonies for a time range of 12 to 480 minutes. The duration we used in particular was 12, 20, 30, 40, 60, 120, 240, 360 and 480 minutes… During treatment the temperature varied from 42.3 to [over] 46.5 C. This high temperature did not last long, since the bees managed to reduce it by actively evaporating water…
They then counted dead bees, fallen mites, and also dissected the brood to determine percent mite kill.
No losses of adult bees were observed even after 480 minutes of treatment. Up to 120 minutes of treatment the brood was not affected negatively, whereas after 240 minutes, a percentage from 6% to 50% of the larvae [ceased] to develop and died. The development of the treated bee colonies was normal and no delay was observed in the following months compared to other colonies of the same apiary which were not subjected to hyperthermia.
I’ve graphed their findings below (Figure 1).
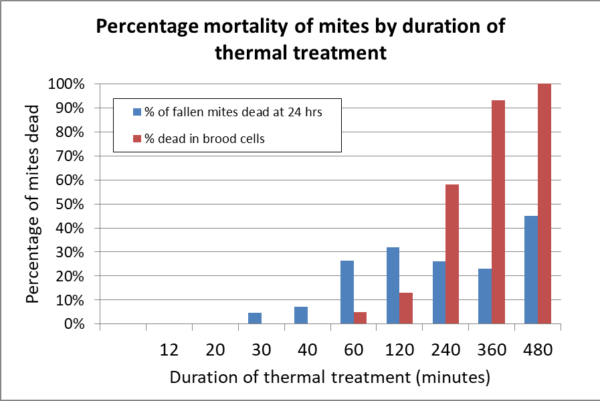
Figure 1. The findings of Goras, using the Thermovar device, set at 42 C. Note that although mites may drop from the bees, that doesn’t mean that they are dead (at least 55% recovered). Also note that substantial mite kill in the brood doesn’t even begin until after two hours of thermal treatment. It took a full six hours of cooking to reach a 90% kill of the mites in the brood!
Practical application: Goras’ data is really helpful to see the effect of treatment at 42 C (108 F). No adult bees died, but brood started to die after 4 hours of treatment. Lots of mites fell, but most were still viable even after 8 hours of hyperthermia. It took 4 hours to obtain appreciable kill of the mites in the brood, and a full 8 hours to attain 100% kill. The take-home message is that a temperature of even 42 C may be barely enough to obtain good efficacy of mite kill.
A very recent paper by Kablau is also of interest [[17]], whose data I’ve graphed below (Figure 2). Kablau placed adult-bee-free brood combs in a high-humidity (70-90% RH) incubator for treatment, and measured the actual temperature inside the brood combs.
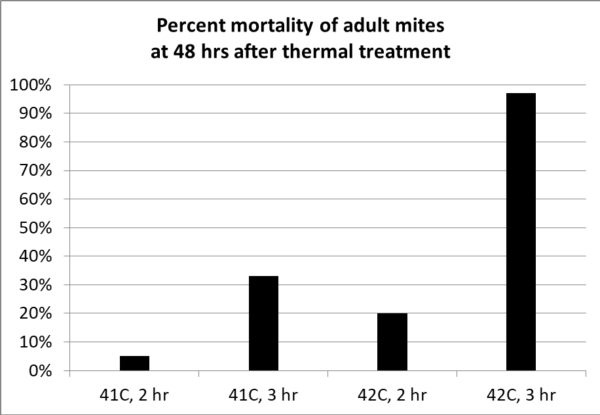
Fig. 2. I’ve simplified Kablau’s findings, by only showing mite mortality at 48 hours after treatment, since there was a slight increase from that at 24 hours. Not shown is their finding that immature mites suffered 100% mortality from all four treatments. Note that a temperature of 41 C was inadequate, and even 42 C took 3 hours for good control.
Kablau teased out the difference in efficacies for the temperatures of 41 and 42 C, with his results indicating that 42 C would be a practical minimum. An important note is the Kablau found that thermal treatment only one degree higher (43 C (110 F)) also killed the drone brood, but at 41 C, not only did the drone brood survive, but the sperm in those drones, once they emerged, was unharmed. Kablau thus concluded that:
Hyperthermia treatment using temperatures above 42°C reliably killed both adult and immature mites, similar to what has been shown by Goras… Unfortunately, these high temperatures also killed the drone brood. Therefore, this treatment is unsuitable for removing Varroa destructor from a honeybee colony. Treatment at 41°C for 2 hours effectively killed immature Varroa destructor while not affecting drone vitality or fertility. Thus we can effectively interrupt the reproductive cycle of Varroa destructor without harming honeybee drones.
Practical application: Kablau’s concern about harming drone brood would not be shared by many beekeepers, since sacrifice of drone brood is commonly performed for varroa management. I also wonder whether killing only 30% of the adult mites in the brood would make thermal treatment worthwhile. The take home is that it appears to take at least 3 hours at 42 C (108 F) to kill most of the mites in the brood, provided that high humidity is maintained.
And this brings us to a key point — Kablau attained better mite kill in the brood at 42 C in three hours than did Goras in 6 hours. Why? It appears to be due to the fact that only Kablau’s device maintained high humidity. But Kablau was not testing for adverse effects upon adult bees from the high humidity maintained in his treatment chamber. And that brings us to the question…
IS HUMIDITY IMPORTANT?
As I look into thermal treatment, I note that some devices or laboratory experiments allow for free exit of adult bees and air, whereas some confine the adult bees and brood in a heated chamber, and in others the beekeeper places only brood combs in the device. In some setups, high humidity is maintained by a water reservoir. But only a few studies have tested mite and bee mortality under thermal treatment at different humidities.
When one warms liquid water, its vapor pressure increases more rapidly than does that of the other gases in air. This results in more rapid evaporation of the water. Perhaps counterintuitively, the higher the content of water vapor in air, the less dense that air becomes, resulting in a thermoconvection force of that water vapor upward. This detail may be important in the design of thermal treatment devices that do not have a fan or leave the hive entrance open.
During heat treatment, bees on the combs will attempt to reduce the temperature by fanning and evaporating water. If the device is designed to maintain high humidity, it can prevent such evaporative cooling.
On the flip side, if water vapor is allowed to escape and be replaced with cooler incoming air, then both the adult bees and brood, as well as the mites, may become dehydrated during the hours of treatment. Varroa mites are able to absorb water directly from the air at relative humidities above around 85% [[18]]. But both mites and bee pupae start to rapidly lose moisture at temperatures above 30 C. So with prolonged thermal treatment, water stress likely becomes an issue for both species.
On the other hand, too much humidity may decrease adult bee survivability (Figure 3).

Fig. 3. Surprisingly, survivability of heated caged honey bees decreases with high humidities. Note that at 45 C, few bees survived longer than 2 hours at any of the tested humidities. Chart adapted from Li [[19]].
Practical application: It ain’t just the temperature — thermal treatment devices must take into account humidity. But there is a scarcity of data on the effects of humidity upon adult bees, brood, or mites.
TDT CURVES
There is one more study of interest — a 2020 doctoral dissertation by Patricia Loreto Aldea Sánchez of Chile [[20]]. She looked into the concept of “thermal death time” (TDT) curves as elaborated by Tang [[21]] for disinfection of commodity crops. Aldea was interested in determining the optimal combinations of temperature and exposure time to control varroa. She made clear that a key concept of thermal treatment is that organisms may be able to handle short-duration high temperature stress, but be harmed by longer exposure to a lower temperature.
Practical application: Thermal treatment for varroa involves an understanding of the combined effects of the intensity and duration of a thermal stress upon survival or other fitness components [[22]], for both the mites and the bees (including their brood).
Aldea not only analyzed existing findings in the literature, but also ran experiments to determine the effect of pre-acclimation of bees to elevated temperature for several days prior to challenging them to high temperatures. In short, she found that pre-acclimation allowed bees to better withstand exposure to higher temperature (it increased their thermal tolerance).
But that’s not all. Aldea also compared the thermal tolerance of bees experimentally parasitized by varroa vs. unparasitized workers. Much of that thermal tolerance was lost when a bee has been fed upon by a mite.
Practical application: Thermal treatment might best be utilized during summer, when the bees are acclimated to warmer temperature. But it may be wise to use thermal treatment preventatively — before the colony is highly infested with varroa.
Aldea also brings up an important observation from existing findings:
Interestingly, higher honeybee mortality was generally observed during prolonged exposure to less extreme temperatures (48 to 76 h…), whereas treatments with an acute exposure to temperatures >42°C were generally less problematic for the bees.
Following upon Aldea’s intriguing studies, I created a crude chart to help us visualize the “sweet spot” for heat intensity and duration to kill mites without killing the bees (Figure 4).
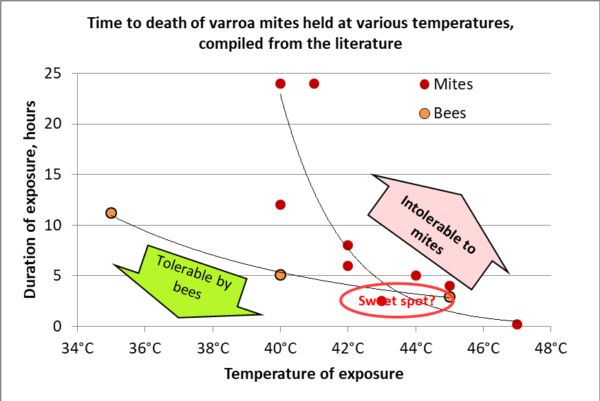
Figure 4. In order to kill mites, it takes a very long exposure to a temperature of 40 C, or far less time at 46 C. Since bees can tolerate short exposure to very high temperatures better than long exposure to somewhat lower heat, a short-duration thermal treatment would be desirable (and have the added logistical benefit of a quicker application). This very crude chart roughly indicates the two different “thermal death time” curves for varroa or bees, and can help us to figure out best treatment opportunities (somewhere in the vicinity of the “sweet spot”). Note that we need far more data for bee and mite temperature tolerance relative to humidity — the three data points that I used for bees are from a single experiment by Li [[23]] for adults held at 50% RH.
Practical application: After reviewing all the above studies, it appears that for effective thermal treatment:
- As far as temperature, the bees and brood should be held at or above 42 C (108 F).
- The treatment should be of short-duration (no longer than 2-3 hours).
- Perhaps the humidity should be controlled.
- An optimal treatment would kill the mites on both the adult bees and in the brood.
- Just because mites drop off the bees, they may not be dead, and must be kept from returning to the bees after completion of treatment.
DESIGN OF HYPERTHERMIA DEVICES
Hyperthermia devices typically use convective heat transfer to kill the mites on the adult bees (as opposed to radiant, conductive, or electromagnetic heat transfer) [[24]], and both convective and conductive transfer to kill the mites under the cappings (the Mighty Mite also uses conductive and radiant transfer to kill mites that fall upon the heating plate). This means that most heat transfer to the mites is via the heated air, possibly augmented by the phase change of water vapor as it contacts a cooler mite. The various devices depend upon two different forms of convective heat transfer:
- Free convection, such as the Mighty Mite device, in which a heating plate is inserted below the frames, or
- Forced convection, such as in the Thermovar, in which the air is circulated by a fan.
As far as humidity, devices that completely enclose the combs can take advantage of the enhanced heat transfer from water vapor. So the two basic design options are:
- Closed, vapor-saturated devices, such as the Varroa Controller, or
- Open, “dry air” devices, such as the Mighty Mite or Victor.
Heat transfer is quicker with water vapor-saturated air, due to the transfer of the latent heat of condensation when it contacts a cooler surface. If instead the air is simply heated, it will cause its relative humidity to drop, and the bees and mites will not heat as quickly, due to the cooling effect of water evaporating from their bodies. Conversely, such evaporation may lead to desiccation, which might be expected to more effect any mites not ensconced in a brood cell.
DISCUSSION
Various inventors have developed quite different thermal treatment devices. It appears that to obtain good varroa kill, that the required temperature and duration is indeed, as well put by Harbo, perilously close to that which may harm the bees. Most U.S. beekeepers are unlikely to be enamored with a device that requires the brushing of workers from brood frames, transferring those frames to the apparatus for treatment, and then returning them to the hive, while not addressing the mites on the adult bees left in the hive. A device that can be simply inserted into, or clamped onto a hive would be most desirable.
The Thermovar from Greece is of interest, since it can be used on a standard hive, provided that electricity is available, and its fan-forced air would equalize the temperature, which ranges from 108-122 F (42-50 C). The Victor sits on top of a brood chamber and uses a fan to force air heated up to 117 F (47 C) into the combs, creating a gradient of heat down through the hive. The Mighty Mite is simple to insert into the hive entrance, and heats the combs to around 106 F (41 C). I’m also curious as to just how important is control of the humidity. I agree with Alison McAfee [[25]] that a lot of questions remain unanswered. I’ll quote from Aldea to wrap this up:
Thus, more detailed studies of thermal tolerance in both honeybees and Varroa within the hives are necessary for a characterization of TDT curves under more realistic conditions and to design effective management strategies to deal with parasite.
COMING
I performed a little test of thermal treatment myself, and analyzed data collected by other beekeepers who have used thermal treatment. I’ll share the results next month.
REFERENCES
[1] Rosenkranz, P, et al (2010) Biology and control of Varroa destructor. Journal of Invertebrate Pathology 103: S96–S119.
[2] Le Conte, Y, et al (1990) Influence of brood temperature and hygrometry variations on the development of the honey bee ectoparasite Varroa jacobsoni (Mesostigmata: Varroidae). Environmental Entomology 19(6): 1780–1785.
[3] Kraus, B, et al (1998) Temperature profiles of the brood nests of Apis cerana and Apis mellifera colonies and their relation to varroosis. Journal of Apicultural Research 37:3, 175-181
[4] Free, JB & Y Spencer-Booth (1962) The upper lethal temperatures of honeybees. Ent. Exp. et Appl. 5: 249–254.
[5] Harbo, J (2000) Heating adult honey bees to remove Varroa jacobsoni. Journal of Apicultural Research 39(3-4): 181-182.
[6] Santiago, G, et al (2000) Comparing effects of three acaricides on Varroa jacobsoni (Acari: Varroidae) and Apis mellifera (Hymenoptera: Apidae) using two application techniques. The Florida Entomologist . 83(4): 468-476.
[7] Lindberg, C, et al (2000) Laboratory evaluation of miticides to control Varroa jacobsoni (Acari: Varroidae), a honey bee (Hymenoptera: Apidae) parasite. Journal of Economic Entomology 93(2): 189–198.
[8] Aliano, N, et al (2006) Acute contact toxicity of oxalic acid to Varroa destructor (Acari: Varroidae) and their Apis mellifera (Hymenoptera: Apidae) hosts in laboratory bioassays. J. Econ. Entomol. 99(5): 1579-1582.
[9] Imdorf A, et al (1995) Toxic effect of thymol, camphor, menthol, and eucaliptol on Varroa jacobsoni Oud. and Apis mellifera L. a laboratory test. Apidologie, 26: 27-31.
[10] Dalmon, A, et al (2019) Temperature-driven changes in viral loads in the honey bee Apis mellifera. Journal of Invertebrate Pathology Volume 160: 87-94.
[11] Appel, H & R Büchler (1991) Heat treatment of brood combs for Varroa control Apidologie 22(4): 470–472.
[12] https://www.thermosolarhive.com/
[13] https://www.thermosolarhive.com/images/clanky/thermotherapy_2015_EN.pdf
[14] Wimmer, W (2019) Handbook of heat treatment against the Varroa. https://www.varroa-controller.com/wp-content/uploads/2020/05/Handbook-of-heat-treatment-against-the-Varroa.pdf
[15] Bičík, V, et al (2016) The effectiveness of thermotherapy in the elimination of Varroa destructor. Acta Mus. Siles. Sci. Natur 65: 263-269.
[16] Goras, G, et al (2018). Hyperthermia -a non-chemical control strategy against varroa. Journal of the Hellenic Veterinary Medical Society, 66(4), 249-256.
[17] Kablau, A, et al (2020) Hyperthermia treatment can kill immature and adult Varroa destructor mites without reducing drone fertility. Apidologie 51:307–315.
[18] Yoder, J, et al (1999) Water requirements of adult females of the honey bee parasitic mite, Varroa jacobsoni (Acari: Varroidae) and implications for control. International Journal of Acarology Volume 25(4): 329-335.
[19] Li, X, op cit.
[20] Aldea, P (2020) The physiological and life-history costs of parasitism: effect of the interaction between temperature and the ectoparasite Varroa destructor on Apis mellifera. Pontificia Universidad Católica de Chile Facultad de Agronomía e Ingeniería Forestal.
[21] Tang, J, et al (2007) Heat Treatment for Postharvest Pest Control. Cromwell Press, Trowbridge.
[22] Rezende, E, et al (2014) Tolerance landscapes in thermal ecology. Functional Ecology 28: 799- 809
[23] Li, X, op cit.
[24] Tang, J, op cit.
[25] McAfee, A (2020) Thermal treatments for varroa. ABJ 160 (1): 49-51.
Crystals from oxalic acid vaporization on bees’ bodies
Randy Oliver
February 2020
In order to determine how OA crystals settled on bees’ bodies after an OA vaporization, I set a graduated microscope slide and a number of dead bees under a 16-oz inverted plastic cup. I injected OA vapor briefly into a hole at the top of the cup, and then allowed the fog to cool and settle for a few minutes before removing the bees.
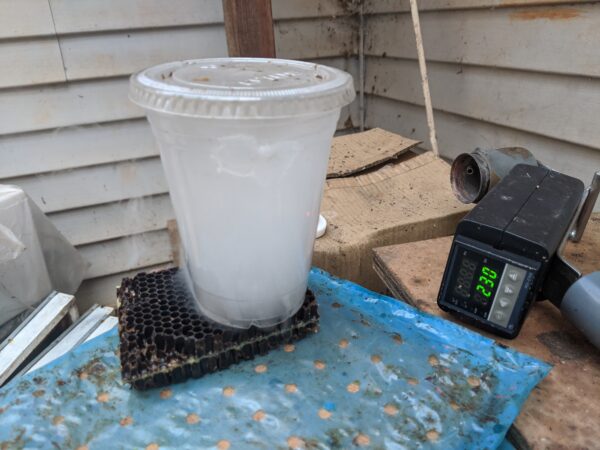
Too much vapor resulted in snow-white bees and a white slide covered by a layer of OA crystals. By trial and error, I found how much vapor to inject to reach what appeared to be a field-realistic “dose” of OA on the bees:
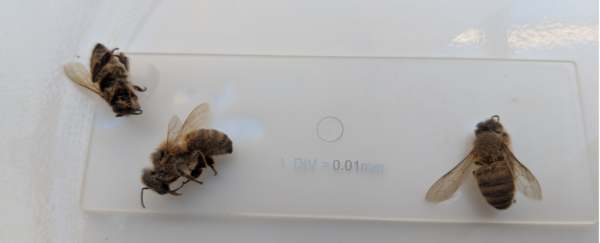
The bees and slide looked like this after allowing a light OA fog to settle on them. The bees were not noticeably “whitened.”
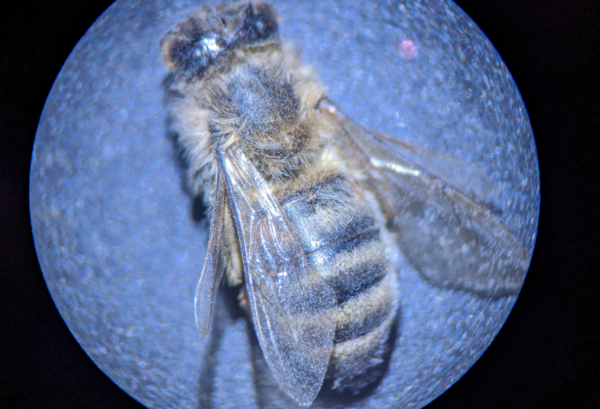
Close up of a bee. You can see the white crystals on its wings and “hairs.”
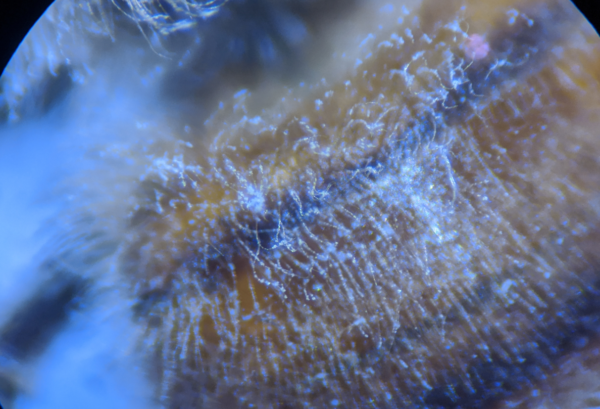
A closer view of the same bee, OA crystals mainly on the tips of these thoracic setae.
I titrated the amount of OA on the bee’s bodies. It was roughly equivalent to 0.0001 g/bee (equivalent to 5 ml of medium-strength OA applied to a frame interspace containing 2000 bees, or 2 g OA vaporized onto 20,000 bees). So it appears that this amount of OA crystals is field realistic. I’ll confirm with full-hive vaporizations.
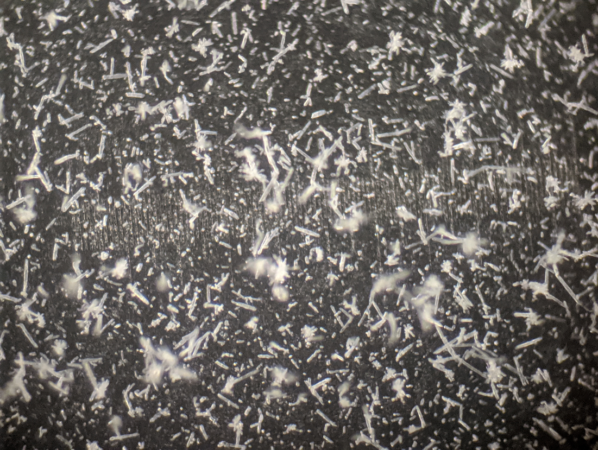
A view of the slide at 400x. OA crystals, dark field.
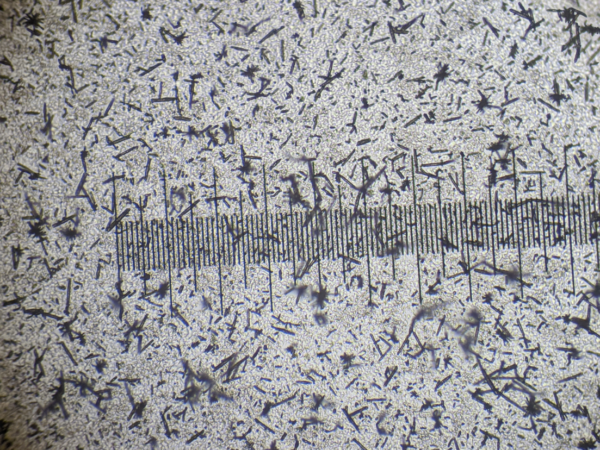
OA crystals on the same slide, light field (crystals look black); scale is 0.01 mm gradations.

Crystals on the abdominal setae.

Close up of OA crystals.
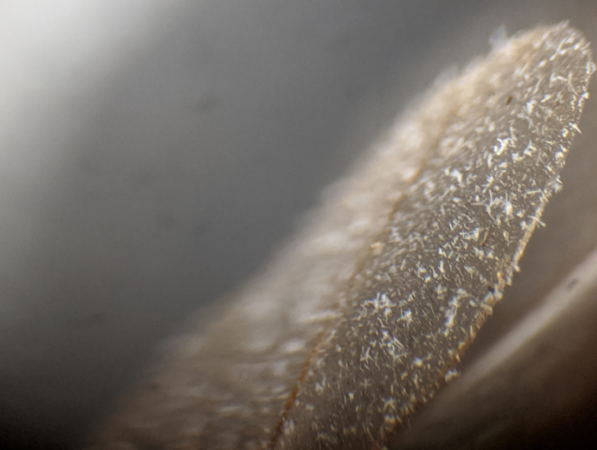
The bee’s wing at 100x.
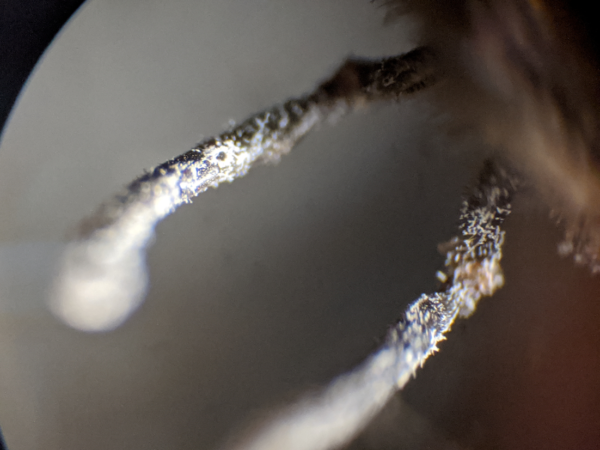
The bee’s antennae.

Setae at 400x.
The above photos were of dead bees vaporized in the cup, as shown.
Photos after in-hive vaporization
The photos below are from the few dead and dying bees at the entrance of a hive an hour after vaporization with ProVap 110. Note that there are far fewer OA crystals.
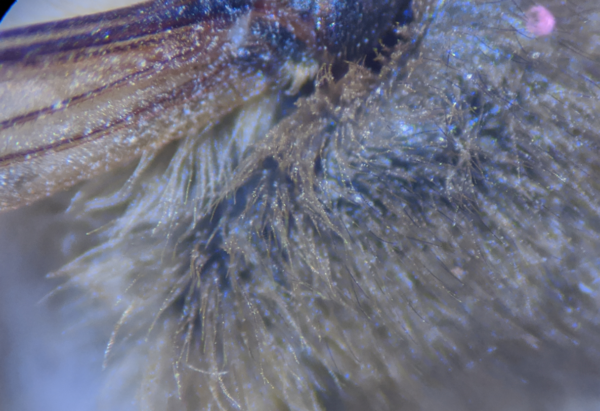 A lighter coating of OA crystals.
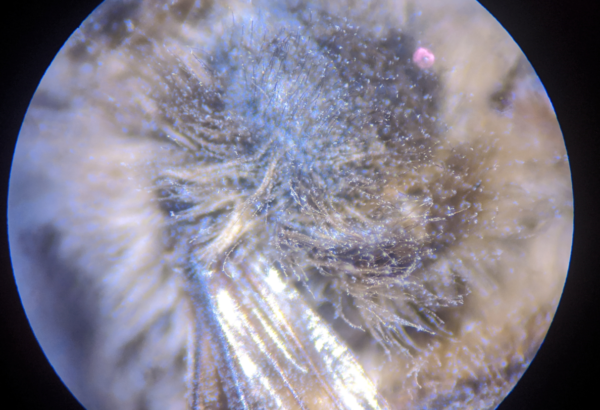
When I viewed bees from the inside of the cluster 10 minutes after vaporization (to allow the crystals to attach to the bees), I surprisingly couldn’t see any crystals on the bees, and the bees surprisingly tested negative for OA residues – I am following up on this observation!
All above photos reduced in size. Contact me for full-resolution.
Mite Control While Honey is on the Hive
Part 4
First Published in ABJ February 2021
Randy Oliver
ScientificBeekeeping.com
In the three previous articles in this series, I showed the results of my field trial of summer mite treatments. Now let’s go a little further with extended-release oxalic acid (OAE).
A Note on Terminology
Following the commonly-used acronyms OAV for vaporization, and OAD for dribble application, I’m shortening the acronym that I’ll use for extended-release oxalic acid to “OAE.” OA will refer to oxalic acid dihydrate, and “gly” for glycerin.
Findings by Others
Studies by Geoff Williams and Jennifer Berry in Georgia suggested that OAE on shop towels did not exhibit as good, or as consistent an efficacy as I repeatedly obtain in California. I was curious as to why that was, and have tried to line up additional collaborators in areas with high humidity, to see whether humidity was the explanatory factor. Unfortunately, a planned collaborator at Florida A&M University, Dr. Lee Bushong, was forced to forego a field trial this year due to the pandemic.
However, one ambitious teenager, Soren Roberts, was able to run a small trial in humid Virginia. We report his findings in a separate article in this journal.
In a recent study from Ontario, Canada, Sabahi [[1]] obtained nearly 80% efficacy in reduction of the total mite population in the hives (as opposed to the reduction in the infestation rate that I measure) after only 4 weeks of treatment, using a low-saturation formula of OA/gly on shop towels, placed on the top bars of single-deep colonies. Those good results were despite the fact that such lack of exposure of the bees to the upper surface of the towel allows for only minimal contact of the bees to the OA/gly towels. Sabahi’s findings also suggest that we need to further investigate extended-release of thymol in glycerin.
The Effect of Treatment Upon Colony Condition
As far as I can tell, every treatment for varroa has its cost. Some irritate the adult bees, some kill eggs, larvae, or queens, some suppress egglaying, some adversely effect bee immunity or behavior. Oxalic acid is no exception [[2]]. Surprisingly, there are few reports of adverse effects from OAE. However, Sabahi noticed slightly elevated adult bee mortality in small colonies continually treated with OA/gly.
So the question for any mite treatment is always, does the benefit to the colony from mite reduction outweigh the cost of treatment (as far as adverse effects)?
Practical application: Beekeepers are sooo danged predictable — one of the first questions that I hear about OAE is “Will we be able to keep it on our hives year-round?” I seriously doubt that that would be a good idea, as I can’t imagine that there are no adverse effects even from low-level continual exposure to OA.
In a previous trial with 18 g OA in glycerin on shop towels, I did not detect any adverse effect [[3]]. But in other experimentation, I’ve observed adverse effects upon the bees and brood when I applied 18 g of 1:2 w:w OA:gly on either two half shop towels or an equal surface area of chipboard (Figures 1 & 2).
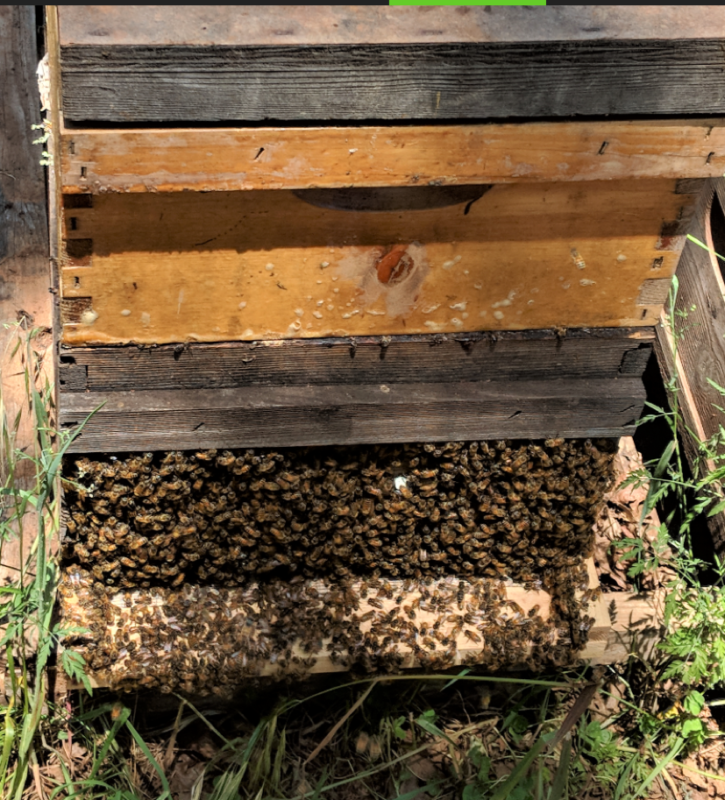
Fig. 1 Only when I’ve applied matrices with a high ratio of glycerin to OA have I observed agitation and bearding of the bees. This photo was taken on a spring day the day after application of towels prepared with eight different ratios of OA to glycerin. The hives which received the other seven ratios did not exhibit bearding.
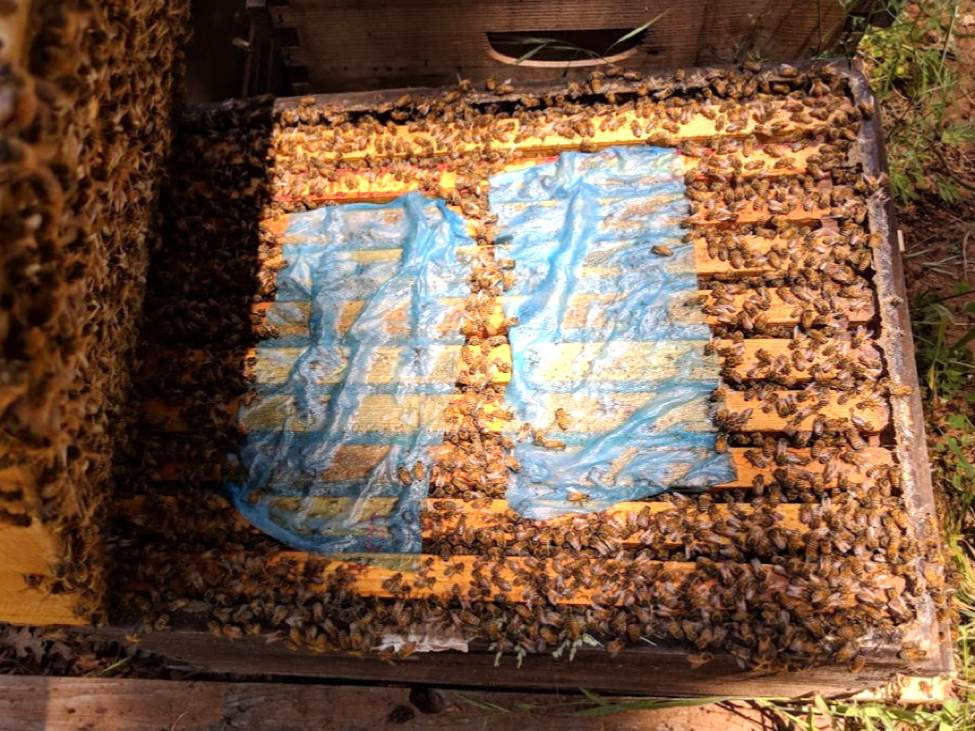
Fig. 2 When I opened the hive, it was easy to see that the bees were agitated, spaced apart, and avoiding contact with the saturated towels. With the other test formulations, there was no apparent agitation, and bees were walking over the towels.
Practical application: The Argentinian Aluen CAP formulation [[4]] uses the ratio of 1 g OA to 2 mL glycerin. One advantage of this ratio is that the OA can be dissolved at room temperature, and it doesn’t crystallize on the strips. A disadvantage, besides the possibility of dispersing the OA onto the bees too rapidly (causing adult agitation and brood kill), is that this uncrystallized acid solution sticks to your hands (and anything else that they touch) during application. This is why I prefer the 1:1 (by weight) ratio.
In previous trials, I haven’t applied more than 18 g of OA to a hive, so it was with some trepidation that I applied 50 g of OA in the two-sponge treatment in this trial. As far as adverse effects upon the brood, I’ll let you decide for yourself (Figure 3).
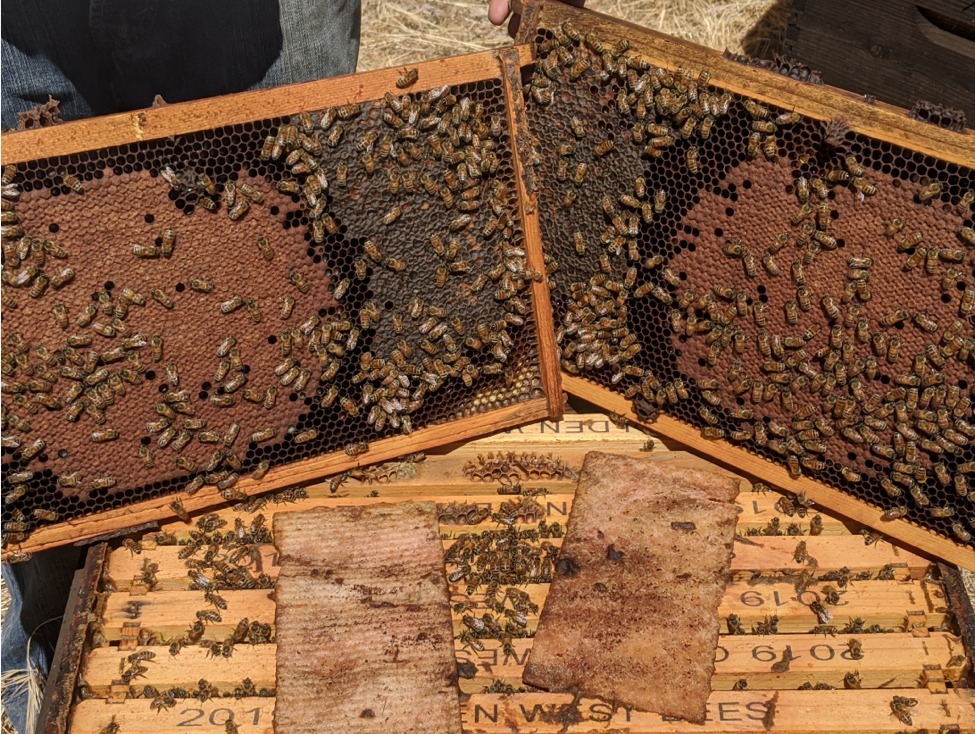
Fig. 3 I was concerned that the two-sponge OA/gly treatment might disperse too much OA and cause adverse effects upon the brood. This did not appear to be the case, as evidenced by the brood pattern in this typical double-sponge (50 g) treated hive at the end of the trial. Keep in mind that many of these colonies had very high mite counts and lousy brood patterns at the start of the trial. It was impressive to see how well they could recover with an efficacious treatment.
Practical application: This trial was not designed to measure adverse effects or honey production, but our informal field observations indicated that colonies in which the mite counts were quickly reduced to low levels performed better, as far as colony growth and honey production. So for quick mite knockdown, Formic Pro might be the best choice.
On the other hand, I performed another field trial this season in which I did measure colony strength and honey production in two different yards. All the hives received OAE treatment, other than a scattering of potentially mite-resistant colonies that received no mite treatments. Something that caught my attention was that the untreated (naturally-resistant) colonies seemed to be performing very well relative to at least some of the OAE-treated hives. So I worked up the data (Figure 4).

Fig. 4 The Shady Yard data (upper left) sure made it look as though OAE treatment (red columns) may have had a negative effect upon weight gain, compared to the untreated hives (blue columns); but that wasn’t the case in the Sunny Yard. Nor did there appear to be any consistent adverse effect upon colony strength in either yard. Take-home point: Never draw conclusions from the results of any experiment run only in a single yard!
And then my sons brought back a load of bees from the Pumpkin Patch …
Hives Returning from Pumpkin Pollination
In July Eric and Ian were scrambling to find 36 hives to move to a long-time pumpkin pollination contract. I told them that I was finished grafting for the year, and that there were roughly that many strong singles headed by 2nd-tier mite-resistant breeder queen colonies that I had no more use for, especially since some, in their second season, were allowing mites to climb a bit. So they put a half OA/gly sponge (25 g OA) in each one, slapped on a second deep of foundation and drove them to the farm.
This was an unusual site, since it is in an isolated irrigated desert valley in Nevada, and our hives were the only honey bees in the valley. The only forage was pumpkins, a little alfalfa, and some desert bloom. Most years, colonies do poorly there, and since we don’t bring the hives back ‘til late October (so that we can pick up pumpkins for Halloween), mite levels upon return are generally pretty high, and the colonies are in terrible shape.
But when the boys brought the hives back this year, they were all smiles, since the colonies were strong and plugged with honey. Out of curiosity, I performed mite washes on ten of them, to see how badly the mites had gone up. To our amazement, the mite wash counts were 0, 1, 0, 0, 0, 0, 1, 0, 0, and 0.
Practical application (perhaps a peek into the future of beekeeping?): Here were mite-resistant colonies that had received only a single mite treatment in two years — a single OA/gly sponge in their second summer. By early November (four months after application), the sponges contained little glycerin and were dry to the touch, and in many hives were largely chewed and removed (the remnants still tasted like straight oxalic acid). Yet these colonies kicked butt and came home heavy with honey and nearly free of mites. How cool would it be to be able to run all such mite-resistant colonies that require only one minimal treatment with OAE each year?
I know that this is going to sound like an institutional researcher making a pitch for funding, but we clearly need to perform more controlled trials to tease out whether OA/gly indeed suppresses colony buildup or performance, to what extent, from how long an exposure, the optimal time to apply it, and ultimately how it can best be used in an integrative pest management program to control varroa.
The Effect of Surface Area
This year’s experiment with the Swedish sponges was instructive. They held a lot of OA/gly solution, and as the glycerin absorbed moisture, the sponges maintained a “wet” surface for a long time. They also had the advantage over shop towels that the bees didn’t chew them or even propolize them to any extent (Figure 5).
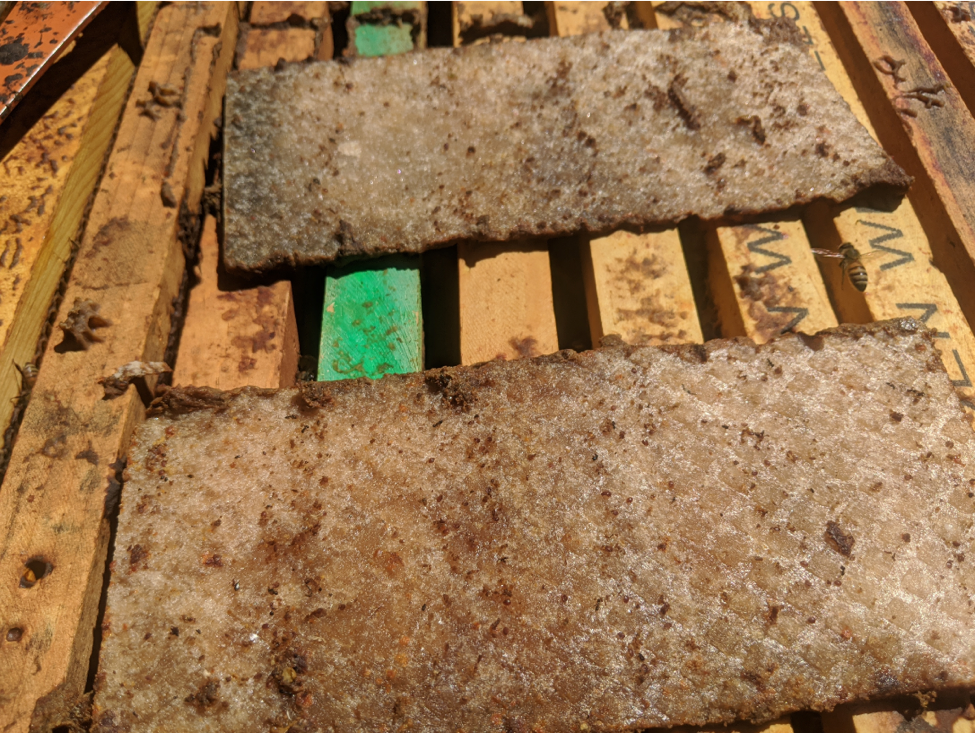
Fig. 5 Two OAE sponges after 42 days in a hive. My question then was, how much of the 50 g of OA was actually dispersed onto the bees?
So I weighed some “spent” sponges (Figure 6).
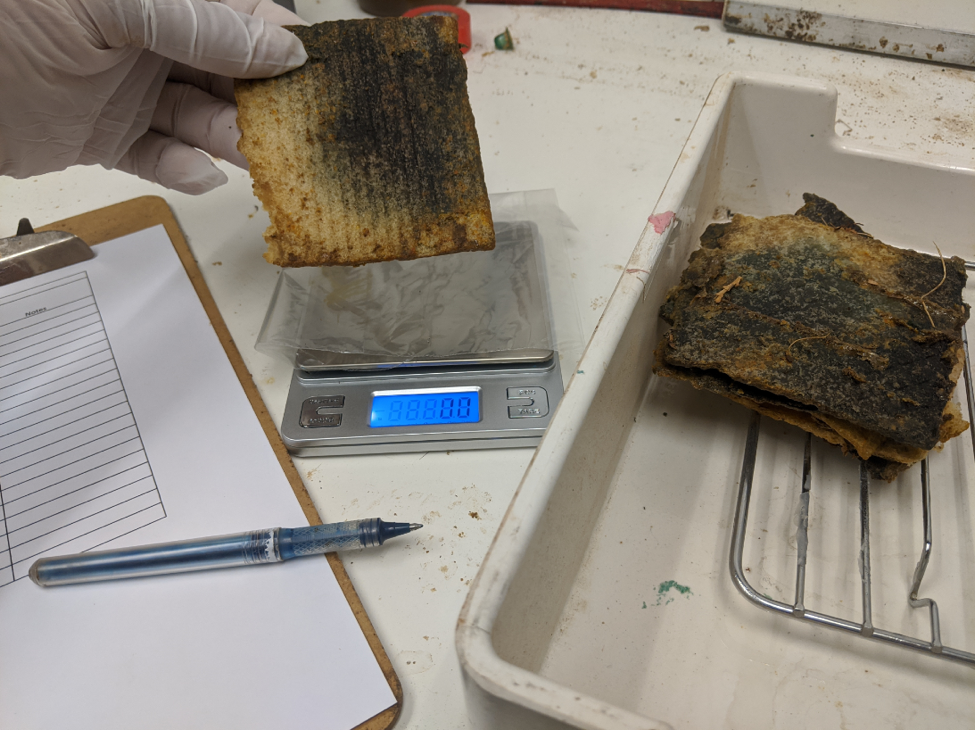
Fig. 6 What I learned was that in California, where ambient relative humidity is lower than broodnest humidity, the glycerin in OAE sponges initially absorbs water once the sponges are placed in a hive, and the sponge initially increases in weight. But they then don’t lose much weight afterwards — the sponges still hold most of the original amount of OA even after two months in the hive.
When I air-dried fresh and “spent” sponges after removal from the hive, it indicated that of the 50 g of OA originally in two sponge strips, only 10-15 grams of OA was actually dispersed into the hive. And for the quarter strips that provided good mite control from June through the end of August, only about 4 g of OA were released.
Practical application: It doesn’t take much OA to control varroa in a hive if it is applied in the “right” way, and applied early in the season.
Possible Advantage to a Chewable Matrix
Although we liked the sponges for application of OAE, since the bees didn’t propolize them or inconsistently remove them too quickly, there may be an advantage to a matrix that the bees do chew away. In a previous experiment, we took stickyboard counts of mite drop following application of shop towels with different ratios of OA to glycerin. What my assistant, Brooke Molina, noted was that with some formulations, there was a pileup of towel residue on the stickyboard, just inside the hive entrance (Figure 7).

Fig. 7 Note the pile of shredded towel just inside the hive entrance. The towels had been placed on the top bars of the lower brood chamber of a double deep hive. The bees appear to have dragged the chewed-off pieces to the front of the hive, and then dropped them between the end bars and the inside hive wall.
Such movement of the OA-saturated towel material has the possibility of increasing distribution of the oxalic acid through the hive, but in a field trial we didn’t notice any correlation between the degree of chewing and efficacy of mite reduction.
OAE Compared to OAV
I recently received an interesting data set of mite drops following repeated oxalic vaporizations from beekeeper Edward Lutman of Port Orange, Florida. His data may help to explain why we need an extended-release application method for oxalic acid (Figure 8).
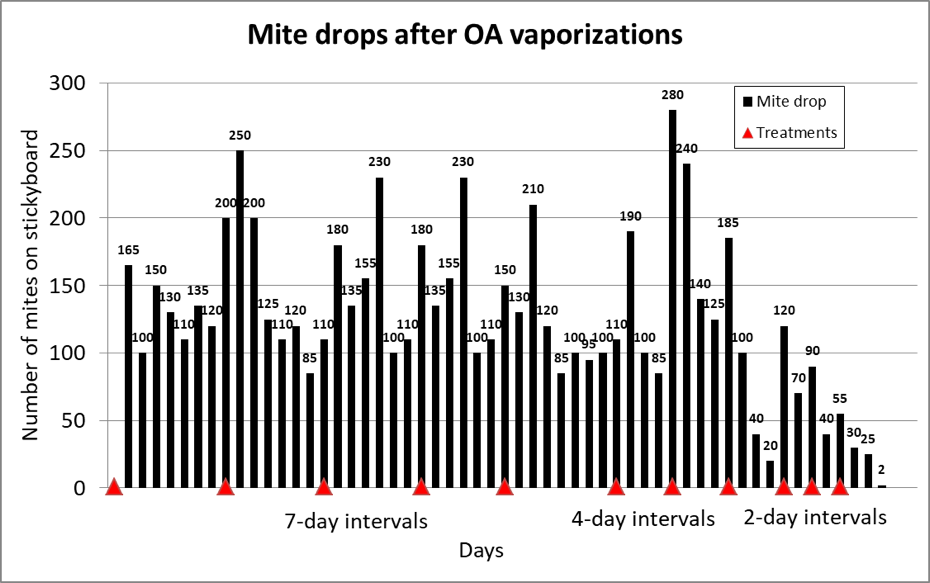
Fig. 8 Ed counted 7000 fallen mites over the course of 47 days (roughly three varroa reproductive cycles), starting after his first vaporization on August 18. He started with vaporizations (red triangles) at 7-day intervals, then shortened to 4 days apart, then to only 2 days.
Since each oxalic vapor treatment can kill over 90% of the mites on the adult bees [[5]], it’s pretty clear that when a colony is full of brood, one needs to keep hitting them with OA before they do a turnaround back into the brood. Ed got no apparent mite reduction with weekly vaporizations. It looks as though the 4-day intervals were finally working (although mite reproduction typically drops of its own late in the season). But it was the 2-day applications that finally brought the mite drop down to near zero.
Practical application: Although lots of beekeepers swear by OAV, it seems like a lot more work to me than simply inserting an OAE strip early in the season. OAE provides a continual dispersal of OA onto the bees.
OA/gly is a Long-Term Treatment
I showed previously [[6]] that the efficacy of OAE can increase with time (for up to 2½ months or more after application, dependent upon the matrix used). In 2018 I published the results of a field trial of application of various ratios of OA to glycerin (or propylene glycol) [[7]]. What I didn’t show were the results of a preliminary study that we had performed by applying each of the treatments to a single hive, and then tracking the mite drop and alcohol wash counts of those hives. Since there was only a single hive monitored for each treatment (n=1), it’s risky to draw any conclusions, but there were some obvious trends. The results may be meaningful as we attempt to determine the best way to apply the extended-release oxalic acid treatment. Let’s first take a look at the mite drop onto stickyboards following application of 18 g of OA on shop towels, with various amounts of glycerin or propylene glycol carrier, at two different saturation levels (Figure 9).
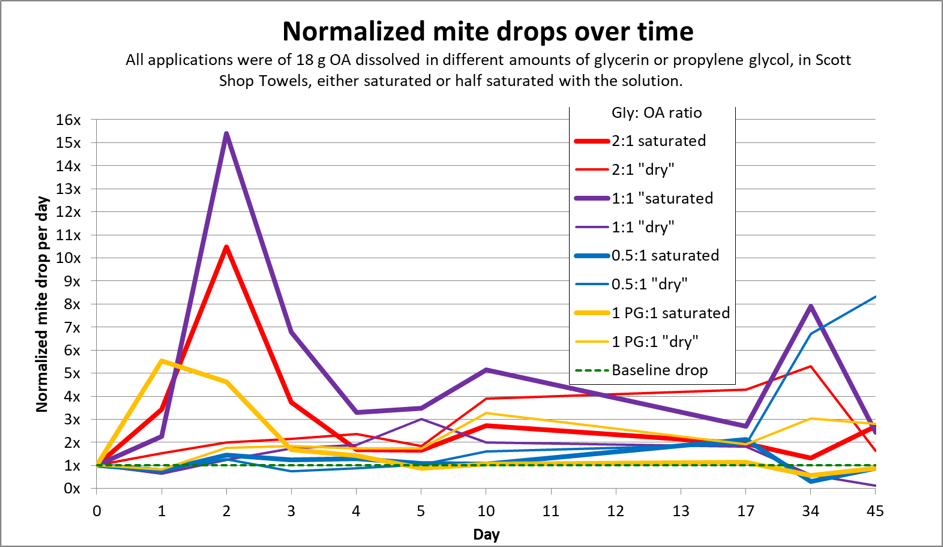
Fig. 9 For all OA:gly ratios, mite drops went way up (up to 15X) over the first few days, and then continued to stay above the baseline level (green dotted line) for some time. Note that the greatest increases in mite drop occurred in the hives given saturated (as opposed to half-saturated) towels.
With so many mites dropping , it would be reasonable to assume that the infestation rate of mites on the worker bees would also quickly drop. But counterintuitively, that was not the case (Figure 10).
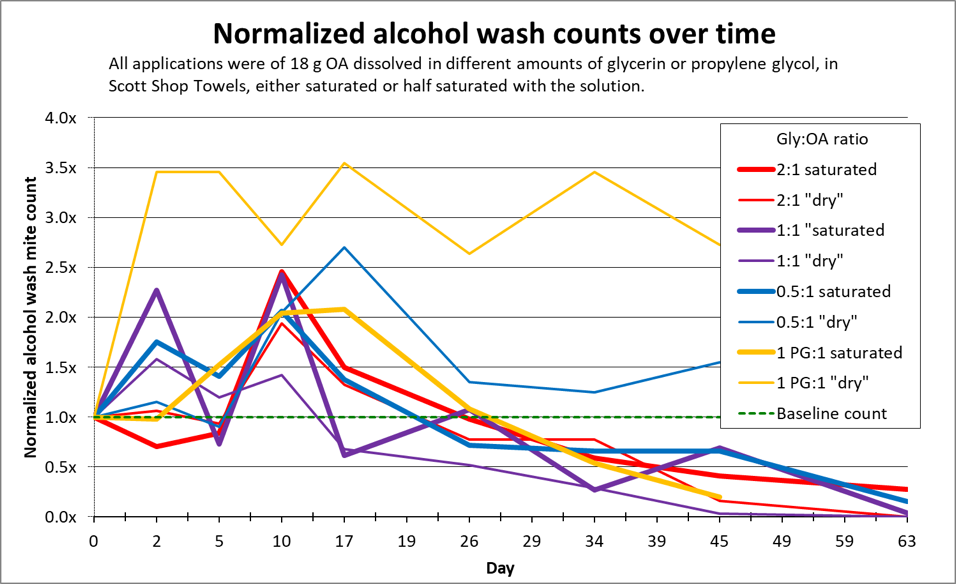
Fig. 10 Despite the high drop of mites from the bees, the infestation rate of the workers actually went up for nearly a month for most treatments (compared to the green baseline). What the heck?
This puzzling and unexpected phenomenon was consistent across the tested formulations, and thus has some very strong implications:
- Mite wash counts in the first month may underestimate the actual efficacy of OAE, and
- We need to figure out why the mite wash counts go up instead of down.
I racked my brain on this one, and could only come up with one explanatory hypothesis. And then on Zoom, I had the chance to ask a group of very smart beekeepers from Berkeley, California for their ideas for an explanation. After a few seconds, professional statistician Jim Veitch stated, “The treatment seems to be suppressing the mites from reentering brood cells.” Aha, I said — that’s exactly what I came up with.
Practical application: When OAE is applied on a matrix with lots of glycerin on the surface, it quickly gets dispersed onto the bees, and some of the “phoretic” mites quickly die. But they may be quickly replaced by emerging mites that do not drop off of the bees. Could it be that those mites, due to the treatment, do not reenter brood cells, and eventually die without reproducing? This brings me to Varroa Control Concept #1:
Varroa Control Concept #1: You don’t need to kill a single mite in order to completely control varroa. All that you (or the bees) need to do is to cut the mites’ rate of reproductive success in half, and they will slowly dwindle away.
And this may be exactly what OAE might be doing. If this is one of its modes of action, it would explain the above graphs, and why I’ve obtained much better efficacy in apiaries in which there is no outside mite immigration into the hives. It may also explain why some who have tested the method concluded that the efficacy was poor. My question then is, whether oxalic acid in glycerin is best used as a short-term treatment (with possible adverse effects upon the bees), or as a long-term treatment, applied when mite levels are still low.
Practical application: Extended-release OA/gly may be best used as a proactive treatment — before mite counts climb. It does not reduce the infestation rate in the short term as quickly as do formic acid, hops beta acids, oxalic dribble or vaporization, or thymol (I don’t have data for Apivar), but can surpass their efficacy in the long term. If approved by EPA, OAE may allow us to apply treatment when we put our honey supers on, and enjoy relatively mite-free colonies during the flow and into autumn. But it may not be able to deal with high rates of mite immigration.
Safety
Over the past several years, I’ve dribbled many thousands of hives with OA. And I’ve applied thousands of OA/gly towels and sponges. I’ve also used oxalic acid vaporizers on a number of hives.
The collective experience of me and my crew is that the application of OA by saturated pad or dribble is of low risk to the applicator — far safer than spraying, fogging, or vaporization. And application by pads made with the 1:1 ratio is the safest (and easiest) of all.
As far as mixing, over the past few years I’ve mixed over 300 lbs. of OA dihydrate with water, sugar syrup, glycerin and glycerin syrup, or other solvents, often with heating involved, and find that with reasonable care and a pair of safety glasses, it’s no more dangerous than handling any number of household cleaning products (such as lye, or oven or toilet bowl cleaners).
The heating of the 1:1 formula does increase the chance of accident slightly, but is not nearly as dangerous as cooking French fries. So long as one wears eye protection, hot OA/gly solution is not even as dangerous as spilling hot coffee on yourself (since coffee is generally heated to a higher temp). If the hot acid gets on your skin, it can be easily rinsed off with no harm — far safer than with formic acid, or hot fat from a French fryer. And OA residues are easily neutralized with a solution of baking soda (10 heaping tablespoons per gallon of water).
So far I prefer using the 1:1 w:w ratio of OA to glycerin, which does require heating. However, no heating is required at all for dissolving OA into glycerin at the 1:2 w:v concentration — it will dissolve completely at room temperature (it does take several hours. but requires minimal stirring).
So I’m hoping that EPA will approve the additional, and safer, application method for OA to the existing label.
Questions Still to Answer
Is there a better delivery matrix than the shop towels, cardboard, or sponges?
I’ve scoured the suppliers of absorbent materials, and have started testing them (Figure 11).

Fig. 11 A small test of five different matrices, weighed before and after a few weeks in a hive. I’m checking for OA weight loss, propolization, and chewing.
I now have on hand ten different cellulose or synthetic absorbent matrices that look promising. What’s likely the most important test will be to measure how much OA actually gets onto the bees’ bodies. I’ve developed a method to measure the oxalic residues on a bee, tested it in the field, and plan to use it next spring to track OA distribution in the hive after various application methods of OAE, comparing residue levels to those obtained by dribble and vaporization (Figure 12).
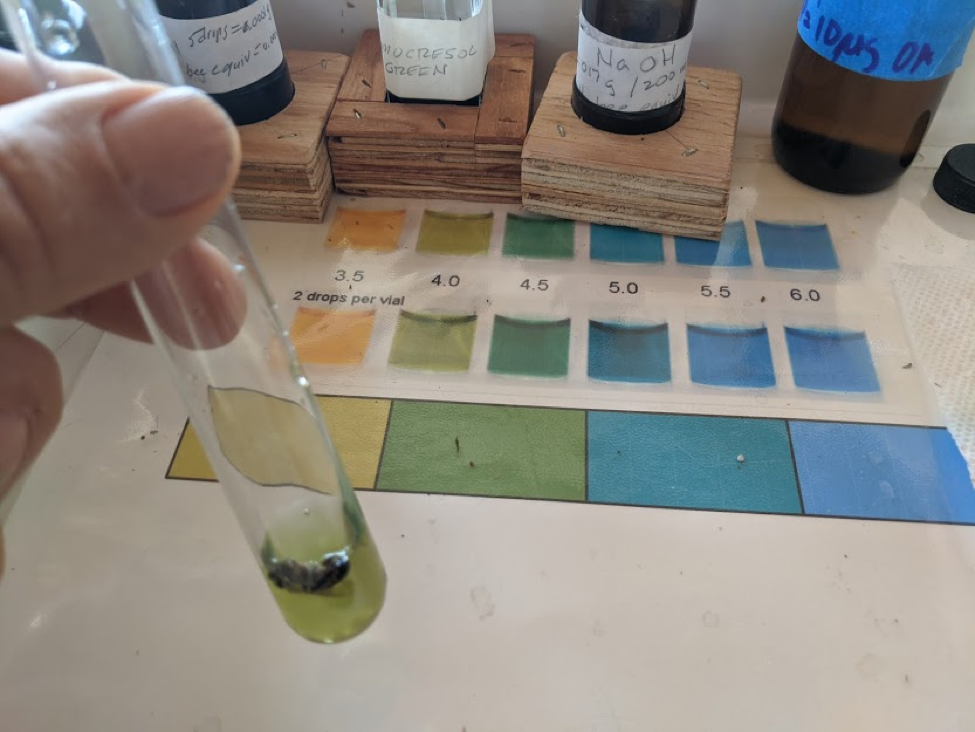
Fig. 12 By titration, I can quantify the amount of oxalic acid on a bee’s body down to micrograms. I’ve now got the method dialed in, and hope to learn a lot about oxalic distribution in the hive following various application methods.
What is the best time of year to apply OAE?
I’ve only tested it during the summer, and it appears to work best if applied while mite levels are still low. Application in June may control varroa until late summer or early fall. I haven’t tested it enough during winter to say anything, but have heard of yet-unpublished research that found that it worked well (and we’re testing winter application as I type these words).
Until then …
The Label is the Law
OK, OAE looks extremely promising. But this application method is not yet approved by the EPA. So unless you have a valid research authorization, it’s not yet legal to use for mite control.
Progress Toward Registration
As you may imagine, I continually get asked by beekeepers, “How soon will we be legally able to apply OA by the extended-release method?” This will require getting the EPA to modify the label for the registration of oxalic acid as a miticide. A petition has already been submitted to amend the USDA National Organic Program’s National List of Allowed and Prohibited Substances to include oxalic acid (including OAE) for varroa mite control [[8]].
There are actually three modifications to the “Application Directions” section of the label that would greatly benefit beekeepers:
- To add an additional application method (“Extended-Release Method”) that involves dissolving OA in glycerin, and then applying it in an absorptive matrix into the brood chamber.
- To allow the application of oxalic acid by solution, vaporization, or extended-release while honey to be harvested is on the hive.
- To allow the use of glycerin as the adjuvant for the “Solution Method” (the dribble, which currently specifies using sugar as the adjuvant).
The proposal for, and supportive data for, such modifications to the label must come from the Registrant of the product — the USDA. The USDA lab in charge of development of varroa control products is the Beltsville Lab, currently in transition as far as its Research Leader. I’ve been collaborating with Dr. Jay Evans in study design and by sharing my research findings on OAE. But since USDA is the Registrant, I’m not allowed to ask questions directly to EPA regarding the progress of modifying the label.
Q & A with Dr. Jay Evans
Dr. Evans is strongly committed to working toward getting this application method approved, and we have been in much discussion regarding ways to overcome the objections raised by some in the regulatory process. But since it’s not my place to speak for the USDA, I asked Dr. Evans to update us on the progress toward registration, as well as any hurdles involved. I presented him with a list of questions frequently asked of me by beekeepers, and asked him to answer them to the best of his knowledge.
Q: What are the steps involved in adding the proposed modifications to the label?
A: Thank you for the continued dialogue, Randy. As you know, we began these discussions in January 2017 and I respect your diligence as always. It has been a learning process for all of us and you have engaged the very top of the EPA decision tree as well as the USDA regulators who helped bring legal oxalic acid products to market in 2014. Everyone in this process is keen for safe, legal bee medicines, especially against varroa. I am a small bit in this, and will try to convey personal perspectives here. I do not claim to represent the entire regulatory chain. New or modified varroacide labels involve three branches of USDA, along with EPA, potential registrants and licensees, and of course stakeholders.
Q: What sorts of hurdles or concerns about registration are you experiencing?
A: On a practical side there have been concerns with identifying a consistently effective formulation and delivery vehicle. You and others have done extensive work to perfect the options but a simple, “universal” method is always better for assessing risk and efficacy. There are some concerns with at-home preparation of this (and any) deployed pesticide that do have to be addressed.
Q: What is the current status of ARS’s progress toward submitting the required paperwork to the EPA?
A: ARS scientists (primarily Dr. Steven Cook in our Lab) eagerly read data from quality OA-gly field trials from you, academic groups, and potential industry sponsors/licensees. We have submitted (favorable) data on residues following OA-gly treatments for an earlier version of the technique and will likely repeat these assays for the current, more effective delivery systems.
Q: Can you detail ARS’s specific plans moving forward toward getting this application method approved?
A: Bee advocates in the USDA Office of the Secretary, with USDA-ARS, USDA-APHIS, and EPA, are weighing all the options to move this and other varroacides forward. ARS is always willing to help gather evidence for efficacy and environmental risk for bee treatments and will continue in that role. As above, we have one scientist working almost exclusively on mite treatments and a number of others in our group pitching in. This is spread across OA-gly and other varroa treatments.
Q: A recent press release said: “Agricultural Research Service (ARS) entomologist Steven Cook will be leading a $1 million funded international consortium of scientists to seek new controls for Varroa mites, honey bees’ number one problem.” What portion of that $1 million is going towards OA/gly research?
A: Steve and a team from nine institutions (plus the Honey Bee Health Coalition) brainstormed for a year and targeted over ten candidates from industry and other sources. Two members of the team (Jennifer Berry at University of Georgia and Geoff Williams at Auburn University) used the funds devoted to their groups to partially offset the expenses of multiple OA-gly field trials in the southeastern U.S. Other group members are testing different candidates in the lab and field.
Q: How soon can we expect this application method to be legal for beekeepers to use? I realize that you can’t predict the future, but is there any expected time line?
A: I would be wrong to even guess.
Q: What can we beekeepers, either individually or through our associations, do to support and expedite the USDA’s registration of the extended-release application method? Would letters of support or petitions help?
A: Scientists and regulators appreciate polite, if frustrated, discourse, and do want to know what is driving and what is frustrating beekeepers. I don’t feel qualified to say whether this will move things differently or more swiftly in this case. There will be a group document in the next few months for would-be registrants, applied scientists such as yourself, and stakeholders to describe the most effective routes for proposing, sponsoring, registering and licensing new bee products. Elizabeth Hill in USDA is spearheading this and has great experience in bee science and regulation. This will be a first-ever roadmap given current bee-related regulatory policy and will be helpful for all of us.
Closing Thoughts
There are already companies in the process of registering OAE products. My fear is that if we don’t get it added to the label as a generic “approved application method” before EPA approves a commercial product, that we beekeepers will be stuck with only one or two commercial products to use, rather than being able to cheaply make our own (using, of course, a registered bulk oxalic acid). I hate for us beekeepers to succumb to the temptation of being pesticide scofflaws. If our industry steps up to the plate and communicates our concerns to the ARS and EPA, we may have a new way to control varroa legally, safely, inexpensively, and without contaminating our combs and honey.
Updates
I’ve had a lot of questions about extended-release oxalic acid (OAE). My covering of my experiments is informational only — this treatment is not yet approved in the U.S., and I am not in any way promoting its application. However, for those legitimate researchers with valid authorizations, below are some details of my materials and methods.
The Aluen CAP product uses a ratio of 1 g OA to 2 mL glycerin. This formula has the advantage that no heating is necessary to dissolve the OA (although it takes several hours to dissolve), and the OA stays in solution on the strips (it doesn’t recrystallize). The upside to this formulation is that it rapidly transfers OA onto the bees. The downsides are that such rapid transfer can result in worker agitation and brood kill, plus the strips are really sloppy to handle, and the acid solution tends to stick to everything you touch.
We have better success with a solution of 1 g OA to 1 g glycerin, heated to not above 170 F to dissolve the OA. The solution is supersaturated, and must be poured over the strips (on edge) to be absorbed before it cools. Overnight the OA will crystallize on the strips, creating a stiffer, “drier” strip that is far less messy, easier to handle, and does not cause too rapid a dispersal of OA into the hive.
Once in the hive, the glycerin in the 1:1 formulation absorbs moisture from the air, and “wets up,” slowly dispersing the OA onto the bees as they walk over the strips.
Swedish sponge cloths worked better than shop towels (but are pricey, and some brands fall apart with time; I’ll post results of other absorbent matrices in spring of 2021). “If you care” brand sponges from Amazon work well. Do not use a sponge that contains a moisturizer.
We mix 1000g OA with 1000 g glycerin in a stainless steel pan over a burner, stirring until it is clear, and watching the temperature carefully. Above 179F a chemical reaction takes place (I don’t know whether this is detrimental or not).
We cut the 7″ x 8″ sponges into halves or quarters. A full sponge absorbs 100 g of the hot mixture; the cut strips absorb proportionally.
We slowly pour the hot solution over the strips, then let them sit overnight to cool and crystallize. They retain their strength for at least 2 months.
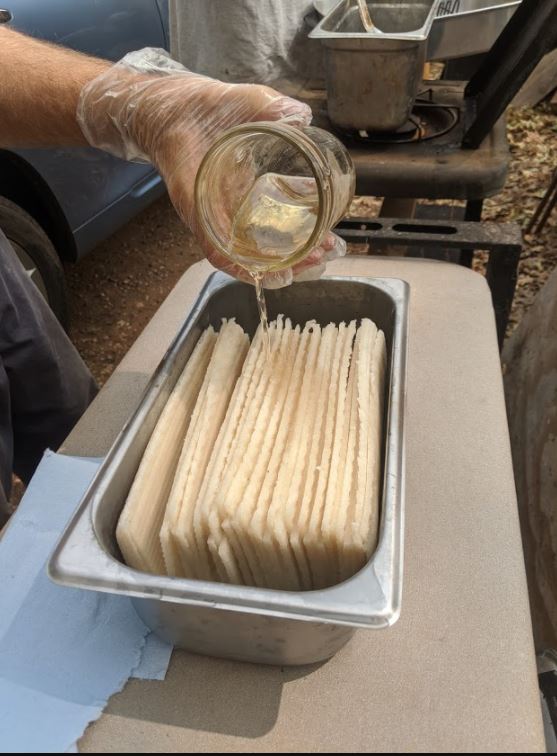
Above we’re pouring a measured amount of hot solution over half sponges. They will need to be flipped once for even absorption.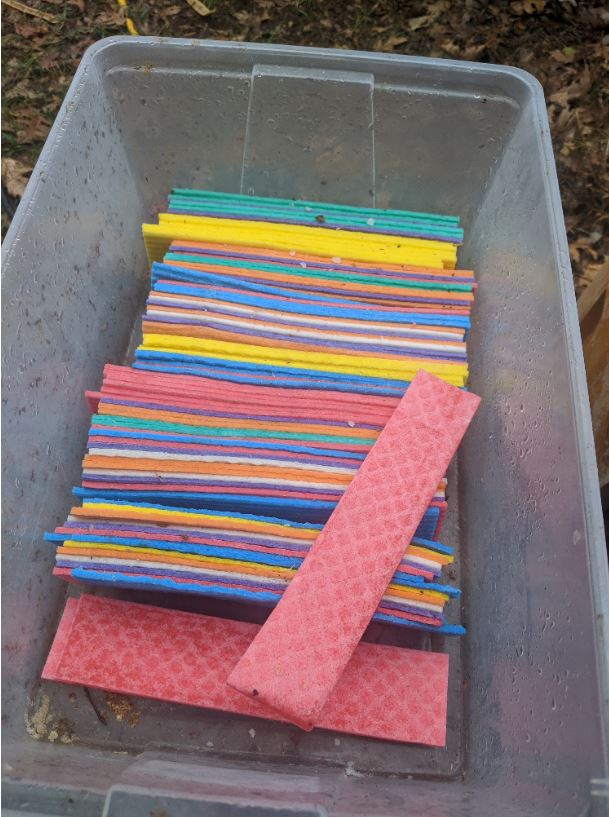
Above is a shoe tub with a single layer of quarter sponges on edge. Making them like this requires no flipping if the solution is poured evenly over the tops of the strips.
I’m still working on optimal dosing of hives. A single 1-3/4″ x 8″ strp worked well for nucs and smaller colonies, especially when applied early in the season. A large colony may require 3-4 strips when laid across the top bars (the strips must be placed between the brood chambers, so that plenty of bees are walking over their top surface). Efficacy may be better if the strips are hung over the top bars, hanging between the frames, but this takes much more labor. Hung strips work well in nucs, singles, and for top-bar hives.
We use tongs to apply the strips. Use a solution of 10 heaping Tbl of baking soda in 1 gallon of water to neutralize hands and tools.
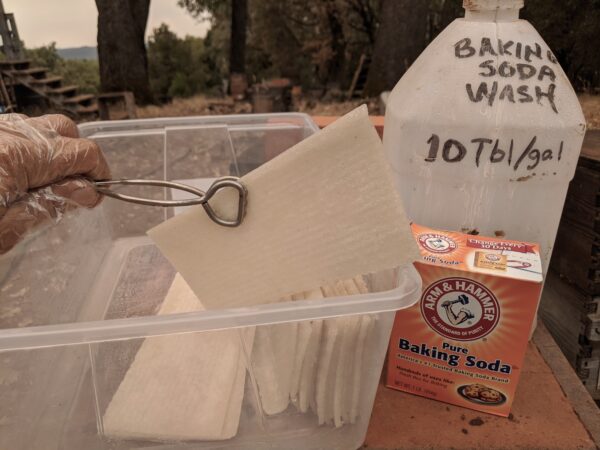
Citations
[1] Sabahi, Q, et al (2020) Evaluation of dry and wet formulations of oxalic acid, thymol, and oregano oil for varroa mite (Acari: Varroidae) control in honey bee (Hymenoptera: Apidae) colonies. Journal of Economic Entomology, XX(XX), 2020, 1–7 doi: 10.1093/jee/toaa218
[2] Higes, M, et al (1999) Negative long-term effects on bee colonies treated with oxalic acid against Varroa jacobsoni Oud. Apidologie 30(4): 289-292.
Hatjina, F & L Haristos (2005) Indirect effects of oxalic acid administered by trickling method on honey bee brood, Journal of Apicultural Research, 44(4): 172-174.
Martín Hernández, R, et al (2007) Short term negative effect of oxalic acid in Apis mellifera iberiensis. Spanish journal of Agricultural Research 4: 474-480.
Papežíková, I, et al (2017) Effect of oxalic acid on the mite Varroa destructor and its host the honey bee Apis mellifera, Journal of Apicultural Research 56(4) https://doi.org/10.1080/00218839.2017.1327937
Rademacher, E, et al (2017) Effects of oxalic acid on Apis mellifera (Hymenoptera: Apidae). Insects 8, 84; doi:10.3390/insects8030084
Terpin, B., et al (2019) A scientific note on the effect of oxalic acid on honey bee larvae. Apidologie 50, 363–368.
[3] https://scientificbeekeeping.com/extended-release-oxalic-acid-progress-report-2/
https://scientificbeekeeping.com/extended-release-oxalic-acid-progress-report-3/
[4] Maggi, M, et al (2015) A new formulation of oxalic acid for Varroa destructor control applied in Apis mellifera colonies in the presence of brood. Apidologie 47(4): 596–605.
[5] Al Toufailia, H, et al (2015) Towards integrated control of varroa: 2) comparing application methods and doses of oxalic acid on the mortality of phoretic Varroa destructor mites and their honey bee hosts. Journal of Apicultural Research 54(2): 108–120.
[6] Fig. 15 in Mite control while honey is on the hive, Part 2. ABJ 160(12); 1349-1356. Also the Pumpkin Patch hives.
[7] https://scientificbeekeeping.com/extended-release-oxalic-acid-progress-report-4/
[8] https://www.ams.usda.gov/sites/default/files/media/OxalicAcidTR.pdf
Mite Control While Honey is on the Hive
Part 3
First Published in ABJ January 2021
Randy Oliver
ScientificBeekeeping.com
In my two previous articles in this series, I showed the formal results of my field trial comparing summer mite treatments. We also have additional findings from other yards in which we applied extended-release OA.
A Problem with Labels
I’ve been beating myself up for incorrectly interpreting the label of Hopguard 3 (not understanding that it was permissible to re-treat during the summer). But then I attended (via Zoom) the fall meeting of the Maryland State Beekeepers Association, and had the opportunity to see Mark Dykes — the coordinator of the Bee Squad — present on his own trial of post-harvest mite treatments, including Hopguard. Mark is a well-experienced bee inspector and researcher, familiar with registration and labels, and made the point that he had applied his treatments exactly according to the label. But as had I, Mark also interpreted the Hopguard 3 label to say that only a single treatment should be applied. So now I don’t feel so bad, and have brought the issue to the attention of the manufacturer, who plans to rewrite the label.
But that wasn’t the only thing discussed — some of us needed to point out that, despite its popularity, oxalic vaporization isn’t yet approved for application during the summer. And Mark pointed out that the label for Apivar does not mention that the manufacturer recommends scraping any propolis buildup off the strips during the course of treatment [[1]].
Practical application: The label is the law, and I’m not the first to complain that many pesticide labels are lacking in clarity, difficult to interpret, or more about liability concerns than being informational.
The Effects of Formic Pro upon the Colonies
We’re legally stuck with only two treatments approved for use when honey supers are on the hive. Both of those treatments — Hopguard and formic acid — require heavy lifting if to be applied after the honey supers are in place, and Hopguard 3 would require multiple treatments. Not only that, but Formic Pro might need to be applied above its recommended temperature range (Figure 1).
Practical application: Thus my interest in extended-release oxalic acid, which could be applied prior to placing the honey supers, and used during hot weather.
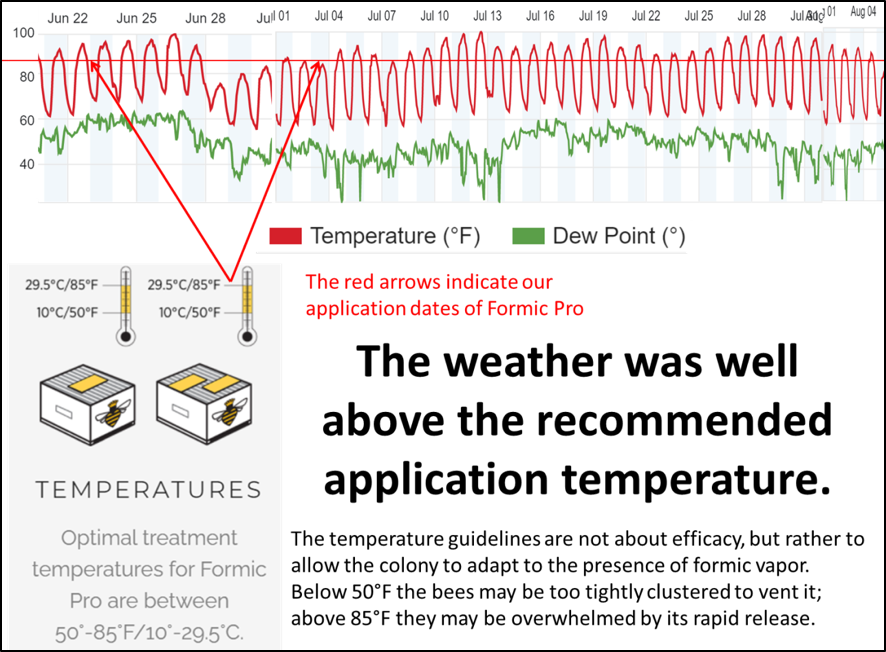
Figure 1. As you can see by the weather history graph for the trial, we applied the first application of Formic Pro at temperatures well above the recommended range — in all yards during the heat of the day.
Practical application: I added some explanatory notes from David VanderDussen to the above graphic, regarding the reason for the temperature guidelines.
Formic Pro is the latest iteration of NOD Apiary Products formic products. We’ve applied a lot of Mite Away II and Mite Away Quick Strips (MAQS) over the years, which hit you with a blast of formic vapor when first opened; Formic Pro (at least when fresh) is far more pleasant to work with. I was curious whether there was a different amount of, or a different release rate of, formic acid between MAQS and Formic Pro, so I placed two of each into a double deep hive of drawn combs (with a top and bottom board, but without bees) during low-humidity 90°F weather, weighing the strips each day (Figure 2).
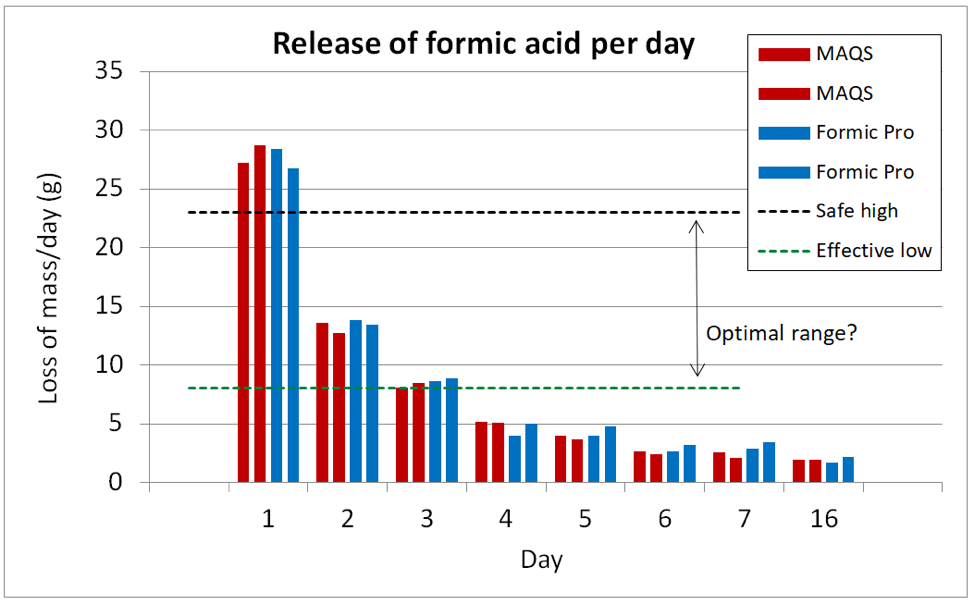
Figure 2. Weight loss over each 24-hr period. As you can see there was no difference between the two types of strips – each lost, in total, 65 g in weight (the equivalent of 100 g of 65% formic acid). This equal rate of loss surprised me, since there is far less noticeable formic odor when I open a packet of Formic Pro than with MAQS.
Regarding the above chart, evaporation would likely be faster if there were bees fanning. As far as I can tell from the literature, the optimal release range for formic acid during warm weather would be somewhere between the dotted lines (the upper line being the sustained rate that I measured for the first-generation Mite Away II pads, which were applied to the top of the hive in a rim). But that’s not to say that the long-term release of a little formic into the center of the broodnest doesn’t have an effect upon the mites.
Practical application: In order to avoid the initial impact of formic fumes, the recreational beekeeper has the option of removing the queen from the hive for the first three days of treatment, and then returning her after the main blast is over. I’ve also applied Formic Pro successfully to weak nucs in hot weather by simply pressing the hive cover down tight against a half strip (or full strip for nucs with higher mite counts) in order to slow the release of vapors (this also extends the treatment for some time). I observed next to no queen loss when treating over a hundred nucs in hot weather this manner, and obtained acceptable mite reduction.
As I reported last month, mite reduction from Formic Pro was good, but how did the colonies fare otherwise? Many of the colonies to which we applied the strips during the heat of the day responded by bearding (Figure 3).
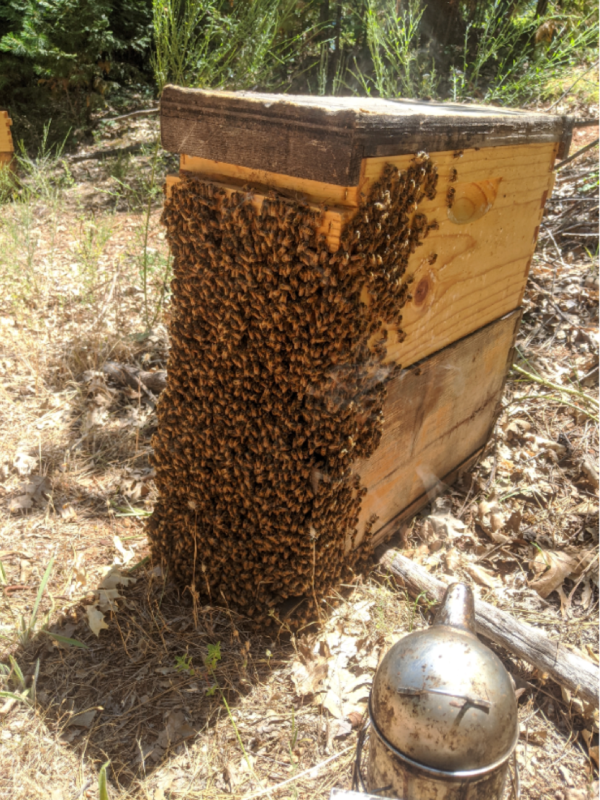
Figure 3. The bees didn’t like it, and stepped outside for a little fresh air! But they didn’t abscond or die — I’m not sure whether the low humidity was a factor. But the question is: was the disruption worth the benefit?
As I’ve observed time and again, colonies tend to recover nicely after formic treatments (Figure 4).
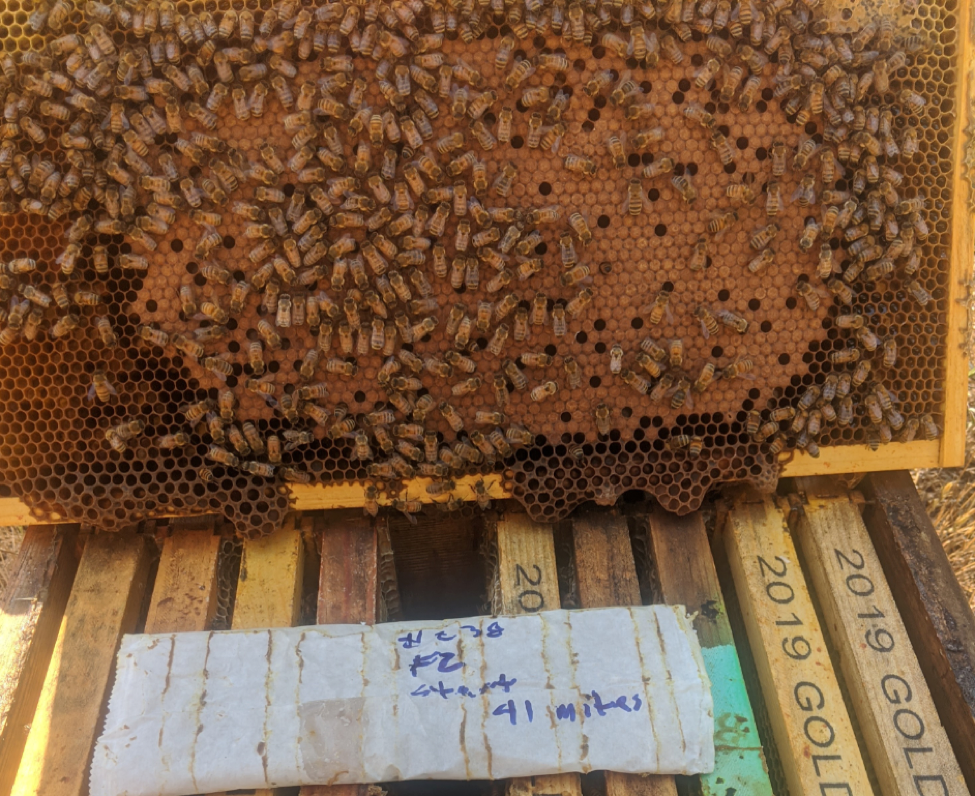
Figure 4. As has long been my experience with formic acid, the brood patterns generally look great after the queen resumes laying after treatment. This colony had a starting mite count of 41 (per half cup of bees), and received two strips of Formic Pro at the same time. This photo, taken 42 days later, shows a typical post-formic nice brood pattern.
And despite the bearding and brood break, the stronger formic-treated colonies drew foundation and filled it with honey (Figure 5) — even in some colonies that replaced their queen.
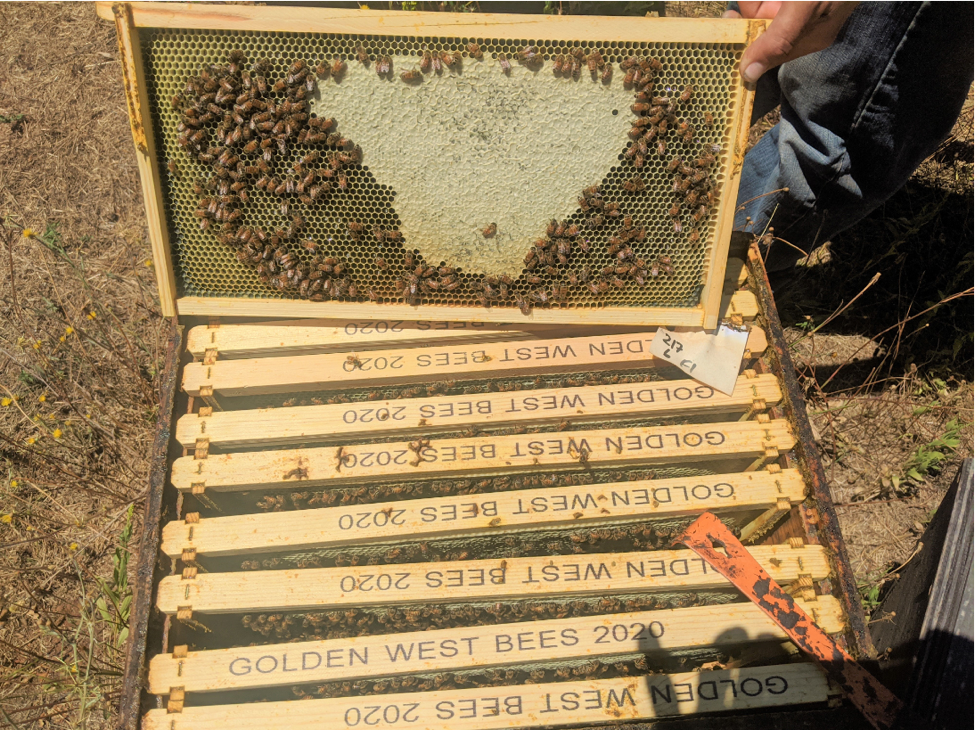
Figure 5. Despite the application of Formic Pro in hot weather, the “stronger” colonies quickly rebounded after treatment (remember that most of the colonies were only of 8-10 frame strength when we applied treatments). This one was typical, and drew out ten frames of deep foundation (placed above the single brood chamber) on the brief nectar flow, and filled them partially with honey (far better that we expected).
One of the improvements with Formic Pro was adding sawdust to the gel. Once the formic vapors have completely dissipated (after 2-3 weeks), the bees in most of our colonies chewed up and removed the spent strips (Figure 6).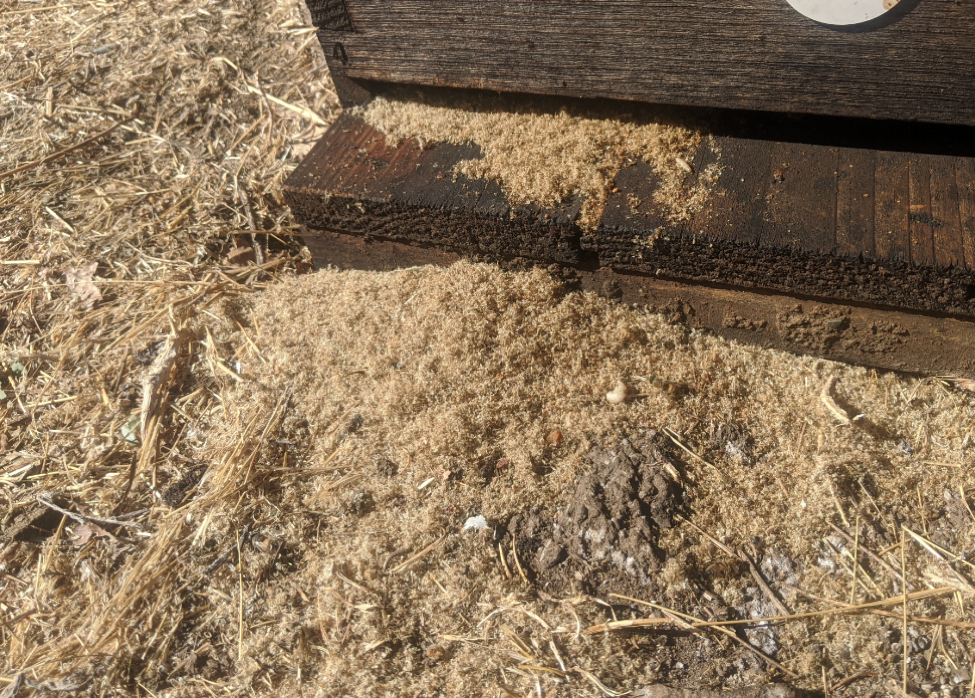
Fig. 6. We were surprised by the piles of sawdust in front of our hives. Rather than us having to scrape out and dispose of the spent strips after treatment, the bees in most hives did the job for us!
But How About the Queens?
I hear over and over about colonies going queenless due to formic acid treatment. In this trial, Formic Pro was clearly put to the “acid test” by applying it to weak colonies, with 2nd-year queens, in excessively hot weather, and applying the strips in the middle of the day (is there anything else that I could have done wrong?
But I’m still not convinced that formic vapors directly kill the queen — the strongest and most robust bee in the hive. I even ran a limited experiment last season in which I caged queens directly below formic pads, and didn’t notice a higher mortality rate for them than for the workers in the same cages (Figure 7).
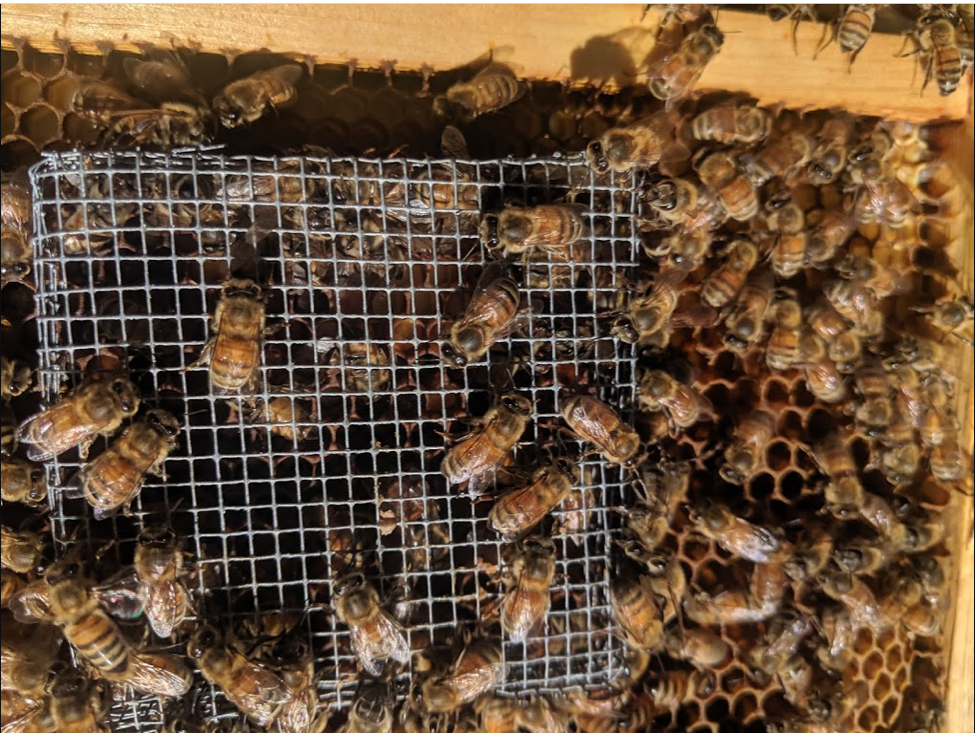
Figure 7. I’m not clear that it’s the formic fumes that actually kill the queen. I’ve placed a few cages containing queens and workers directly below formic strips, and found that the queens were no more likely to die than the workers. This is a question clearly calling for more research, since queen loss due to formic may be preventable [[2]].
All the colonies in this trial were headed by overwintered queens reared the previous spring. They’d been split into nucs after almond pollination to regrow without mite treatment. Natural supersedure of these aged queens was already taking place in some hives (most of our colonies supersede their queens in August of their second season), and many colonies started with extremely high mite levels and small cluster sizes – so we must compare any “queen loss” to the baseline loss of the Control group.
Not surprisingly, a number of the formic-treated colonies indeed replaced their queens. But what really counts is whether the colony goes hopelessly queenless. So I measured only whether the colony contained a queen exhibiting a nice laying pattern at the end of the trial (Table 1).
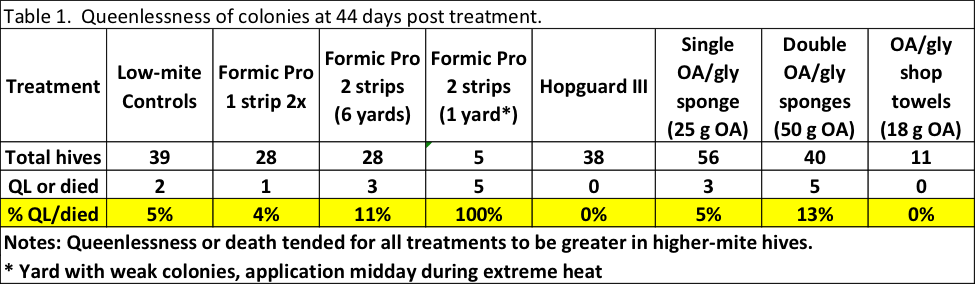
Surprisingly, the rate of queenlessness for the hives treated with a repeated application of one strip of Formic Pro had no higher a rate of queenlessness than the untreated Control group. And even most of the colonies formic-blasted with a double-strip treatment in 95°F weather managed to have a laying queen by the end of the trial.
Practical application: Although a number of colonies did indeed replace their queens during the formic treatment, by the end of the trial the vast majority of them were again queenright. The take-home is that Formic Pro is a viable option for mite treatment even if the weather is hot (at least under low humidity), especially with the one-strip-at-a-time application method.
That said, let’s return to my permitted experimentation with the as-yet-not-approved extended-release application method for oxalic acid. OK, we clearly need an acronym — how about EROA?
Other Findings
My Pesticide Research Authorization allowed me to treat up to 600 hives with EROA, so we applied it to hives in various yards in the foothills, to some going to the high country, and others that went to pollination. We learned a lot!
The High Country Yards
We again supplied hives for research projects being performed by two different grad students in the alpine meadows of the Sierra Nevada (at around 6500 foot elevation)(Fig. 8).

Figure 8. When the vegetation dries up in the foothills, the bloom is just beginning in the High Sierra. This gave me a chance to see how an EROA treatment, applied well before the honey flow, would perform over an extended time period.
At the high-elevation yards, the colonies experienced much better conditions:
- They grew in strength, and reared tons of drones (favorable for mite reproduction),
- Most colonies put on a decent honey crop, and
- There were no other hives in surrounding landscape for mite drift from.
We placed hives in three well-separated locations in mid-June, took mite wash counts from all hives, and applied a single 25-g EROA sponge to the low-mite hives, or two sponges to the high-mite hives. We took counts again when we brought the hives back home in mid-August or early September (Figs. 9 and 10).

Fig. 9. In this yard, a single EROA sponge gave good mite control over a two-month period.
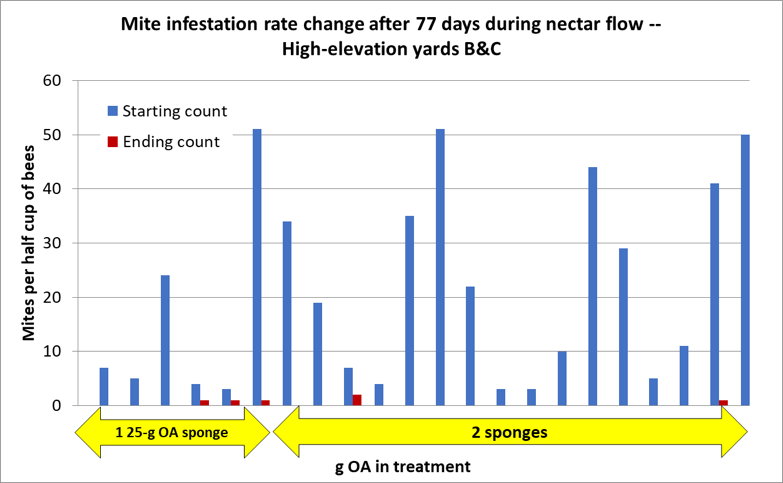
Fig. 10. Note the sky-high starting counts of a number of the hives in these yards, compared to their ending counts two and a half months later. As Eric and I were washing samples from these hives, he said, “Dad, I’ve never seen so many zeroes in a row!”
Practical question: Due to the large amount of drone rearing, varroa certainly had the opportunity to greatly increase. Was it the lack of mite immigration from other hives that allowed for such good results?
Other Yards in the Foothills
We nuc up our entire operation each spring, and give them an oxalic dribble at Day 18-19 after makeup [[3]], so in general they start with fairly low mite levels. But by June mite counts start to climb. This season was terrible for nuc buildup (due to weather), so we still had a lot of weak colonies in early June that called for mite management. We took mite washes from all the hives, and treated those not in honey production with a quarter sponge containing 12.5 g of OA (Figures 11 & 12).
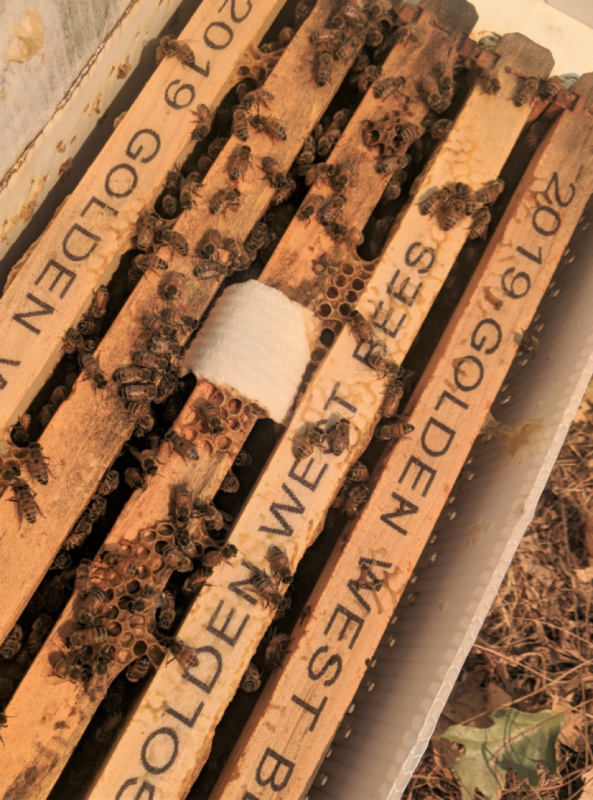
Fig. 11. In the colonies still in nuc boxes (this one was weak due to having requeened itself), we hung an EROA strip over a top bar.

Fig. 12. In nucs with a box above, we placed a 12.5-g EROA sponge on the top bars between the two boxes.
Practical application: The efficacy of EROA is very much dependent upon bees coming in contact with the surface of the matrix, so strips placed directly under a lid don’t do much.
We performed follow-up mite washes on the hives in each yard that had previously shown high mite counts (Figure 13).
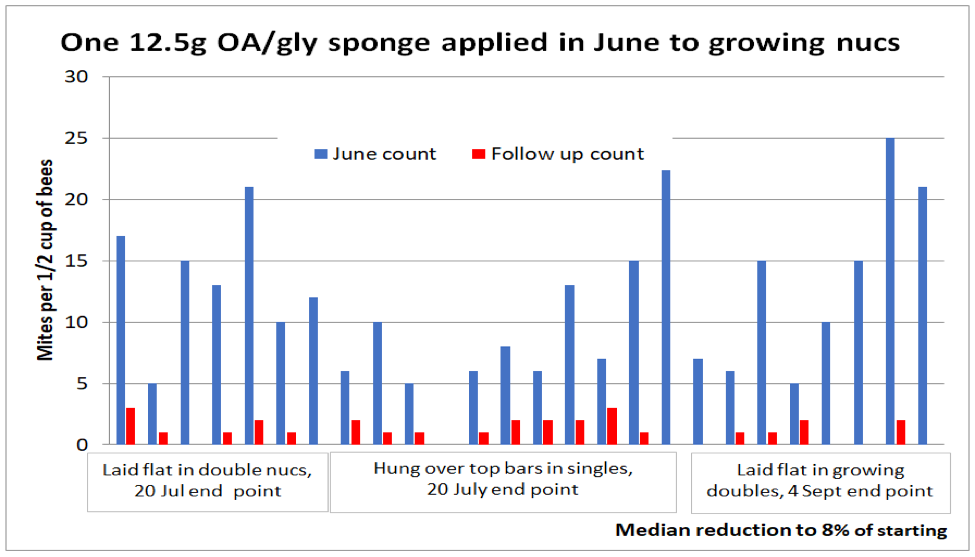
Fig. 13. There was great reduction in mite counts across the board by a relatively small EROA treatment. Note that the counts in the right-hand group were taken in September — three months after application of the treatment.
Practical application: Even a low-dose OA/gly treatment applied early in the season greatly reduced mite levels throughout the summer (under California conditions).
The Label is the Law
Hold your horses! The extended-release application method is not yet approved by the EPA. Until then, it is not legal to apply OA by this method for mite control, and I do not in any way promote beekeepers doing so.
Still More to Come…
Next month I’ll take a deeper dive into extended-release oxalic acid, including findings by others, a discussion of potential adverse effects, and a possible mode of action other than direct kill.
Notes and Citations
[1] https://www.dadant.com/wp-content/uploads/2016/12/Apivar-Instructions-USA-2015.pdf
[2] This question was brought up clear back in 2006 by Dr. Jim Amrine, who mixed Honey-B-Healthy with the formic acid to minimize queen loss. To my great surprise, there has been little follow up on the method. Amrine, JW & R Noel (2006) Formic acid fumigator for controlling varroa mites in honey bee hives. International J. Acarology 32(2): 115-124.
[3] https://scientificbeekeeping.com/simple-early-treatment-of-nucs-against-varroa/
Mite Control While Honey is on the Hive
Part 2
First Published in ABJ December 2020
Randy Oliver
ScientificBeekeeping.com
Last month I covered the setup of my field trial of summertime mite treatments, including experimental extended-release oxalic acid in glycerin. I’ll now share the results.
The Results and Discussion
Due to space limitations, it’s going to take me at least two articles to share the results of this and related field trials, so I’ll combine the results and discussion sections, eventually with a final wrap up of what I’ve learned to date.
I’m going to show you at least two graphs of the results for each treatment group. Initial mite counts were taken on June 16-17; due to climbing temperatures we delayed applying the treatments, but once a week had passed, I decided that we needed to treat on June 23 despite the heat. Midpoint counts were taken on July 12-13 (19 days after application of the first treatment, 26 days after the initial counts). We took end point counts 23 days later on August 4-5 (49 days after taking the initial mite counts; 42 days after application of the treatments).
For the midpoint assessment, I didn’t want to take mite washes of all 260+ hives, so I selected what I considered to be “representative” hives from each treatment group at each of the seven test apiaries (“representative’ hives being those with bees in both brood chambers, as well as moderate to high starting mite counts).
Notes: For each treatment group I will first show a line graph of the mite counts for only those hives chosen for midpoint assessments, followed by a column graph of the final results for all hives in the treatment group. Explanations for each graph type are at Figs. 1 & 2. For this entire series of articles, all “counts” are for the number of mites washed from a sample of a half cup of bees (roughly 315 workers) shaken from a frame adjacent to brood (generally from the upper chamber).
The Untreated Control Group
The Control hives were intentionally colonies with starting mite counts in the 10-20 range.
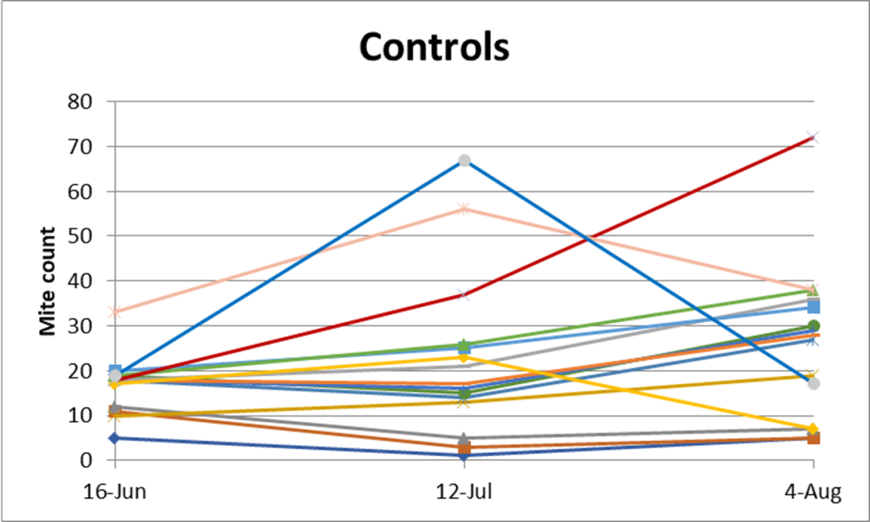
Fig. 1. Instead of more-appropriate step graphs, I’m showing line graphs (all to the same scale), since they make it easier to visualize the changes in mite counts for a number of individual hives. So keep in mind that the lines represent only the overall change in mite infestation rate from on data point to the next, not what happened in between. In most of the chosen Control hives, the mite infestation rates did not change much during the first half of the trial, but then climbed higher during the last half. Remember that the counts for these graphs are from only a few of the hives receiving each treatment, not the entire treatment group (which is shown below).
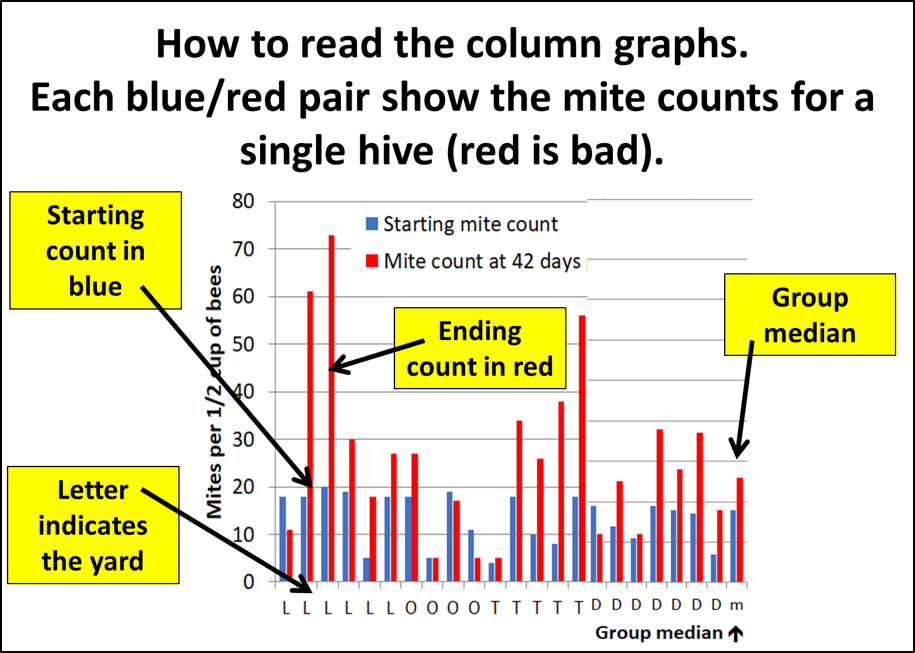
Fig. 2. Rather than throwing a bunch of boxplots, ranges, statistics, and error bars at you, I’ll give you the straight results for every colony, which allows you to visually pick out patterns for yourself – such as the degree of variability, outliers, and yard effect. All the graphs are to the same scale for easy comparison.

Fig. 3 As you can see, there’s a lot of red in the Control group – indicating that mite counts went up – to slightly over 1½ times their starting counts. The group median value means that half the counts went up more, half less (as opposed to means, which get skewed by outliers). You can see why I limited the Control group to fairly low starting counts, since several of them really shot up over the course of 49 days (although just to confuse things, a few went down).
Side note: mite counts can go to shocking levels if a treatment fails – our highest ending count in this field trial was a staggering 274 mites on a half cup sample of bees (not shown, and not in the Control group).
Practical application: Since the mite counts in the Control group went up by a median 158%, this expected increase allows us to later estimate the efficacy of each treatment by comparing its group’s change to that of the Control group.
Formic Pro – 1 strip, repeated after 10 days
There are two options for application of this formic acid vapor treatment: (1) placing two strips at once, or (2) applying only one strip, then another after 10 days. We tested both methods. Unfortunately, the weather heated up after taking our initial mite wash counts, but as with many beekeepers suffering from a warming climate, we still had to deal with mites. The daytime temperatures on the day of application were in the 90’sF — well above the recommended temperature. So I decided that this was a good opportunity to see what would happen if we applied Formic Pro under hot, low-humidity conditions.

Fig. 4 The repeated single-strip treatment with Formic Pro greatly reduced most of the mite counts. Encouragingly, there was little mite increase after treatment. Again, the lines do not reflect the immediate impacts of treatment, only the results at two time points well afterwards.

Fig. 5 Mite control for the repeated single strip option was quite good, except for in the “L” yard, in which the lack of reduction was in stark contrast to that in the rest of the yards (and in contrast to the excellent control in the same yard when two strips were applied on the same day at the same time – Fig. 7). Even including those hives in which the mite count went up, the overall median reduction in mite counts for all hives in the test group was to only 17% of the starting count – very impressive!
Practical application: The rationale for repeating the treatment at 10 days is that it kills mites that have emerged from the brood.
Scientific note: You can see why it’s important to replicate any trial in various yards and under different conditions. What I’ve learned from field trials is to expect the unexpected, that there will be anomalies and outliers, location and weather can be important, stuff (such as errors) happens, and that there is always large colony-to-colony variability that may make it difficult to tease out the signal from the noise.
The poor performance of Formic Pro in yard “L” was clearly an anomaly. I have no explanation, but suspect that it may be related to the fact that it was the first yard to which treatments were applied, and I had conscripted a small group of visiting beekeepers as helpers to apply them – could it have been some detail during their learning curve?
Practical application: It’s all in the details. Why would a treatment work poorly in the first yard, but so well in next six? I strongly suspect that we can’t blame it on the product, but perhaps upon some detail of how the strips were handled prior to placement. I clearly need to repeat this particular application method to figure it out.
Formic Pro – 2 strips applied at once, during hot weather
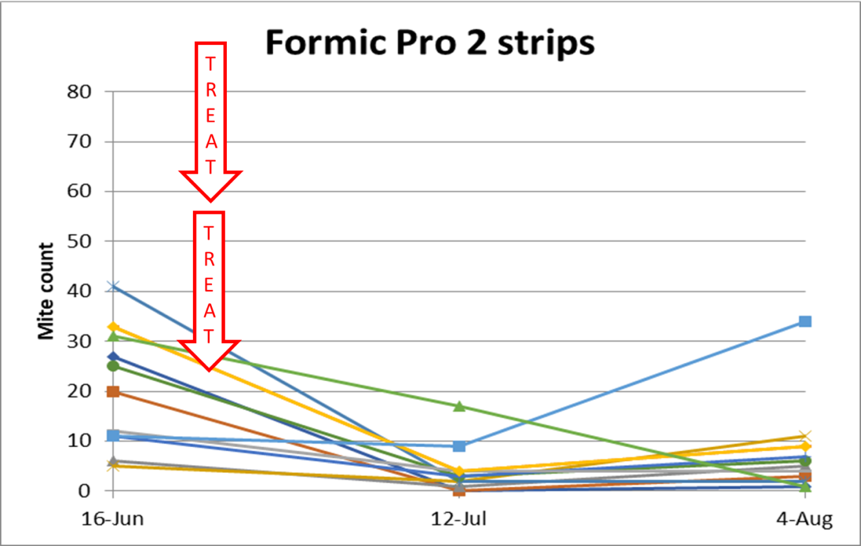
Figure 6. I expected that the intense two-strip application would result in greater mite kill under the cappings, and thus better efficacy. That did not appear to be the case.
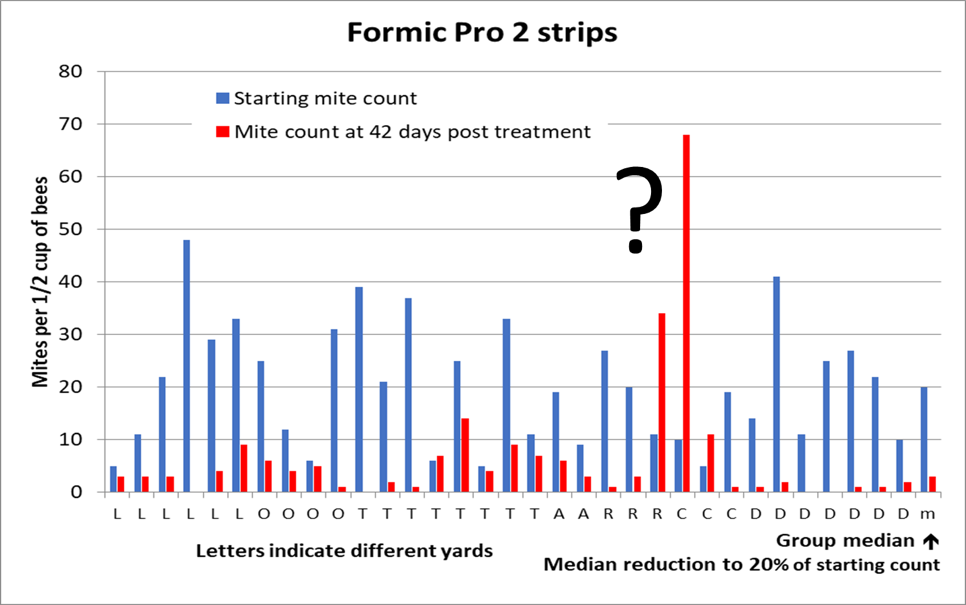
Fig. 7 Two strips of Formic Pro gave good mite control in all but 2 hives out of 33 – for a median reduction to only 20% of the starting count. Why the failure in those two hives I have no idea.
Note: In these column graphs, if there is no red visible immediately to the right of a blue starting count column, that means that the ending mite count was zero. The median reduction figures may be misleading, since for both Formic Pro treatment groups the median starting and ending mite counts happened to be the same – 20 mites to start, 3 mites at the end.
I had two questions about Formic Pro besides its efficacy: (1) do colonies recover more quickly from the 2-strip treatment, since it causes only a single brood break, and (2) is the repeated 1-strip application easier on the queens? Due to space limitations, I’ll need to leave the answers ‘til my next article.
Those Danged Outliers
In Figure 7 there are two outliers – colonies in which mite counts after treatment went way up, instead of down. This occurs, regardless of treatment type, in nearly every large apiary or experiment, for unknown reasons. We just need to deal with that fact.
Hopguard 3
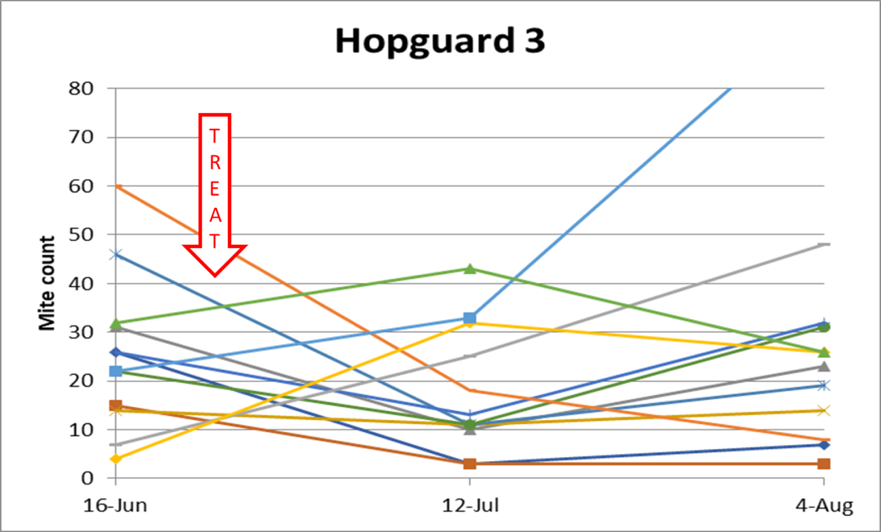
Fig. 8. Hopguard 3 gave a quick, but inconsistent, knockdown of the mites. Unfortunately, I found the label to be unclear as to whether it was recommended or permissible to repeat the application during the honey flow (as specified for fall treatment). I’ve since confirmed that it’s OK to do so. Since the midpoint results indicated substantial effect from treatment, I didn’t reapply Hopguard 3 strips to any hives. In retrospect, I wish that I had done so.
Despite the impressive mite knockdown shown in Fig. 8, it was clear by the end of the trial that a single application of Hopguard 3 was inadequate for mite control during summer. I’ve since spoken at length with Fabiana Ahumada at BetaTec in order to clear up my understanding of the label, and plan to repeat the test next season, but with repeated treatment. There is no need to show the results of this test, since because I did not apply retreatments I did not give Hopguard a fair shot.
Practical application: Due to the Hopguard’s rapid knockdown of mites, non contamination of honey, and lack of adverse effects on queens (to be shown later), I feel that it can be a viable tool for varroa control (and used it myself later in two other field trials this season). I look forward to testing it again next season.
Extended-Release Oxalic Acid in Glycerin
The main purpose for this large field trial was to compare the efficacy of extended-release OA to that of the two treatments currently registered for varroa control while honey is on the hive — Formic Pro and Hopguard. I tested three different application methods of OA/gly Let’s see how they performed.
OA/gly – 2 half Shop Towels 1:1 ratio (18 g OA in total)

Fig. 9 Similar to my findings in previous trials, there is little reduction in the mite infestation rate from OA/gly towel application during the first few weeks of treatment (despite an increased mite drop, not shown). Extended-release OA takes several weeks to attain full efficacy.
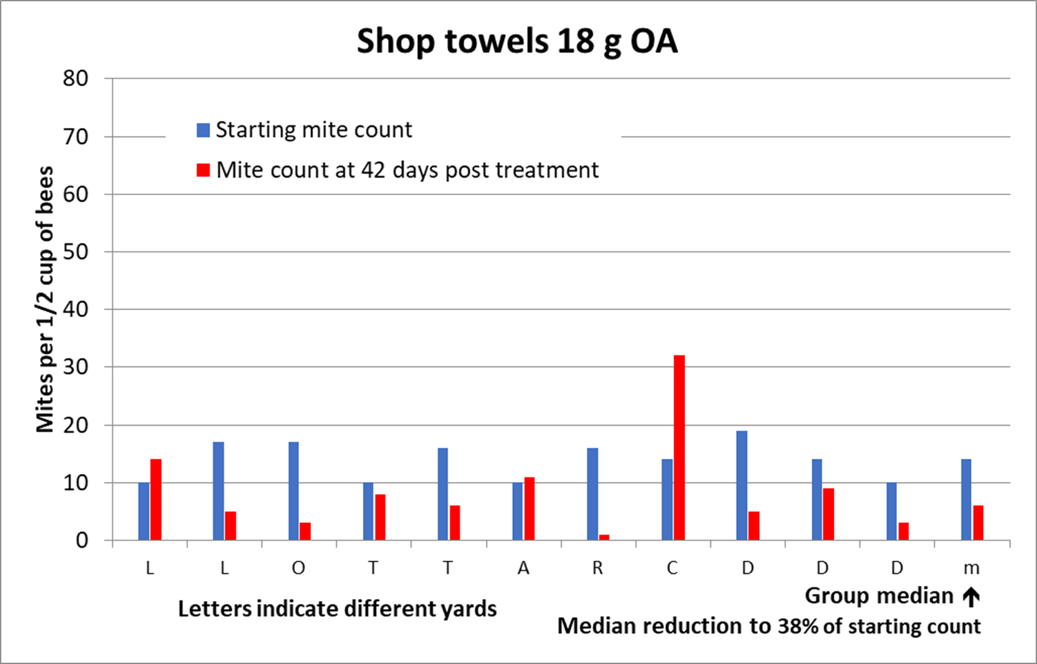
Fig. 10. For the shop towel application method I intentionally picked colonies with starting counts similar to that of the Controls for comparison in the efficacy calculation. At 42 days post application, mite counts had dropped to lackluster 38% of starting, but from previous experience I would expect them to continue to decline.
OA/gly – one 3½” x 8” cellulose sponge (25g OA in total)
What I was hoping for is that using cellulose sponges as the delivery matrix of OA/gly might help to increase efficacy in both the short and long term.
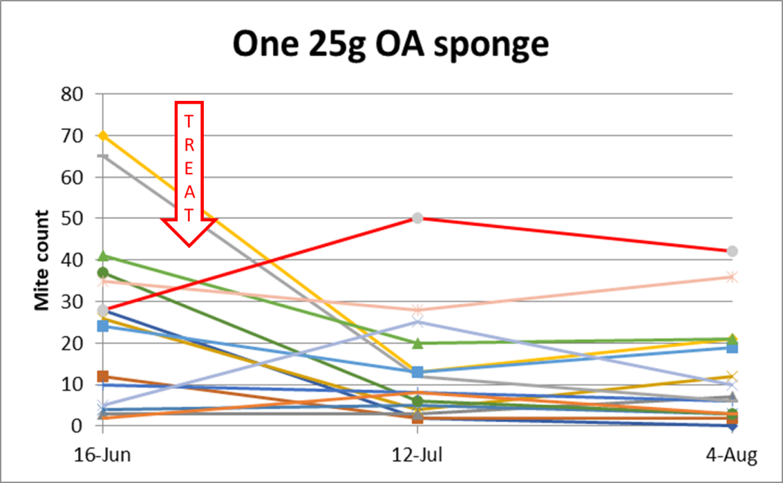
Fig. 11 The single-OA/gly sponge treatment exhibited greater initial reductions in the hives with high starting mite counts than in those with low counts (which may help to explain the poor performance of the shop towels). The reductions in mite counts above were not impressive.
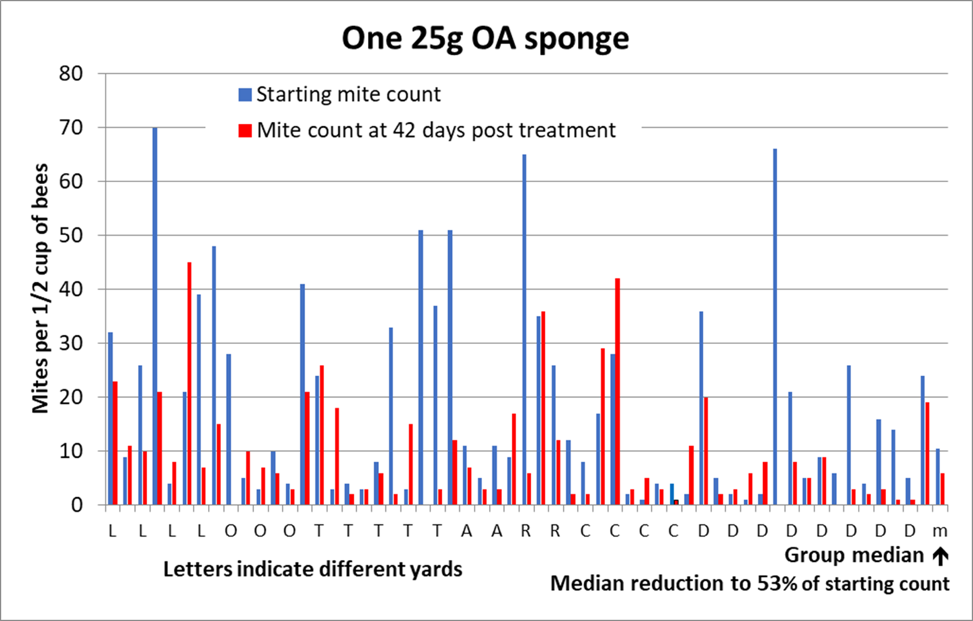
Fig. 12 The most striking observation is that the one-sponge application really brought down most of the extremely high mite counts. But for the low-mite hives, the results were not as impressive. Overall, the single sponge treatment dropped the mite counts to roughly half their starting number.
OA/gly – Two 3½” x 8” cellulose sponges (50g OA in total)
So what happens if we double the number of sponges applied?
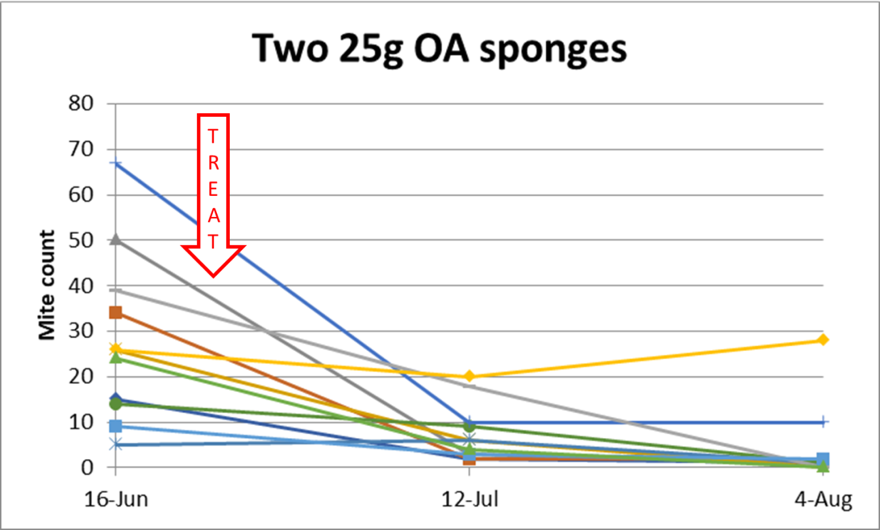
Fig. 13 Now we’re talking. Look at those ending counts! I’ll discuss why the difference later (it wasn’t due to the amount of OA).

Fig. 14 Bingo –that’s a lot of blue! Other than the few outliers, the two-sponge treatment was the best treatment of all, with the median ending counts being only a tenth of the start. Despite the average (mean) starting count for this test group being 25 mites, half the ending counts were of 2 or less – not bad.
Extended Treatment
The results from two OA sponges look really good – but had they yet achieved full efficacy? I left the sponges in a number of the hives that still exhibited appreciable mite counts (some from which I’d taken midpoint counts) until the treatment had been in the hives for 72 days, and then took mite counts again (Figure 15).
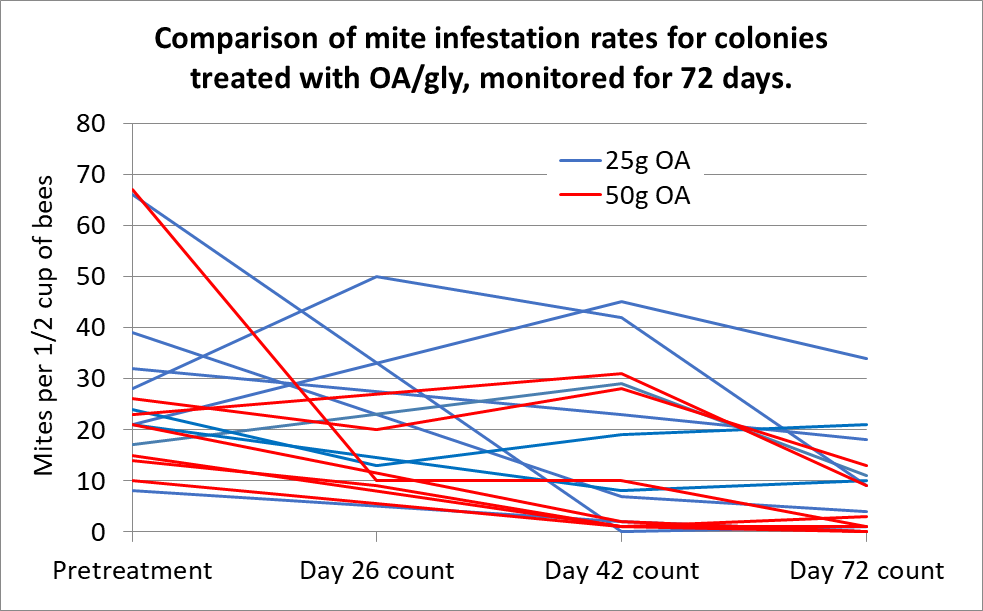
Fig. 15 Oxalic acid in glycerin is a long-term treatment, which just keeps on working when applied in two sponges – note the downward trend of the red lines over the last 30 days.
Practical application: Although the 2-sponge treatment gave decent initial mite knock down, it’s really a long-term treatment, taking some time to reach full efficacy.
Next month I’ll show more exciting data. These results are yet another step in my quest to find the best delivery method for extended-release oxalic acid – I can already tell that it’s not going to be shop towels or the sponges that I used in this trial, nor a 50-gram dose.
Efficacy Calculations
As always, a researcher can pick and choose methods for calculating efficacy of treatments. I prefer to use the Henderson-Tilton formula, since it compares the change in pest prevalence in a Treatment group to the increase in the Control group, setting the Control efficacy at zero. That said, there are different metrics that I can input into the formula. So I calculated efficacy in two ways (Table 2):
Sum of mite counts: I added up the totals for each Treatment group’s starting and ending mite counts to compare overall reduction in mites for each entire group.
Median mite counts: I calculated the median starting and ending mite counts for each Treatment group in order to get a feel for the yard “average” (the median being the midpoint).
Note: Technically, since the Control colonies started with lower mite counts than many of the Test colonies, we must take the efficacy calculations with a grain of salt (other than for the shop towels). However, it’s not the absolute values that are important, but rather the comparison of the efficacy values of the various treatments to each other.
That said, let’s look at the calculated efficacy values (Table 1).

Cautionary notes: Due to poor weather earlier in the season, the colonies in this trial were not strong – starting at about 8-10 frames of bees. So the absolute values for efficacy of treatment below may not apply to strong colonies stacked with honey supers. That said, what I was interested in was the comparative efficacy of the various treatments and application methods.
Practical application: The OA/gly two-sponge application method clearly kicks butt! But it gets even better, as you’ll see next month.
The Effect of Starting Count
Just to be sure, I also calculated efficacy values for each group to see whether there was a difference between the half of the hives in each test group with higher starting counts vs. those with the lower starting counts. There was no appreciable difference (not shown).
But then I noticed that there appeared to be a relationship between colonies in which the mite counts went up after treatment, and the starting mite level. So I plotted out scattergrams of the amount of mite increase or reduction vs. the starting mite count (Figure 16).

Fig. 16. I compared the increase in infestation rate over the 49 days by its multiple value (a multiple of 2 meaning that the mite count doubled), against the starting mite count for each hive. The green dotted line (at a multiple of 1) indicates no change, so data points below it mean that the count dropped, often to zero. Note that for all groups other than the Controls and two OA pads, that mite counts skyrocketed pretty much only in the less-than-10 count hives, despite treatment.
The above pattern seems counterintuitive – that the treatments were ineffective in the colonies with the lowest starting mite counts. I have no explanation.
Practical application: The above scattergrams validate the efficacy estimates. But they still leave me scratching my head!
The Label is the Law
Hold your horses! The extended-release application method is not yet approved by the EPA. Until then, it is not legal to apply OA by this method for mite control, and I do not in any way promote beekeepers doing so. In my next article, I’ll report upon USDA’s progress towards registration of the application method.
To Be Continued
Next month I’ll cover the effects of treatment upon colony performance and queenrightness (notably the effect of formic treatment in hot weather), as well as more results from this and other trials of OA/gly sponges that we ran this summer, plus some previous yet-unpublished research of mine on extended-release OA.
A teaser: although the two sponges held 50 g of OA between them, only a fraction of that actually got released into the hives – at the end of the treatment period, most of the OA still remained in the sponges, never have gotten distributed to a bee or mite. So don’t get hung up on the 50-g dose, since it doesn’t take much OA, properly delivered, to control varroa.
Practical application: it’s not about how much OA is applied in the delivery matrix; it’s only the amount of OA that gets to the mites that makes any difference. Stay tuned…
This is Beekeeper-funded Research
This field trial was tedious (we took and counted 589 mite washes in all, many with counts well above 50 mites), costly in materials and labor, and involved the loss of many colonies due to failure of treatment. My work is supported entirely by donations from beekeepers, which allows me independence from any company or restrictions by administrators – I work for the benefit of beekeepers alone. You can support our research by donating at ScientificBeekeeping.com. Thanks!
Mite Control While Honey is on the Hive
Part 1
First Published in ABJ November 2020
Randy Oliver
ScientificBeekeeping.com
During our hot, dry California summers most of our nectar flow may be over by early July, but if we’re lucky, our hives may still put on some harvestable honey. In any case, to control varroa at this time of year we can only use mite control products or methods that won’t taint the honey. I’ve been experimenting with extended-release oxalic acid, and wanted to try a new delivery matrix, as well as to compare its efficacy to that of the two miticides currently approved for use when honey is on the hive.
Introduction
Varroa mites build up at a relatively predictable rate in untreated, nonresistant, hives. You can use my open-access model [[1]] to predict the buildup of mites, as well as the effects of treatments (Figure 1).
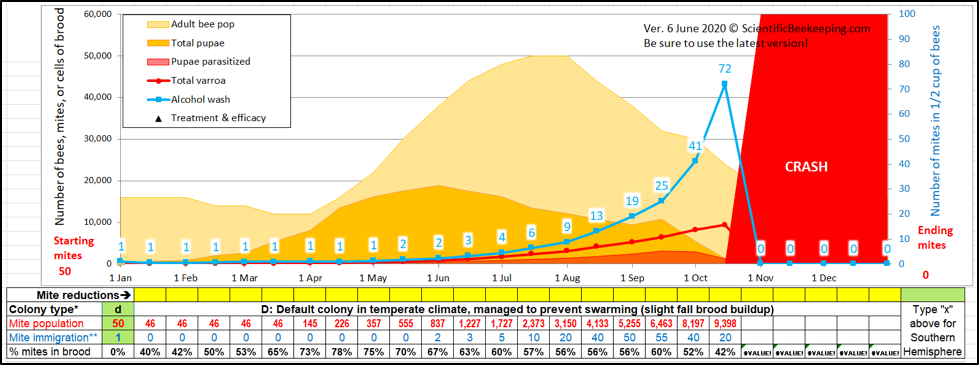
Fig. 1. A simulation starting with 50 overwintered mites in the hive in January (a relatively low level). Note that mite wash counts might not seem to be of concern until late summer, despite the varroa population exponentially building up to nearly 10,000 mites in the hive. In order to survive the winter, this colony needed to receive a treatment by mid-August at the latest, while harvestable honey might still be on the hive.
Beekeepers often speak of varroa “exploding” in the hive, but if you take a look at the red line representing the total mite population of the hive, you can see that no explosion actually took place, despite the simulation accounting for a gain of 245 mites coming in via drift. The problem is that we humans have a poor understanding of the implications of exponential growth. It may help to clarify three concepts:
- The relative rate of increase of the mites
- The mite infestation rate of the bees
- The absolute change in number of mites in the hive
The relative rate of increase of the mites
This rate is the proportional gain in mites by the end of a time period, relative to their population at the beginning. For modeling purposes, the r value is calculated, which represents the instantaneous rate of change of population size (per individual). For varroa, the r value is typically greatest when a colony has a high proportion of brood relative to adult workers, and contains the most amount of drone brood.
Until I began modeling varroa population dynamics, I thought that the bee population buildup left the mites behind in the spring, with the mites “catching up” late in the season. But I now understand that I was wrong – the mites lead the race from the get go (Figure 2).
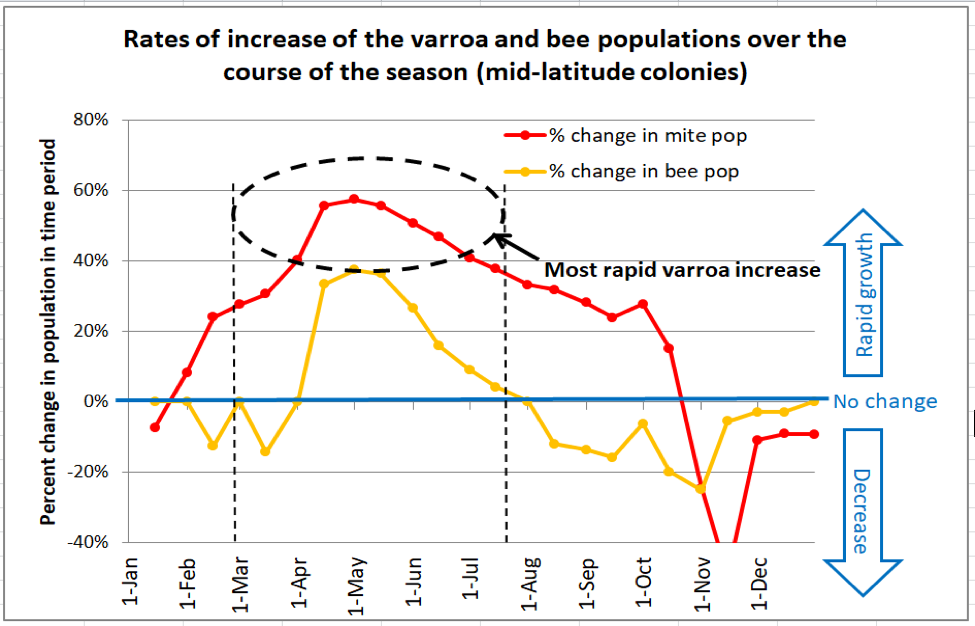
Fig. 2. This chart (from the same simulation as Figure 1) compares the relative rates of increase of the adult bee population in the hive (orange line) to that of the varroa population (red line). The horizontal blue line would indicate no population change over that 15-day time period. As you can see, the mites outpace the bees for nearly the entire season, but increase at the most rapid rate during the spring [[2]]. A simulation for hives taken to almonds (not shown) indicates that the rapid growth phase of the mites occurs even earlier in the season – during February and March.
This is an additional chart showing how varroa starts to build up even earlier in colonies going to almond pollination.
Practical application: Don’t let low mite wash, sugar shake, or stickyboard counts early in the season fool you – this is when varroa really gains a foothold in the colony.
The mite infestation rate of the bees
The mite population in the hive increases exponentially over the course of the season, whereas the adult bee population tops out in midsummer. Of even greater import is that the amount of brood (mite food) starts to decrease early in the summer – meaning that there will be less brood for more mites, resulting in an increasing proportion of pupae being parasitized (the red-shaded area in Figure 1). Once about a quarter of pupae or adult bees become parasitized, the colony generally doesn’t have long to live, due to Deformed Wing Virus (DWV) going epidemic in the hive.
Practical application: A relatively fixed population of bees and brood, coupled with an exponentially-growing population of mites, is a recipe for disaster.
the absolute change in number of mites in the hive
The above relative rates of increase only begin to tell the story. Although the rate of increase of the mites is high in the springtime, there are so few mites in the colony (compared to the number of bees), that even a doubling of the mite population is barely noticeable, and may not have a noticeable effect upon the colony.
But it’s a different picture when, for the same simulation, I plot out the absolute (net) gain in mites in the hive for each 15-day time period (Figure 3).
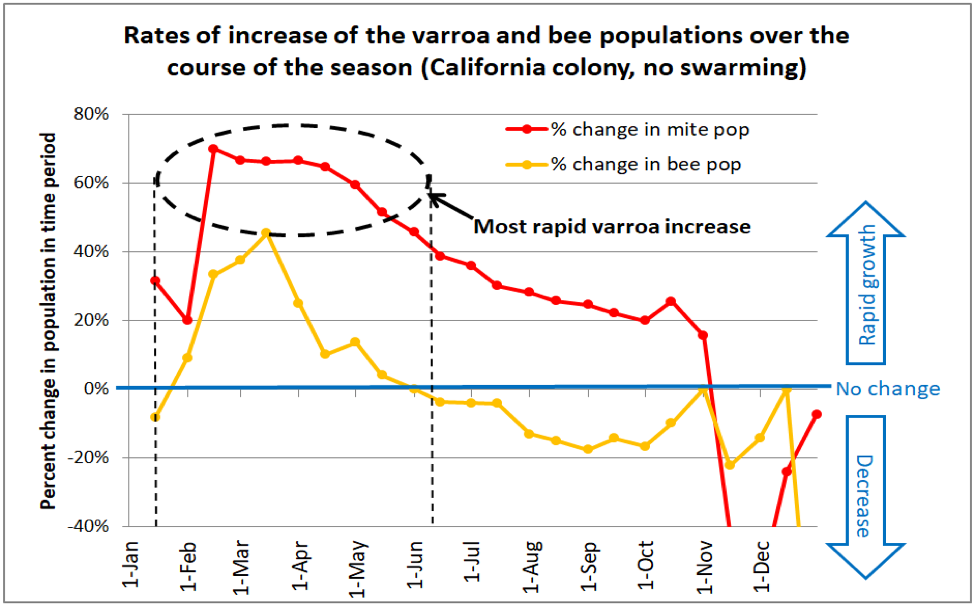
Fig. 3. The simulation above starts with 50 mites on January 1st. By the first of May the in-hive varroa population was increasing by 200 additional mites every 15 days. But by the first of July the increase was over 600 mites in 15 days, and by August they were building up at a rate of over 1000 mites every two weeks.
Practical application: If a colony goes into May with a sizeable mite population (as indicated by a mite wash count of over 1 mite per half cup of bees), the mite population will increase tremendously during the honey flow, building up to a dangerous level by September. Take home message: get the mite population down early in the season.
So let’s run the same simulation, but this time reduce the mite population by 80% with a treatment on the first of May (Figure 4).
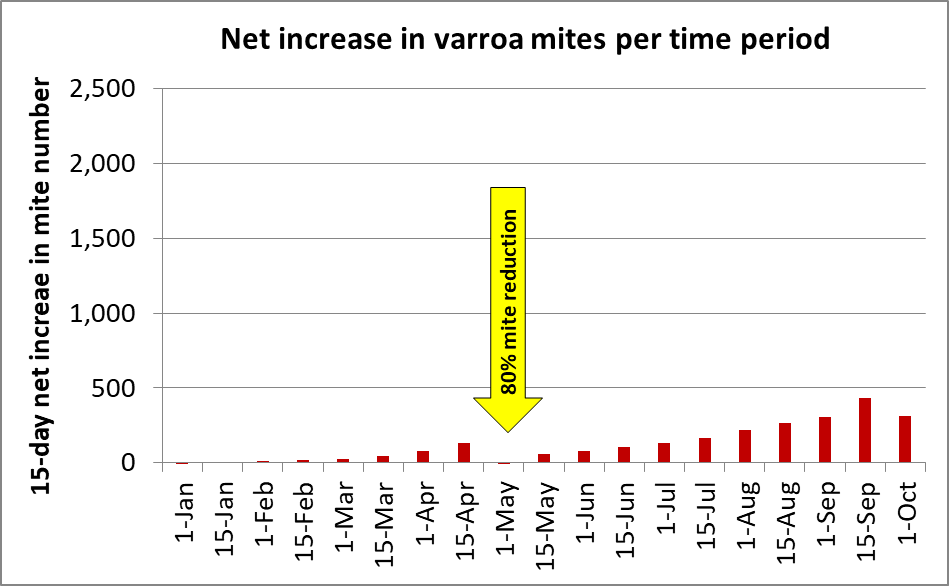
Fig. 4. In the same simulation as in Figure 3, I included a mite treatment on May 1st that decreased the total mite population by 80%. Note how that treatment prevented the mites from ever increasing again at a high absolute rate.
Practical application: Early-season mite management is critical in order to keep your colonies healthy and productive – many beekeepers make the error of waiting until the horse is already out of the barn. But we can be caught by surprise, and may need to reduce the varroa population during summer. Our problem is that there are currently only two mite-control products that are registered for application during that time period, or while harvestable honey may be on the hive (Figure 5).
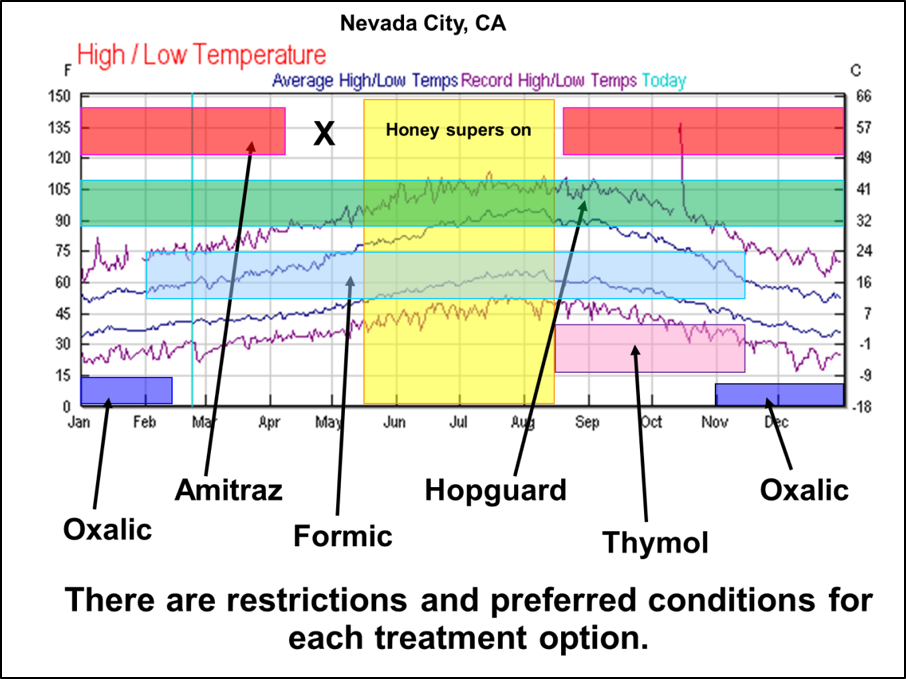
Fig. 5. There are several varroacide choices available [[3]]. But each has allowable or preferred treatment windows, based upon season, temperature, whether brood is present, and whether there is honey to be harvested on the hive. Apivar, for instance, needs to be applied 8-10 weeks before you place honey supers [[4]], and oxalic acid is only approved for use in “late fall or early spring when little or no brood is present.”
New Products on the Market
Two established companies have come out with new versions of their products (Figure 6).
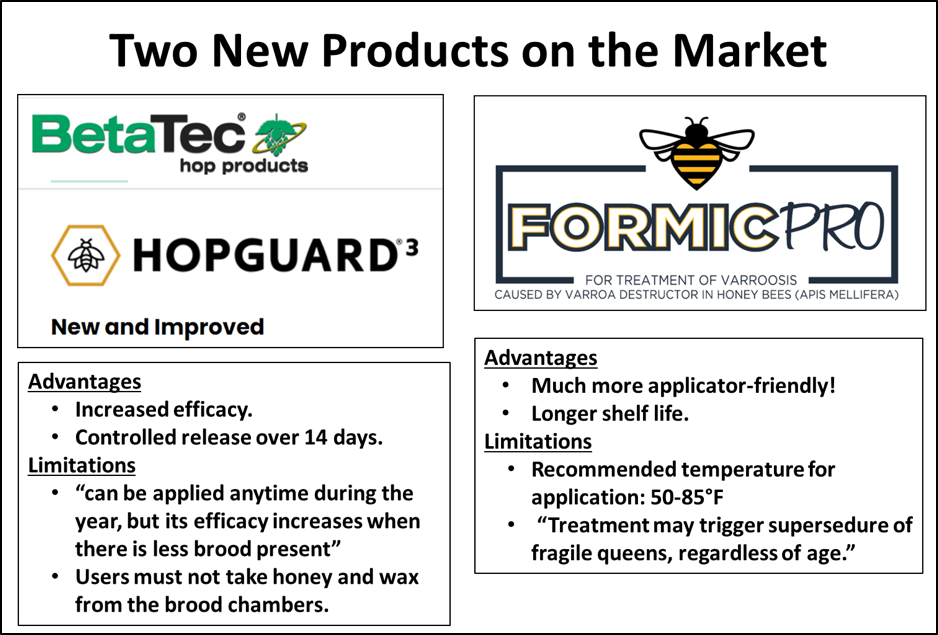
Fig. 6. The new versions of these two well-established miticides were ripe for testing. How would they perform in hot weather when brood was present?
Practical note: I find that the labels for mite control products are often confusingly written (and with typos), difficult to understand, and lacking in important information (such as the amount of active ingredient per dose). Oddly, for Formic Pro, there is no mention of any preharvest interval — the wait time between a pesticide application and when a crop (the honey) can be harvested.
Can one use oxalic acid?
The current registration for oxalic acid states: “Use only in late fall or early spring when little or no brood is present…Do not use when honey supers are in place to prevent contamination of marketable honey.” So that rules it out for application during summer. However, there is now plenty of data that oxalic acid treatment does not taint the honey – it has just not yet been submitted to the EPA in order to change the label. Even so, oxalic acid vaporization or dribble are not very efficacious when a colony contains sealed brood [[5]]. For that reason, I’ve been putting a great deal of effort in trying to figure out the best methods for applying extended-release OA in glycerin for mite control during the honey flow (hoping that we can eventually get it approved).
An Application Method in Development
I’ve published my previous investigations of extended-release OA in glycerin, using chipboard or shop towels as the delivery matrix. This season I wanted to test using a different matrix — the Swedish cellulose sponges recommended to me by several beekeepers in other countries.
Notice and Disclaimer: Let me make clear that the OA/glycerin application method is not yet approved by the EPA. I am collaborating with the Registrant (USDA-ARS), and have a Pesticide Research Authorization from the State of California for running my experiments. I publish the details of my materials and methods solely for the benefit of other researchers who have obtained experimental use permits (so that I don’t have to answer so many emails). I do not in any way suggest the use of OA/gly by other beekeepers until it is approved by the EPA.
Preparation of the OA/gly pads
For my field trials this season, I prepared application pads by cutting Swedish sponge cloths lengthwise into roughly 3½” x 8” strips, and allowed them to absorb a measured amount of a heated 1:1 w:w OA dihydrate:glycerin solution. We prepared the pads by placing 1000 g of OA dihydrate plus 1000 g of vegetable glycerin into a steam table insert [[6]]. We then heated the mixture (using a potato masher to break up the clumps) to 170°F, by which point all the OA was dissolved and the solution was clear. We then removed the pan from the heat and placed 40 sponge strips (shuffled curved sides back-to-back for better absorption) on edge into the hot solution (Figure 7).

Fig. 7. Preparation of the OA/glycerin sponge pads. We tried various methods, and found this one to produce pads containing a consistent dose. This photo was taken of a primitive setup on the driveway –it would likely be better indoors with a steam table or double boiler.
Since the sponges swell to twice their starting thickness, a “third-size” insert allows room for 40 strips to fully absorb the solution. Once the solution was 2/3 of the way absorbed, we used kitchen tongs to carefully flip the strips over to absorb the last of the solution (on occasion we needed to pour remaining solution over the strips as they cooled in order to obtain full absorption). Once absorbed, the strips had consistently increased in weight by 50 g [[7]], indicating that each contained 25 g of OA dihydrate. As the strips cool, they stiffen as some of the OA recrystallizes. We placed the cooled strips in plastic food containers for transport to the apiaries.
Practical applications for other researchers: During preparation there is always the chance of a drop of solution to splash. We ALWAYS wear safety glasses. The OA/gly solution sticks to everything it touches. If it gets on your skin, there is no immediate effect, and you may not notice any burning sensation for some time, so wearing gloves and an apron are important. We keep a baking soda solution (10 heaping tablespoons/gallon) on hand (during preparation and in the field) for neutralization of hands and tools, and use it liberally.
Of interest, the bees don’t tend to chew or propolize the saturated sponge cloths as they do OA/gly applied on paper towels (Figure 8).
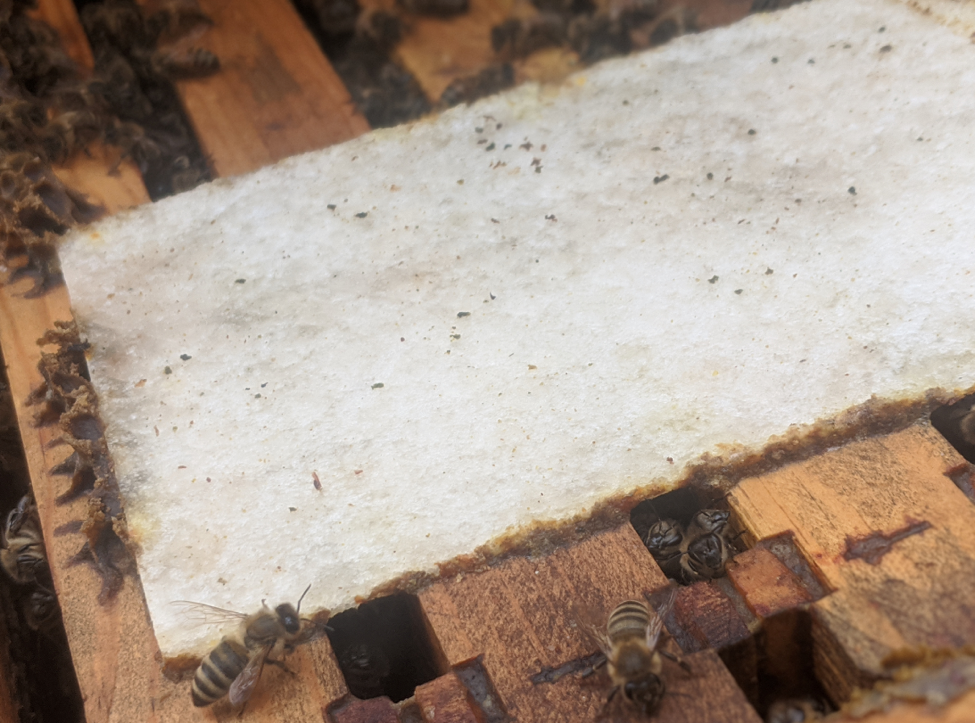
Fig. 8. Notice how the bees tend to put a ring of propolis around the edges of the OA/gly-saturated sponge cloths, but do not chew, remove, or cover them with propolis (as they do with Scott Shop Towels). The sponges do a better job of holding the solution, and often feel “wet” with the mixture even after two months or more in the hive (at least under our dry California conditions). I have not yet measured, but even then a substantial portion of the OA “dose” remains in the sponge.
Experimental Design and Setup
Starting mite levels
Since it’s hard to tease out meaningful measurements of the efficacy of mite treatments at low infestation rates, I intentionally set up this trial using a number of colonies with high mite counts (Figure 9).
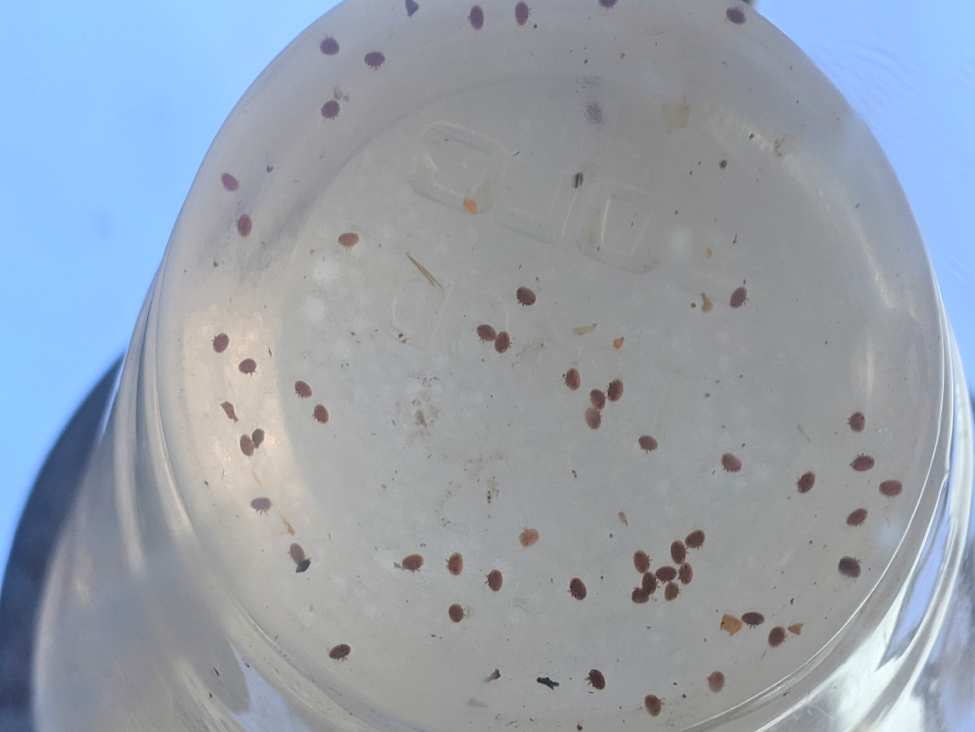
Fig. 9. You can’t learn much from a test in which mite counts go from, say, 3 to 1 (since even a single mite would account for 33% of the starting count). But you get meaningful efficacy data from counts that go from, say, 30 to 1.
The test hives
We set up the test yards with singles started from nucs containing 2nd-year queens returned from almond pollination – such colonies normally build up rapidly for us and draw a deep of foundation. We intentionally allowed the mites to build up in these hives for the trial. Frustratingly, the weather thwarted colony buildup, and by mid-June many of the colonies were still in singles, with only 8-10 frames of bees. So we added a second brood chamber to the singles (some with foundation only), and a super to the doubles, and hoped for a late flow. Although I had expected to be starting with stronger colonies, I wasn’t as concerned about honey production as I was in seeing how well the various treatments worked to bring mites under control.
Practical application: Since our test hives were generally not particularly populous, I don’t know how the findings of this trial will apply to strong hives stacked high with honey supers.
We ran the trial with hives in seven yards at different elevations and forage types (Figure 10).
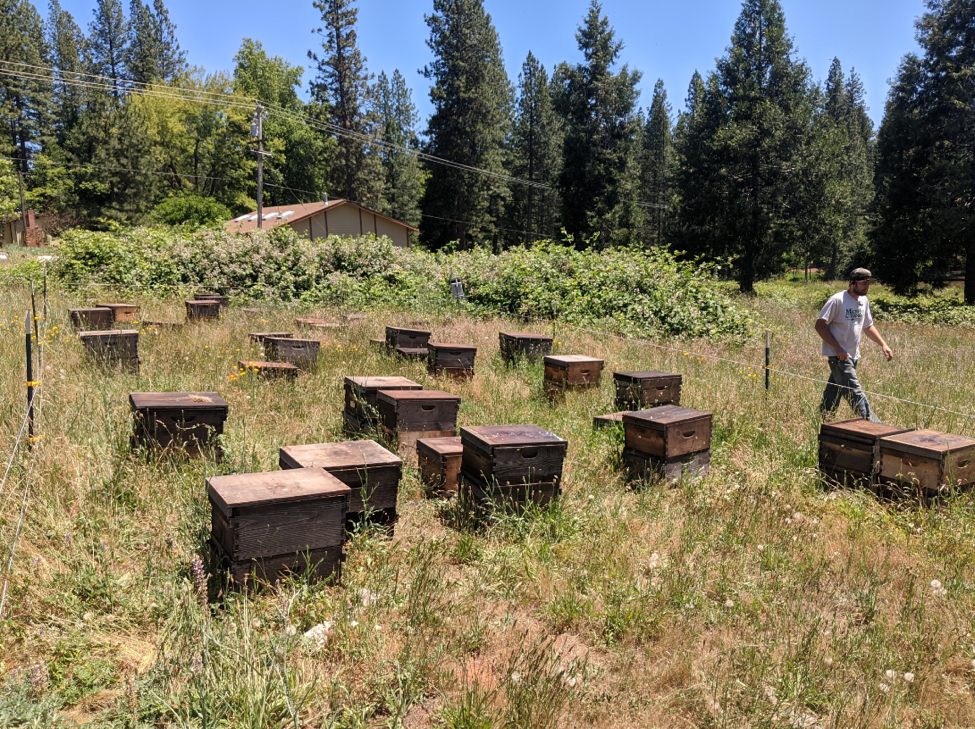
Fig. 10. A typical test yard at the start of the trial. Blackberry is nearing end of bloom in the background.
Despite the hot, dry weather, to our surprise we did experience a brief nectar and pollen flow during the latter half of the trial (Figure 11).
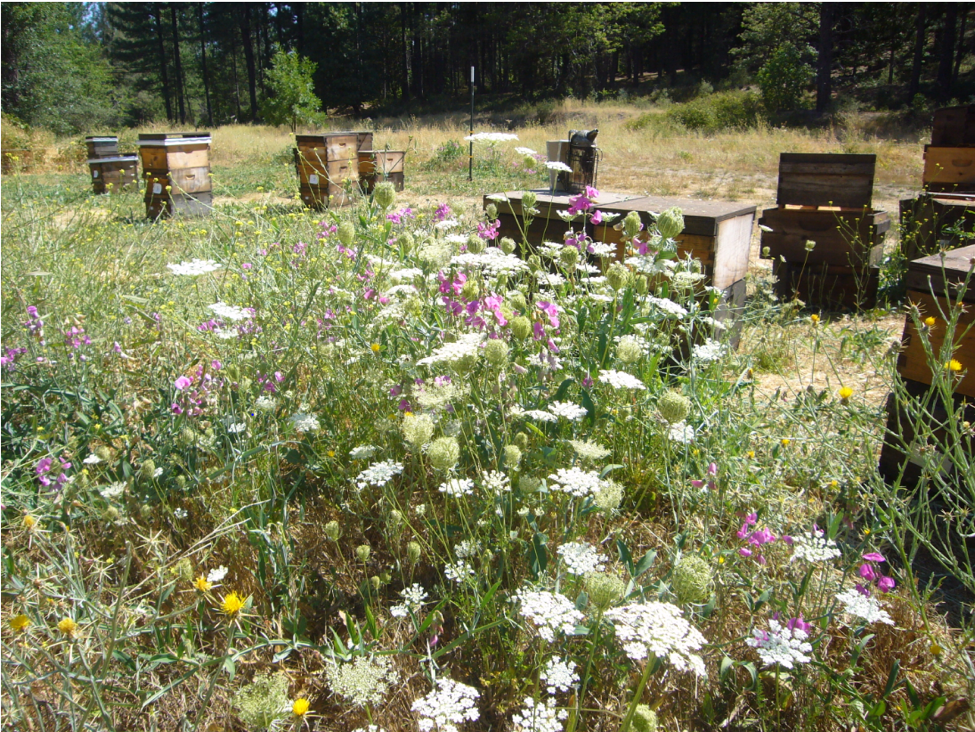
Fig. 11. Although attractive, the Queen Anne’s Lace and Everlasting Pea are of little interest to honey bees. It was the Yellow Star Thistle (left foreground) that kicked in once the temperature exceeded 95°F.
Practical application: The nectar flow was telling — strong colonies with low mite levels were able to put on around 50 lbs of honey, while those with high mite levels stagnated.
Treatment assignment
First we took mite wash counts from every hive (from a frame adjacent to brood), using mechanical agitators. Since I didn’t want any colonies to collapse from varroa/DWV before the end of the trial, I excluded hives with starting counts above 70 mites. And since I didn’t want any of the untreated Control colonies to perhaps include mite-resistant stock, or to have their mites build up to collapse level, for the Control group I only used colonies with mite counts between 10 and 20 mites per half cup of bees (roughly a 3-7% infestation level). I then assigned the remaining hives in each yard in a non-random design by blocks stratified by starting mite level [[8]]. The key parameters of the trial, and treatment assignments are summarized in the following two boxes:
| 2020 FIELD TRIAL OF VARROA TREATMENTS DURING A HONEY FLOW
· 263 hives, in 7 yards at different elevations.
· Trial from 23 June – 6 August (42 days treatment duration).
· Daily high temps from upper 80s to high 90sF, RH 15-30%.
· All colonies starting with 2nd-year queens, 8-10 frame strength, in Langstroth deeps, with recently added second brood chambers (some with foundation only).
· Intentionally wide range of starting mite levels.
· Erratic weak nectar flow, fed some sugar syrup. |
The Treatments
Three of the treatments are shown in Figure 12.
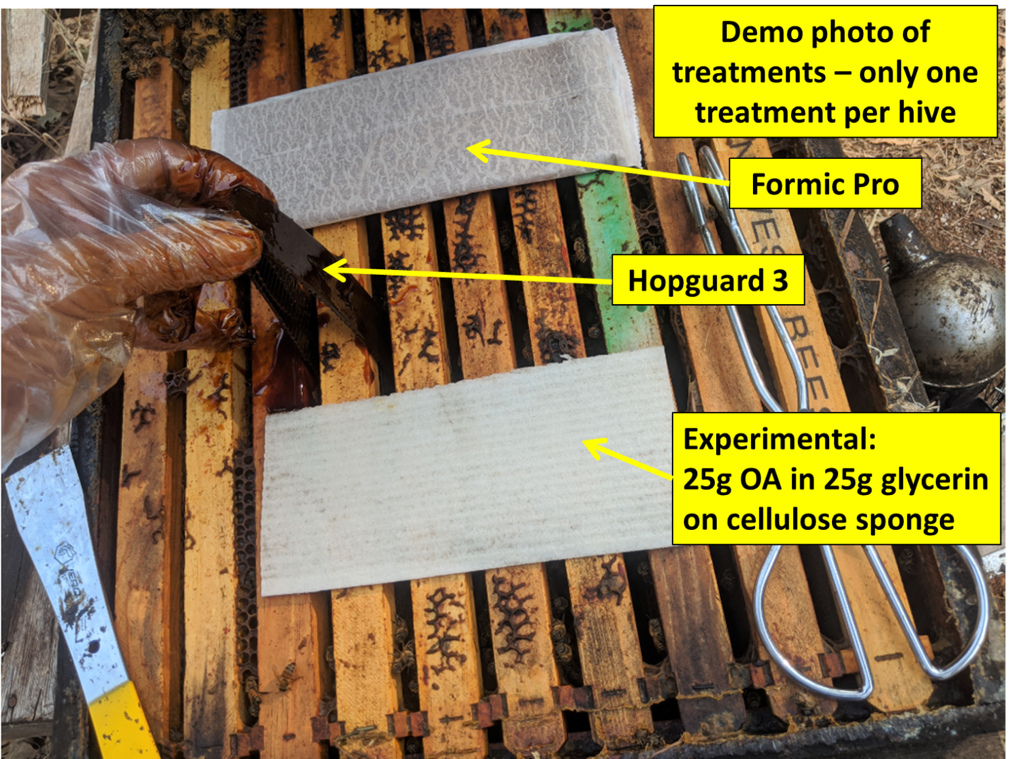
Fig. 12. This is a demonstration photo of three of the treatments to show their comparative sizes. Note the disposable polyethylene food-handling gloves [[9] ], which work nicely for Hopguard application. They are much easier to put on and off than nitrile, and cheap enough for even a penny-pinching beekeeper such as myself to discard without hesitation after use (however they are not suitable for hard work).
Practical application: The different products require different Personal Protective Equipment (PPE). For Hopguard 3, one must wear “appropriate protective eyewear, such as face shield or goggles, long sleeved shirt and long pants, waterproof gloves and shoes plus socks” (don’t forget the socks!). For Formic Pro you also “must wear coveralls over a long-sleeved shirt,” and “acid resistant gloves (PVC, neoprene, or nitrile).” The current EPA label for oxalic acid dribble is ridiculously excessive in its requirements, requiring > 14-mil chemical-resistant gloves, plus a “half-face respirator with cartridge and/or particulate filter” (for a chemical that does not evaporate, and only a minor irritant to the skin).
Not shown is the Shop Towel treatment, which can be viewed at [[10]].
All treatments were applied according to label instructions, with most Hopguard hives receiving two strips, but those with any cluster in the upper hive body receiving three. The Formic Pro strips were applied during the day at temperatures above label recommendations, with the single-strip application repeated at 10 days.
Experimental note: I intentionally ran this trial during hot weather (Figure 13), since I wanted to test the treatments under California summer conditions. I also intentionally used 2nd-year queens, since I wanted to see how well they survived formic acid application via Formic Pro strips in hot weather.
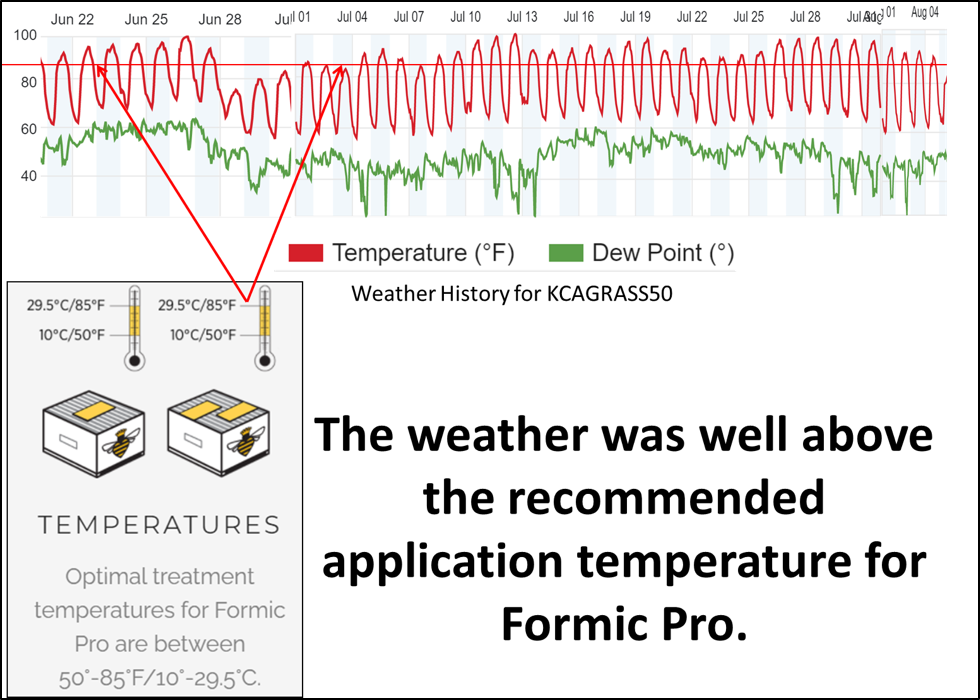
Fig. 13. Many beekeepers are concerned about applying formic acid during hot weather. So I put the colonies and their queens through the “acid test” by applying the treatment when the temperature was above the recommended high limit (horizontal red line; application days indicated by red arrows), and then monitored the colonies for queen condition and overall recovery.
Monitoring
We applied all treatments on 23 June, and checked selected representative strong hives for each treatment in each yard for midpoint mite counts on 12-15 July (at which point I also started checking for queen condition in the formic-treated hives). Final mite counts and queen check were performed on 4-5 August. I also performed follow-up 72-day counts on some of the OA-treated hives.
Results
I’m out of space, so will continue next month.
Notes and Citations
[1] https://scientificbeekeeping.com/randys-varroa-model/
[2] The big drop in mites during November is from the loss of those riding on summer bees exiting the hive and not returning, coupled with reduced reproduction in the diminishing broodnest.
[3] Here’s the breakdown of products currently registered for use in the U.S. or Canada. Details for use of each one available at https://honeybeehealthcoalition.org/wp-content/uploads/2018/06/HBHC-Guide_Varroa_Interactive_7thEdition_June2018.pdf
Synthetic Chemicals
Apivar® (amitraz)
Apistan® (fluvalinate)
CheckMite+® (coumaphos)
Essential Oils
Apiguard® or Thymovar® (Canada only) (thymol)
ApiLife Var® (thymol + eucalyptol, menthol, and camphor)
Organic Acids
Mite-Away Quick Strips® and Formic Pro™ (formic acid)
Formic Acid 65% (only in Canada)
Oxalic Acid
HopGuard® II and 3 (hops beta acids
[4] Since it takes 6-8 weeks to reach full efficacy, and the strips must be removed at least two weeks before placing on honey supers.
[5] https://scientificbeekeeping.com/extended-release-oxalic-acid-progress-report-4/ See Fig. 12.
[6] Winco SPT4 1/3 Size Pan, 4-Inch,Stainless Steel,Medium.
[7] Confirmed by weighing samples after preparing them.
[8] I used a non-randomized block design to assign treatments so that each stratum of starting mite level was tested in each yard by each treatment (i.e., the seven hives with the highest mite counts in that yard each got assigned a different treatment, and so forth down the line).
A statistician would argue that I should have randomized each block, but I wanted to ensure that the highest-mite hives in each block received an OA/glycerin treatment, so assigned the treatments for each block in order of the list in the “Treatments Tested” box. When I got down to colonies with trivial mite counts, I assigned them a single OA/gly treatment (since my main interest was to see how this treatment would perform). Only as an afterthought did I include a treatment with two OA/gly shop towels for comparison to last year’s field trial, arbitrarily replacing two treatments at midrange mite levels in each yard. I’ll be the first to say that the treatment assignment could have been better.
[9] Kleen Chef disposable food handling long cuff polyethylene gloves.
[10] See Figure 1 at https://scientificbeekeeping.com/extended-release-oxalic-acid-progress-report-2019/