First published in: American Bee Journal, November 2018
Extended-Release Oxalic Acid Progress Report #4
2018 California Field Trial
Randy Oliver
ScientificBeekeeping.com
Published in ABJ in November 2018
I’ve handed my beekeeping operation, still headquartered at my home, over to my sons Eric and Ian, with the provision that I have the hives at my disposal for research during my “retirement.” This season I was overly ambitious, running two field trials on oxalic acid, one on improving the formulation of pollen subs, and one on the drift of bees and mites associated with collapsing colonies. That in addition to the roughly 1400 mite washes involved in my selective breeding for varroa resistance, plus my formally testing of a bee health product for the manufacturer. I’ll be publishing the results of all but the last as I get them written up. I’ll start with an update on my progress with extended-release oxalic acid.
Disclaimer: I’m collaborating with the USDA-ARS to register this application method for oxalic acid, and have a Pesticide Research Authorization from the State of California. The method described here is not yet registered in the U.S. But since my research is funded by donations from beekeepers, I feel that I owe a progress report to those donors. I in no way encourage the unregistered application of any pesticide—please wait until this method is approved by the EPA and your State before using it in your own hives.
Questions yet to answer on extended-release oxalic
We beekeepers are in desperate need of a mid-to-late-summer varroa treatment that is effective when there is brood in the hive and there are honey supers on, and that can be used in hot weather. Ideally, it would also not contaminate the beeswax, nor require a face shield or gas mask for safe application. An extended-release formulation of oxalic acid may fit the bill.
My previous updates on this research are at my website [[1]], in short, I found one experimental formulation of oxalic acid dissolved in glycerin (OA/gly) to be highly efficacious at reducing mite levels during the summer in my California test yards. But I needed to know whether other formulations might work even better. So I ran incubator trials last winter, testing a range of ratios of OA to glycerin, as well as different degrees of saturation of the cellulose matrix (using Scott® shop towel towels), an alternative solvent/dispersal agent (propylene glycol), and the effect of humidity.
I attempted to duplicate bee and mite exposure in a colony by attaching a measured square of shop towel to a piece of beeswax-coated plastic foundation and adding a carefully-measured amount of different OA/gly formulations to the towel (Fig. 1).

Figure 1. Adding a measured amount of a test formula to a 1-inch square of shop towel.
I then added roughly 150 young adult honey bees (measured volumetrically) to each cup cage. The bees moved about on the piece of foundation, mostly clustering towards the top, and thus were exposed to the OA/gly similarly to how they would be in a hive (Fig. 2).

Figure 2. I maintained the caged bees in a dark incubator at 32°C and roughly 60% RH. In some tests I used bees from high-mite colonies and added a screen to the bottom, so that I could calculate mite mortality due to the treatment.
I ran eight incubator trials in all, performing nearly 200 chemical titrations to quantify the amount of OA residues on the bees’ bodies. I was frustrated that exposure to even a small piece of OA/gly towel often killed all the bees in the cage.
In brief I found that it took very little OA to kill the mites, but that it took some amount of glycerin to expose the mites to the OA. On the flip side, too much glycerin on the towel caused excessive “wetting” of the bees, and jaw-dropping overexposure to OA, causing agitation and death (but not from glycerin alone). There was also some suggestion that this adverse effect was exacerbated by higher humidity.
But I needed to end my cage trials when we put the incubator back into service for holding queen cells, and decided to run a springtime field trial in actual hives instead. I did run that trial and will write about it later (since I still need to perform hundreds of titrations of frozen bee samples). But before I could finish the springtime trial, which I hoped would narrow down the 8 formula options that I was considering, it came time to start the summer field trial. So I bit the bullet and tested them all.
So where I stood then was that I needed:
- To compare the performances of various ratios of OA to glycerin, as well as different saturations of the shop towels, in order to determine whether we should pursue last season’s formulation, the Argentinian formulation [[2]], or other ratios or saturations.
- To test using propylene glycol instead of glycerin as the solvent/carrier for the OA.
- To attempt to replicate the efficacy results from last season’s two trials, under even more field-realistic conditions, in a number of yards, on a mixture of colony strengths, with additional hives present in the yards, and with exposure to some mite drift from collapsing colonies.
- To compare the extended OA treatment to repeated OA vaporizations.
Experimental Design of the Summer Trial
The Test Colonies
We ran the summer trial in 14 different yards, containing from 24-75 colonies in 2-3–story hives, headed by second-year queens. The colonies had been last treated for varroa the previous December with an oxalic dribble and then run to almonds. In order to allow the mites to build up, in early April, we split each second-year queen off into a nuc to prevent swarming, and allowed her colony (and the mite population) to grow to decent strength by the start of the trial. In order to get enough test hives, we needed to also include one yard of colonies started this season with fresh queen cells, which had last received an oxalic dribble in April. Our selection of the test and control hives is further described later.
No hives had been treated with synthetic miticides previously, nor exposed to ag chemicals other than possible exposure to fungicides in almonds in March.
By mid-June, colony condition varied considerably, as it would in a typical apiary, with some colonies being quite strong and productive, others weaker; but we did not include any colonies that appeared to be sick, queenless, or failing. At the start of the trial, the colonies were full of brood, and our main honey flow was underway.
The Treatments
We prepared 9 different formulations to test, as below (Table 1). Based upon last season’s results, all treatments applied 18 g of oxalic acid to the hive, other than treatment M, which tested whether a low OA, high glycerin application would be efficacious.
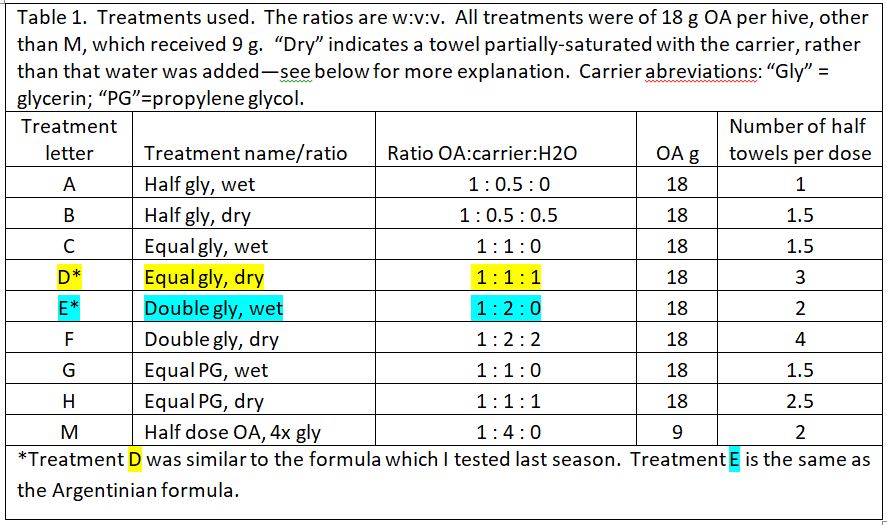

“Wetness” in the table above (indicated by blue) indicates how saturated the final towel was with glycerin, since I’ve noticed that bees tend to avoid highly saturated towels (they are also sloppy to handle). The concentration of OA to glycerin is indicated by red.
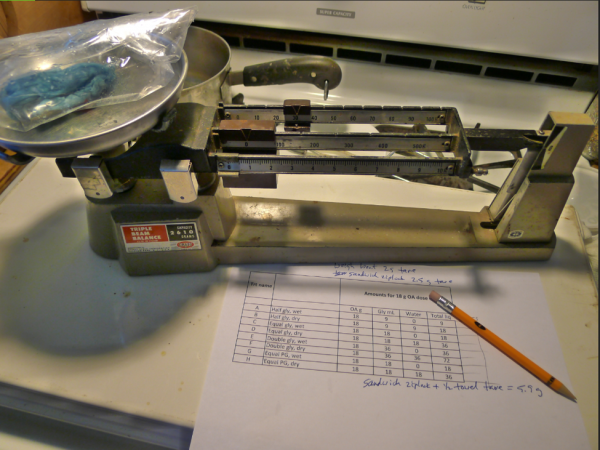
Figure 3. Prior to testing, we mixed a batch of each formulation, allowed it to absorb into a towel, and then held the towel until it ceased dripping. We then weighed the towel in order to determine how many towels would be required to hold 18 g of OA for each formulation. Note: when I post this article to my website, I will include more photos of preparation and field application.
Field Log
From 21 June through 3 July, we took baseline alcohol washes from every hive in each yard, and applied treatments yard by yard, selecting hives for treatment that had varroa counts in the range of 5–20 mites (all mite counts in this article are per level half cup of bees—typically 320-340 bees), although as we ran short on colonies, we included some with starting counts of up to 28 mites. In each yard we assigned treatments in alphabetical order, starting where we left off at the last yard, so that we arbitrarily applied each treatment to approximately 25 hives (other than Treatment M, which was an afterthought), evenly distributed between yards (Figs. 4-6).
Update: We now prefer absorbent matrices other than shop towels, which have many disadvantages. Please refer to my more recent reports on extended-release oxalic acid.
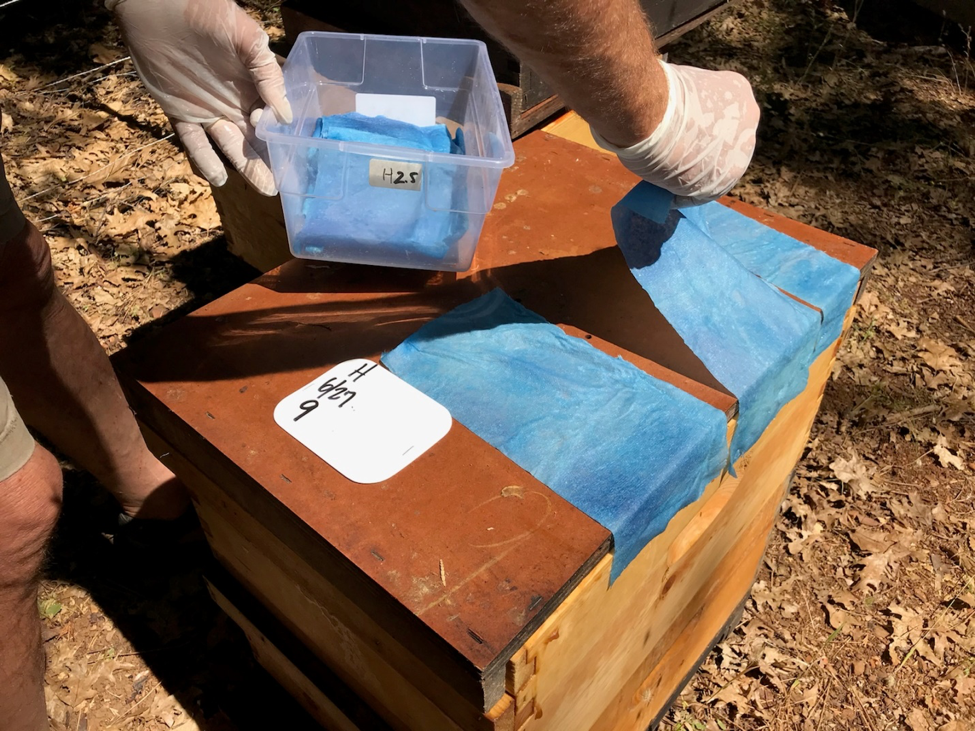
Figure 4. Each formulation required the application of a different number of towel halves or quarters, so we laid them out in advance on top of each test hive. We’ve learned that it’s best to designate one person to wear nitrile gloves and handle the towels; another to smoke the hives and open them.
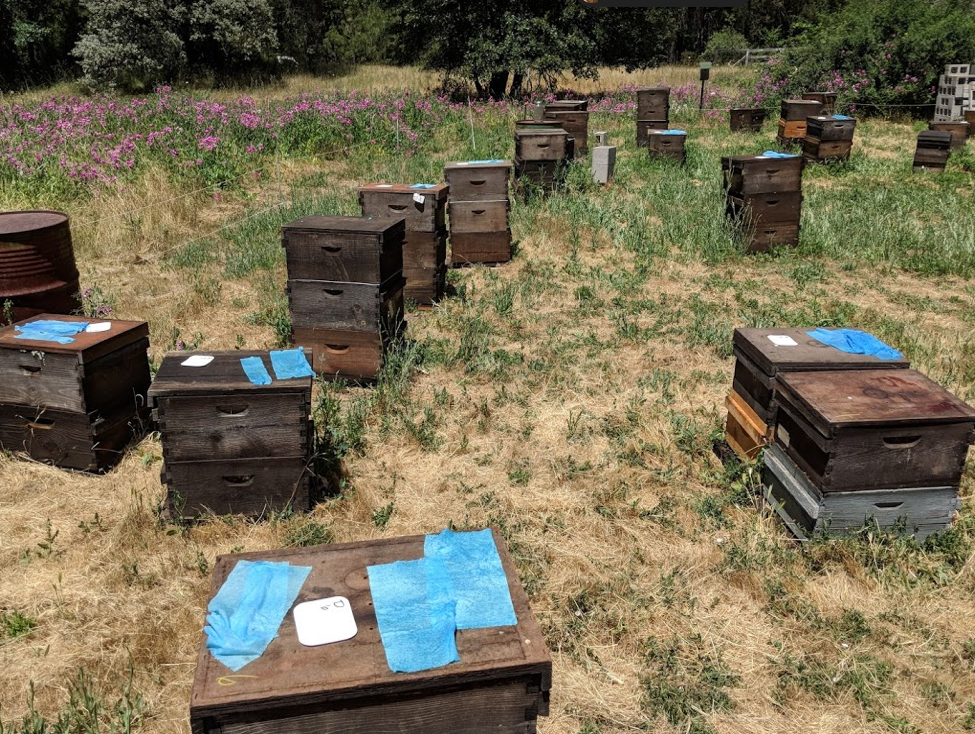
Figure 5. In each yard, we went down each row of hives, assigning treatments in alphabetical order. Here we’d laid out the towels and were ready for a double check on proper hive labeling and towel count prior to application. Most of the test hives were drawing foundation in the second box, some in a third. The towels were applied across the top bars of the lower brood chamber, with no queen excluder, since we’ve found that for good efficacy, that the towels are best applied in the middle of the cluster. Note in this photo that we excluded any hives with issues from the trial.
Our experience is that it is extremely safe to handle oxalic acid in this application method (especially compared to formic acid or oxalic vaporization), as there is no danger of splashing or inhalation. But the glycerin does make it stick to anything it touches (that’s why we add it), and you must remember to always wear nitrile or other resistant gloves (Fig. 6)
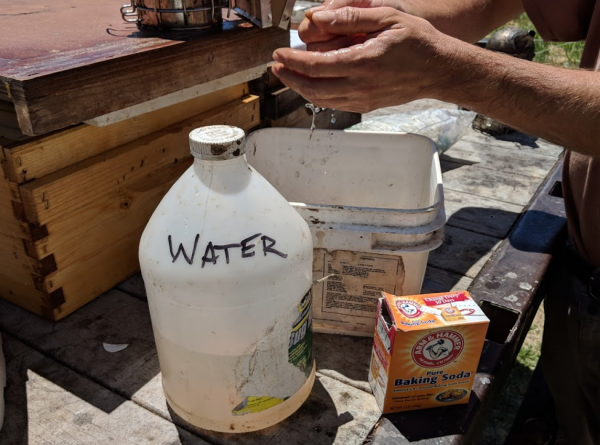
Figure 6. If you get OA/gly on your skin, you won’t notice for a while. So after any chance of exposure, we rinse our hands, hive tools, and smoker with a solution of baking soda, which immediately neutralizes any acid residues. A tip: we dust our hands with baking soda before pulling on the nitrile gloves (this also makes it much easier to slide your fingers in), and are careful not to touch anything else so long as we have gloves on.
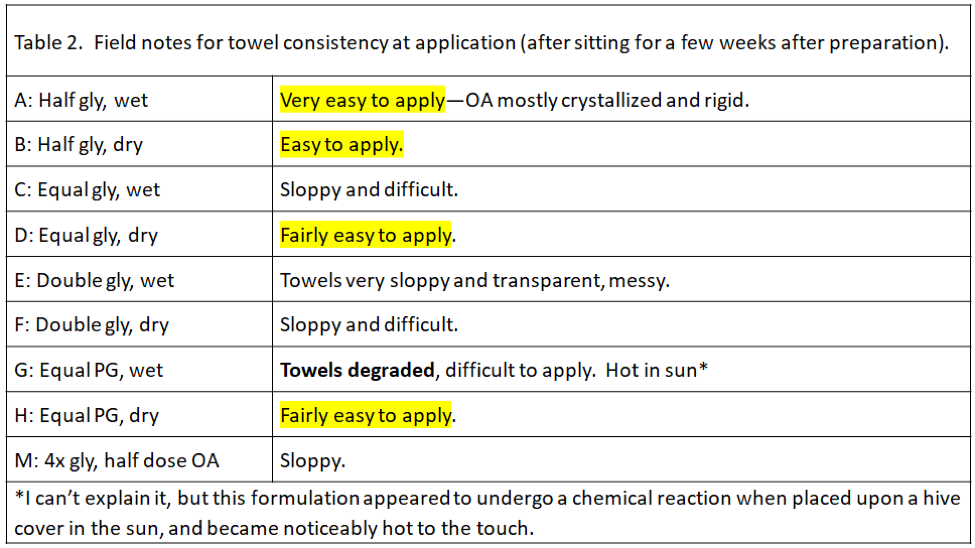
During application of the towels, we noticed that some formulations were much easier to handle and apply than others (Table 2). This will be a consideration as we figure out the best way to apply this treatment.
Any colonies in the yards that tested at a mite count of over 20 (or 28 in the last yards) were passed over, but given a strong formic acid treatment to reduce their mite counts to nearly zero, in order to avoid excessive drift of mites in the yards.
We left untreated 19 colonies with starting mite counts from zero to 13, to serve as Controls (and as potential mite-resistant breeders), again distributed through several of the yards. We did not use Control colonies with high mite counts, since they might later collapse and corrupt the trial due to mite drift. Note that the Control hives, due to their low starting counts, might have been the most mite resistant, which, if anything, would later underestimate the efficacy of the treatments.
After approximately 50 days, we took ending mite counts, again progressing through the yards in the same order. A few colonies had dwindled, and some were in the process of varroa/DWV collapse. Two yards appeared to have experienced substantial mite drift.
Results
We’ve already collected enough data on efficacy, lack of adverse effects, and lack of honey contamination to submit to the EPA, so all that I’m now trying to figure out is the optimal formulation and application method.
Analysis of the Data
I read a great number of scientific papers. I often get the impression that the researchers so want to get their paper accepted for publication, or to make their results appear important, or to support some product, that they’re unable to hide their bias. Since my research is funded solely by beekeeper donations, and since I’ve got nothing to sell, I’m going to go over these results with a very critical eye. My only vested interest is that I want a midsummer treatment that I can use in my own operation.
Honey bee field data is often messy, and a number of factors can affect mite buildup in a hive. What I’d like to show you is some of the ways that I looked at the data, in order to see what I could learn from this trial.
Midpoint Results
Both last year’s trial and my springtime trial indicated that OA/gly treatment may not cause mite wash counts to drop appreciably until after 3 weeks duration, so I didn’t want to waste time performing midpoint mite washes on all 225 test hives. Instead, in order to confirm that the same thing was occurring in this trial, at Day 21 after applying the towel treatments, we went to our largest yard (containing 60 test hives), and took mite washes from three normal-looking strong colonies from each treatment group (I skipped over weak hives, since they would have had greater OA exposure per bee; there were no M’s in this yard).
The results are perhaps best displayed by simply dividing the midpoint mite count for each hive by its starting count, which gives the fold change relative to baseline (e.g., 1.5 means that the average mite count went up by 50%; 0.5 means that the ending count was half the starting count) (Fig. 7).

Figure 7. Fold change in mite wash counts, per each hive, at Day 21 after application of treatments. Columns below the “no change” value of 1 indicate a reduction in the mite wash count (missing columns indicate no change). Note that the equal glycerin treatments had in only one hive reduced the mite counts by this time, although half had gone down in the double glycerin treatments. Note how this correlation flips by Day 50 in the next graph. At this point in time, neither the half-glycerin nor the propylene glycol treatments were impressive.
Endpoint Results
We waited to take endpoint mite washes until about 50 days (range 47 -56 days) after applying the towels. I took field notes on ending colony strength, disease, productivity, and number of hive bodies, in order to see whether there were consistent issues with any of the treatments. Nothing stood out.
I also wanted to make sure that the data wasn’t skewed by the results of a single yard. Since most of the 14 test yards had roughly the same distribution of treatment groups, I checked to see whether the results in any single yard stood out–none did (not shown). However, in nearly every yard the C and D treatments (1:1 OA:gly) most consistently prevented mite counts from increasing.
In all but 1 of the 19 Control hives (remember, we considered most of the Controls as potential mite-resistant breeders), mite counts increased–on average, fivefold. So two ways to look at the data would be (1) to see the average fold increase or decrease in mite count in each treatment group, and (2) to calculate the percentage of hives in each group in which mite counts went up (these could be considered as inadequate mite control). I’ve displayed the results in Table 3.
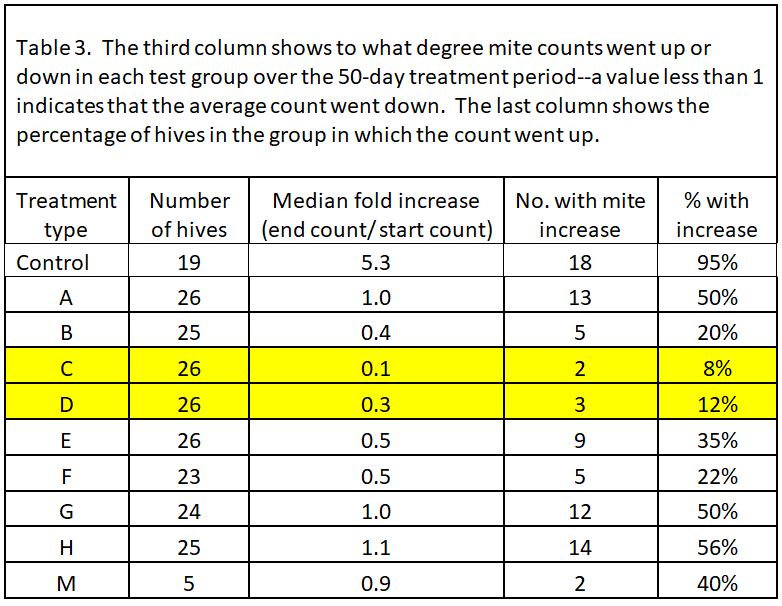
Note that most of the formulations resulted in some degree of mite reduction—but that some sure did a better job, and that’s exactly what I was interested in finding out. The yellow-highlighted 1:1 OA:gly treatments were the standouts.
Practical application: even the best OA/gly treatments did not prevent mite counts from increasing to some extent in about a tenth of the hives. So what should we make of those “outliers”?
Dealing with The Danged Outliers
A big problem with data analysis of mite treatments is the “outlier” values. No matter how effective the mite treatment, you’re likely to find some colonies in which the mites were not controlled. In this trial, the yards were surrounded by woods and residences with recreational beekeepers, so it’s likely that some of the test hives picked up extra mites from robbing or drift. As an example, let’s take a look at the pooled data for the C test group (Table 4).
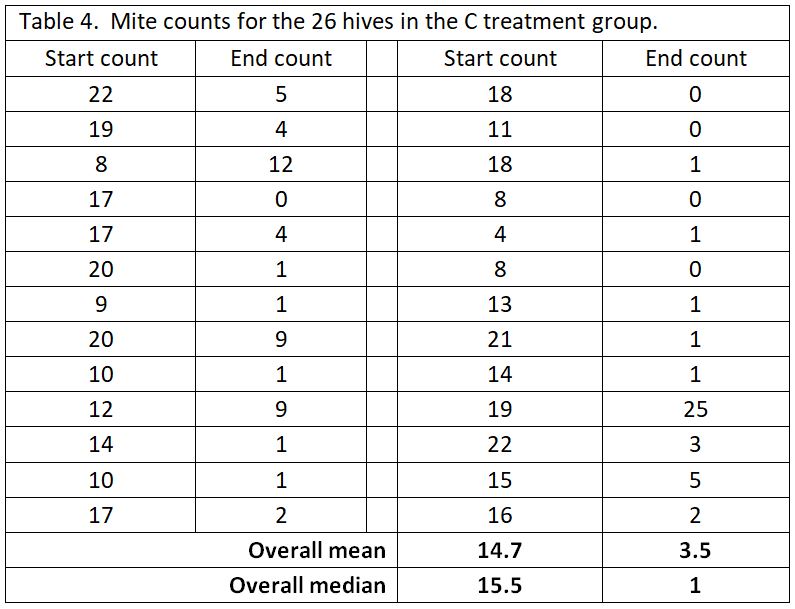
As you can see in the above table, most of the C hives had their mite counts reduced from high counts to very acceptable counts. But then there’s those danged outliers (such as where the 19 count went up to 25). We can’t tell whether the treatment did not work in that one hive, or perhaps that hive robbed out a collapsing hive, or something else. But that outlier value has undue influence if we use the arithmetical mean to represent the “average.”
For that reason, with mite count data, I prefer to look at the median value, since it is more resistant to the influence of outliers [[3]]. The median represents the midpoint value of the data set. You can compare the differences of the two sorts of averages at the bottom of the table.
Graphs are Easier to Visualize than Tables
It’s far easier for the human brain to detect patterns in graphical form than by just looking at a bunch of numbers. This is why we use charts—to put numerical data into a more visually-understandable form. Below (Fig. 8), I’ve graphed the fold increases by simply “normalizing” the data (by dividing each group’s starting and ending counts by its starting count), which then makes all groups start at a value of 1, and easier to compare.
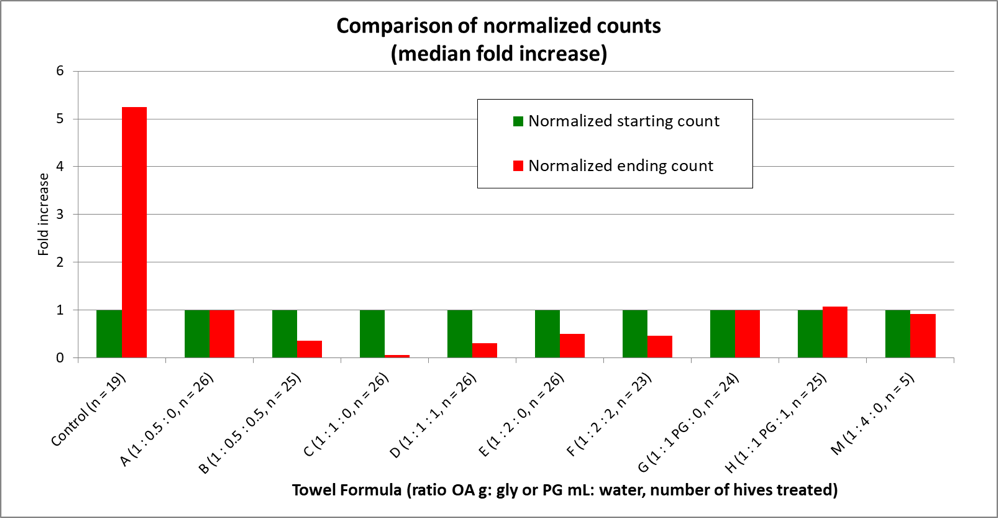
Figure 8. By normalizing the data to all start at a value of 1, it’s then easy to compare the changes in mite infestation rate for each treatment group over the course of the trial. Note the huge difference between the Control and C groups—we’ll return to that later.
Any treatment that prevents varroa levels from increasing would be good, but what most of us are interested in are treatments that actually reduce the mite count. So next I calculated the percentage of hives in each treatment group that reduced the mite count to less than a quarter of the starting level (Fig. 9).

Figure 9. The percentage distribution of hives exhibiting at least a 75% reduction in mite count. The chart indicates that in 77% of the C hives, and 54% of the D hives, the mite count was reduced by at least three quarters (it may take a minute to get your head around this chart).
But simple reduction of counts at the time of year that the trial was run doesn’t tell the whole story as far as efficacy of treatment compared to the Control group, since alcohol wash mite counts would have been expected to greatly increase at this time of year, not only because the mites had had nearly two months to build up, but the colonies had also gone from early honey flow buildup into dearth, with a resulting shift of mites from the broodnest to the adult bees, not to mention the immigration of mites from collapsing high-mite hives in the neighborhood. I’ve illustrated this with a snip from a simulation by my mite model for the Control hives in this trial (Fig. 10).
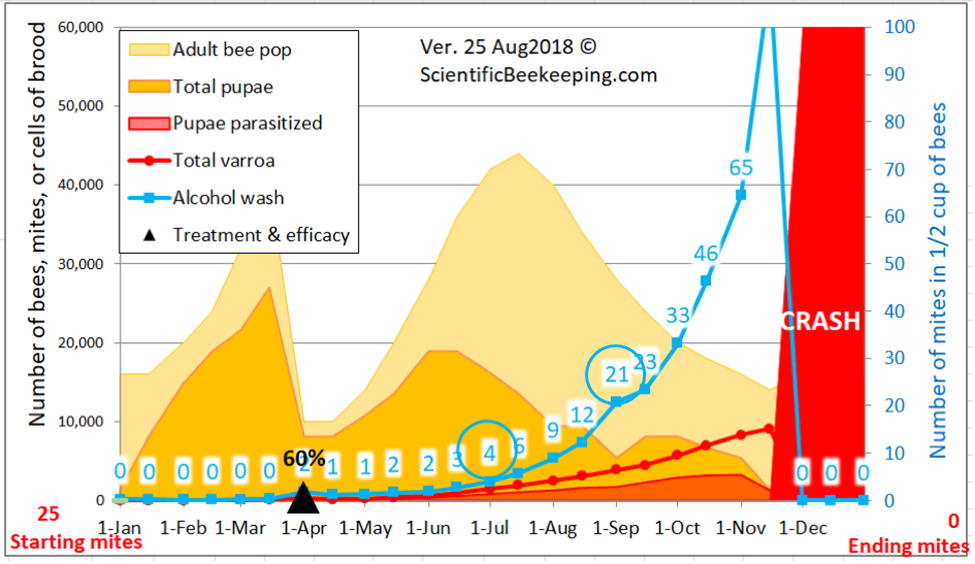
Figure 10. A simulation [[4]] for the mite buildup in the Control colonies. I’ve circled the predicted counts; the actual median field counts for the 19 Control hives were 4 and 21— hard data which helps to validate the model.
So the reduction of mite increase by each treatment must take into consideration that the mite counts, without treatment, would have been expected to increase fivefold (refer back to Fig. 8). This is taken into consideration by the various methods for calculating the efficacy of a treatment. I prefer using the Henderson-Tilton formula [[5]], using median values in order to minimize the effect of outliers. I’ve graphed the results below (Fig. 11) with the median values for the starting and ending mite wash counts shown as columns, and the calculated efficacies of treatment in boxes above the columns.

Figure 11. This chart shows the actual median starting and ending mite wash counts for each group, with the calculated overall efficacy of treatment above each red column. Error bars indicate the median absolute deviations. Compared to the huge increase in mite counts in the Control group, all the treatments exhibited good efficacy. The standouts were the C and D 1:1 ratio formulations, with up to 99% calculated efficacy.
The above chart is the sort of overall representation of the data that a scientist would want to see, since it includes error bars, which indicate how well the calculated median values actually represent the raw data with those danged outlier values. What one looks for is whether the error bars for any pair of columns overlap each other.
It appears that I got close to choosing the best ratio to test last year, since in this summer’s trial, formula C was the clear winner, at 99% efficacy, and no overlap of error bars. It was immediately apparent as we took final samples that the C- and D-treated colonies generally looked the best, as far as health and honey production, although there were good and poor colonies in each treatment group. However, the C formula creates a soggy towel that is difficult to apply—a formula halfway between C and D might be optimal, and would require one full shop towel per hive.
The low-glycerin A and B treatments didn’t fare well, nor did G and H, which used propylene glycol, which is also food grade, but with much less viscosity and surface tension than glycerin—but there didn’t’ appear to be a benefit. Surprisingly, the low oxalic/ high glycerin M treatment managed to attain 82% efficacy, despite only containing only 9 grams of acid. The original 2:1 Argentinian formula did pretty well at about 90% efficacy. Based upon this single trial, I’d hesitate to declare a clear winner, but there are other considerations.
Discussion
Of interest is the performance of the Argentinian ratio of 1 g OA to 2 mL glycerin. In my springtime trial (in prep) this formulation stood out since it resulted in what appeared to be (I’ve yet to confirm by titration) an immediate transfer of OA onto the bees, causing agitation and increased mite drop over the first few days, with formula C being next behind. This confirmed what I observed in my cage trials (and in last season’s field trials)—that towels dripping with glycerin rapidly dispersed the acid onto the bees and mites (which may account for the Day 21 performance of the E and F groups). But that rapid dispersion can result in adult bee agitation and brood kill in the first week. I have not investigated this with the hanging strip application method, and am not critical of it. However, based upon the results of this trial, when applied via shop towel across the top bars, it appeared that the lower glycerin ratio gave better overall performance.
I’ve now run four separate controlled field trials on OA/gly towels, under California conditions, in different yards, in two different years. In all four, I obtained at least 90% efficacy after 42-50 days, using formulations in the 1:1 range. I’m pretty excited about getting this application method approved.
Surprisingly, we get this efficacy at about 1/5th the dose of oxalic acid necessary with the Argentinian strips—18 g per hive vs. 80 g. That 18 g is equivalent to about 9 OA dribbles or vaporizations, although some of the OA remains in the towel residues.
Comparison to Oxalic Vaporization (Sublimation)
I was curious as to how the effect upon varroa from extended-release application of 18 g of oxalic acid in glycerin would compare to repeated oxalic acid applied by vaporization. In my springtime trial I had tested two models of vaporizers on one colony each, so I extended those repeated vaporizations through the summer trial. In all, I applied to those two hives a total of 9 treatments of 2 g of oxalic acid each (resulting in the same total of 18 g), at roughly 10-day intervals over a period of 102 days. I’ve plotted their mite wash counts below (Fig. 12).

Figure 12. The results of repeated vaporizations of hives with brood. I switched the Varrox hive to using the ProVap 110 in July (to save me the trouble of using two different electrical sources). I plan to run a more formal trial next year to compare repeated vaporizations to dribbles. Thanks to Larry at OxaVap.com for the donation of the vaporizers.
It’s surprising to me how well the bee colonies handle regular exposure to oxalic acid. In my towel-treated hives, the brood looks great at 50 days. Ditto for those hives that received 9 vaporizations (Fig. 13).

Figure 13. This photo illustrates the high rate of brood survival in the ProVap 110 colony 10 days after its 9th vapor treatment. My informal observations indicate that colonies can handle repeated or continual exposure to oxalic acid quite well. I’d hesitate to treat colonies continually all year, but oxalic certainly has its place in our arsenal of mite control tools.
The bottom line is that the above data indicate that a single application of an OA/gly towel may give as good results as multiple vaporizations, but without the need to wear a respirator and eye protection. Vaporizers have the advantage of being able to apply the treatment without cracking the hive, not leaving any remnants to remove, and some, such as the ProVap 110 are pretty quick. But those with any sort of pressure chamber should be used with caution (Fig. 14).
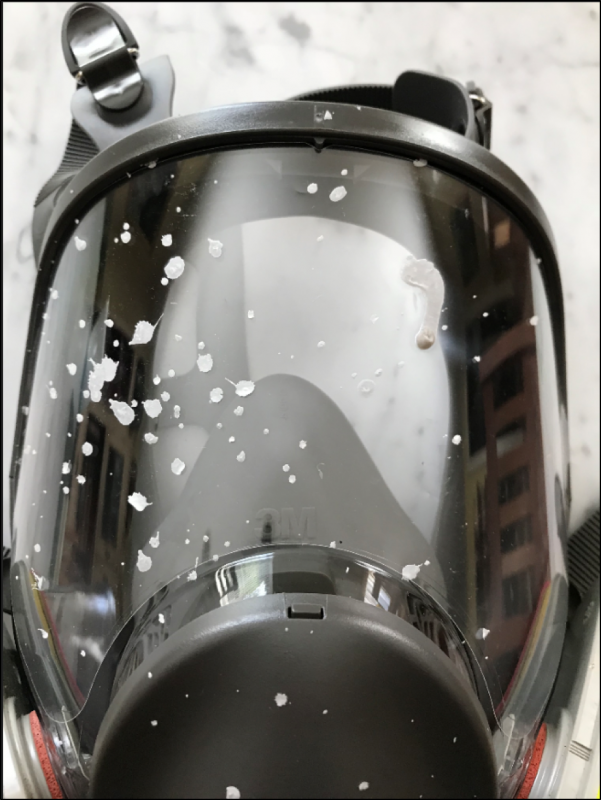
Figure 14. My friend Bill Hesbach in Connecticut was using a vaporizer, and inadvertently pressed the vapor exhaust tube against an end bar. The vaporizer blew its lid—splattering his face shield with molten oxalic acid. Bill could easily have lost his vision. Be careful when using vaporizers!
Pros and cons
The main pros of extended-release OA/gly are:
- It has high efficacy even when brood is present (at least in California),
- It appears to exhibit minimal or no adverse effects on the colony,
- It can be applied while honey supers are on,
- It can be used in hot weather,
- It’s very easy and safe to apply,
- It shouldn’t contaminate the beeswax,
- It’s very inexpensive, and
- It’s considered “organic.”
That’s a lot to love! But there are also some shortcomings and things to still work out (besides getting it registered by the EPA).
One problem with OA/gly towels is that some colonies remove every bit of the applied towels (Fig. 15), whereas others barely touch them (Fig. 16)—meaning that you need to scrape out the acidic residues with a hive tool (they are corrosive, but readily decompose on the ground). The towels also make inspection of the lower brood chamber more difficult, but most of us don’t inspect that chamber during the honey flow anyway.
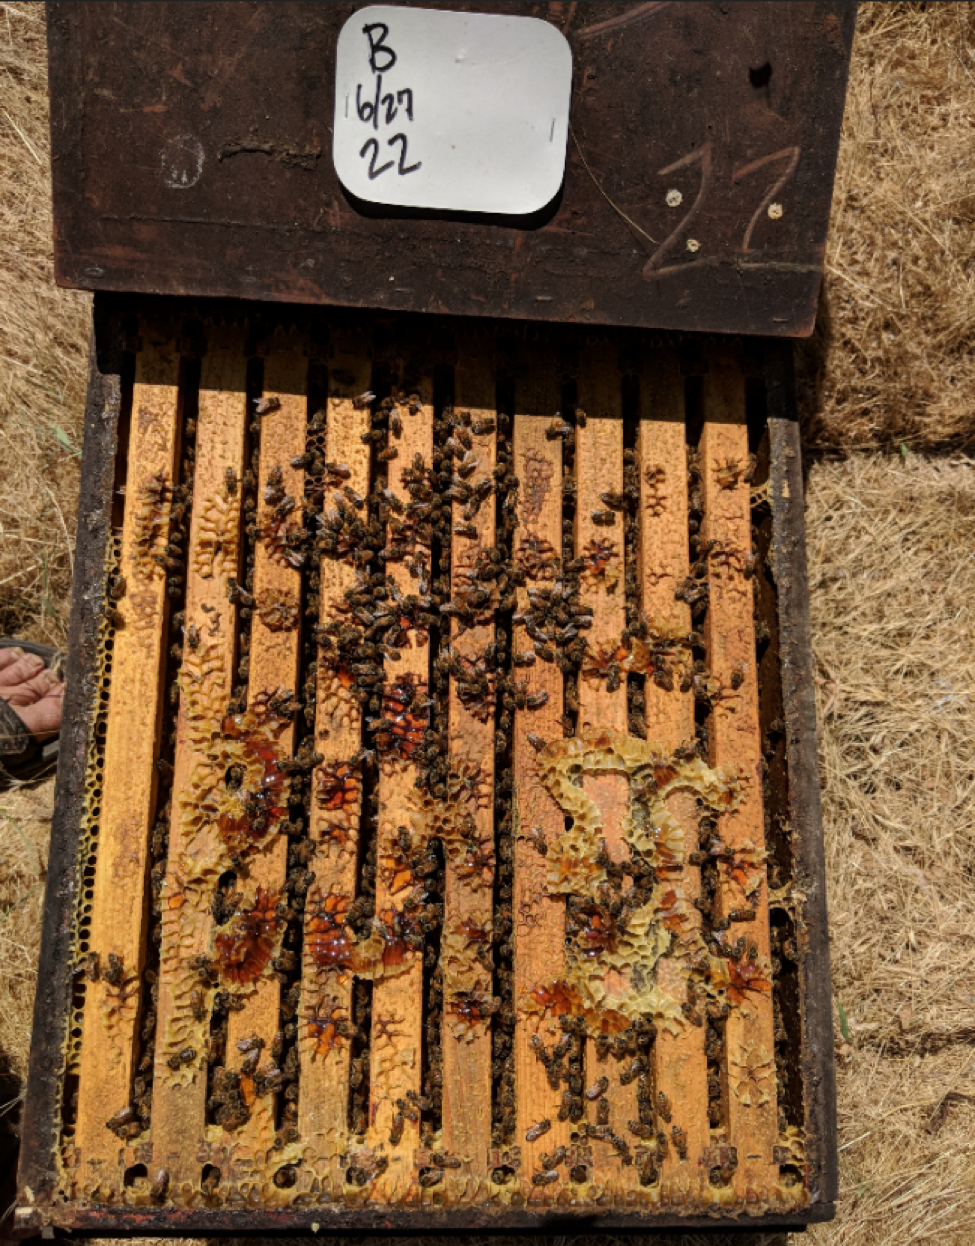
Figure 15. Some colonies completely removed every trace of the towels by Day 50. I only wish that this were true for all hives.

Figure 16. Alas, some colonies apparently have little interest in house cleaning, and barely remove any of the towel treatment. These residues scrape off easily, but are still acidic, so your hive tool needs to be rinsed afterwards.
The other shortcoming is that it takes at least 6 weeks to realize the full effect of the treatment. This is a treatment best used proactively, rather than after mite counts have already climbed to high. Don’t expect this treatment to quickly take care of high varroa infestations late in the season.
My feeling is that if we manage to get this application method approved for putting into our hives just before we add honey supers, it could be a godsend to us in our battle against varroa.
Moving on from Here
Let me be clear–I’m not stuck on the shop towels. Using vertical cardboard strips was simply too labor intensive for a large-scale beekeeper, but could be fine for a hobbyist. Another beekeeper outside the U.S. reported to me that they get better absorption with another brand of paper towels. I’m wide open to experimenting with other towel types or completely different matrices to hold the OA/gly solution.
As of now, it appears that the most promising formulation might be 1:1:0.5 (OA g: glycerin mL: water mL). This formulation would be a compromise between the efficacy of the C treatment and the handling characteristics of the D treatment, and would require 1 fully-saturated shop towel per hive. I have not yet tested this formulation.
For permitted researchers only
I’m getting requests from researchers worldwide about my methods. I’m including them here so that other researchers with proper permits can replicate my experiments. These instructions are only for the use by those with government approval to test this experimental application method.
Updated 28 July 2019–after preparing and applying 2000 towels this month.
We love the formula below as far as the texture and ease of applicability of the towels in the field! They peel off the roll nicely.
I’m also getting reports that this formulation may not work as well in humid areas. If you’re in a humid area and want to run a controlled experiment, please let me know.
Although there is great interest from beekeepers, this extended-release oxalic acid application method is not yet registered for use in the United States, and thus I do not condone or promote its use, other than for experimental purposes by those who have received written permission by their State Lead Agency. The formula that I plan to experiment with in 2019 is:
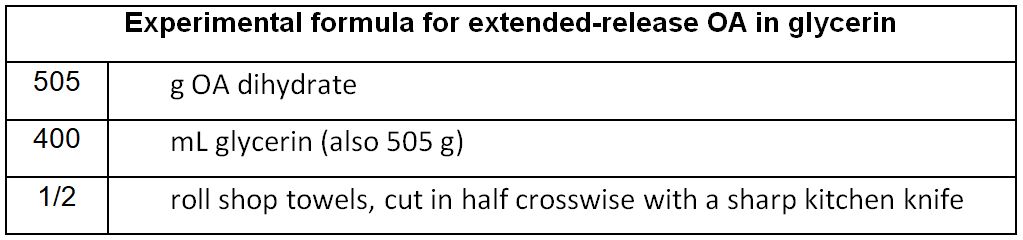 Note that the above ratio is equal parts of OA to glycerin, weight:weight.
How to prepare one or more half rolls at a time in an appropriately-sized saucepan. Each half roll will treat 27 hives. Use a small pan to prepare a single roll at a time, or a larger pan to prepare multiple rolls at one time. You can prepare as many rolls per batch as the saucepan can hold standing up in a single layer without crowding.
Safety: wear protective eyewear and nitrile gloves. The glasses are most important, since splashes do happen! If you get any solution on your skin or clothing, wash it off with warm water. A solution of baking soda in water will immediately neutralize any spills. In practice, we find it very safe to prepare towels by this method, using normal kitchen safety technique.
- Prepare the rolls of towels: cut the rolls of towels exactly in half (5 1/2 inches) with a sharp kitchen knife. Not necessary, but you can cut pieces of 1-1/4″ PVC pipe to slide into each towel roll.
Use a stainless saucepan/pot that has a copper bottom embedded in the stainless steel, which prevents hot spots — I suggest using a dedicated saucepan since it may discolor from the acid. Weigh/measure out as many multiples of the above formula as the number of half rolls that can easily fit in a single layer on the bottom of the saucepan (you want enough room that the rolls can be easily manipulated). You can of course prepare a single half roll at a time. Remove any towels from the saucepan before adding any ingredients.
Add the OA: to avoid splashing, first carefully pour the measured amount of OA into the pan.
Add the glycerin: then pour in the glycerin (the glycerin can be carefully pre-warmed to around 170°F in a microwave).
2. Turn on heat under the pan, and wearing safety glasses, stir gently until the OA crystals dissolve (use a dedicated stainless steel or plastic spoon). Make sure that you have a plate to act as a trivet next to the pan, onto which you can rest acidified utensils.
Tip: A potato masher helps for breaking up the clumps of OA as you are dissolving it.
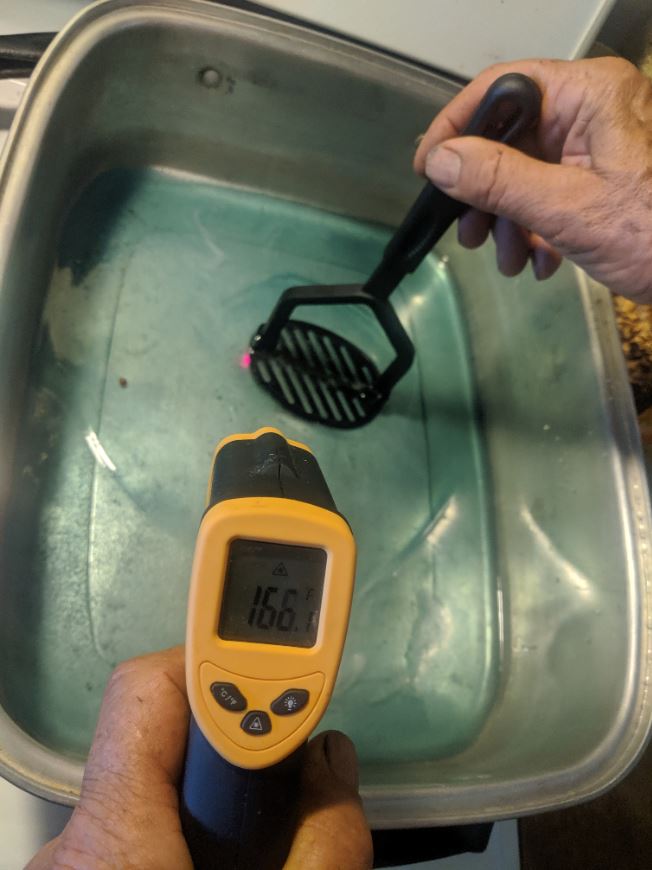
Once the crystals are nearly all dissolved, turn down the heat to prevent overheating. Do not allow the temperature of the solution to exceed 170°F (77°C). Overheating causes an unwanted chemical reaction that produces bubbles – if you see bubbles starting to bubble up, it’s too hot!
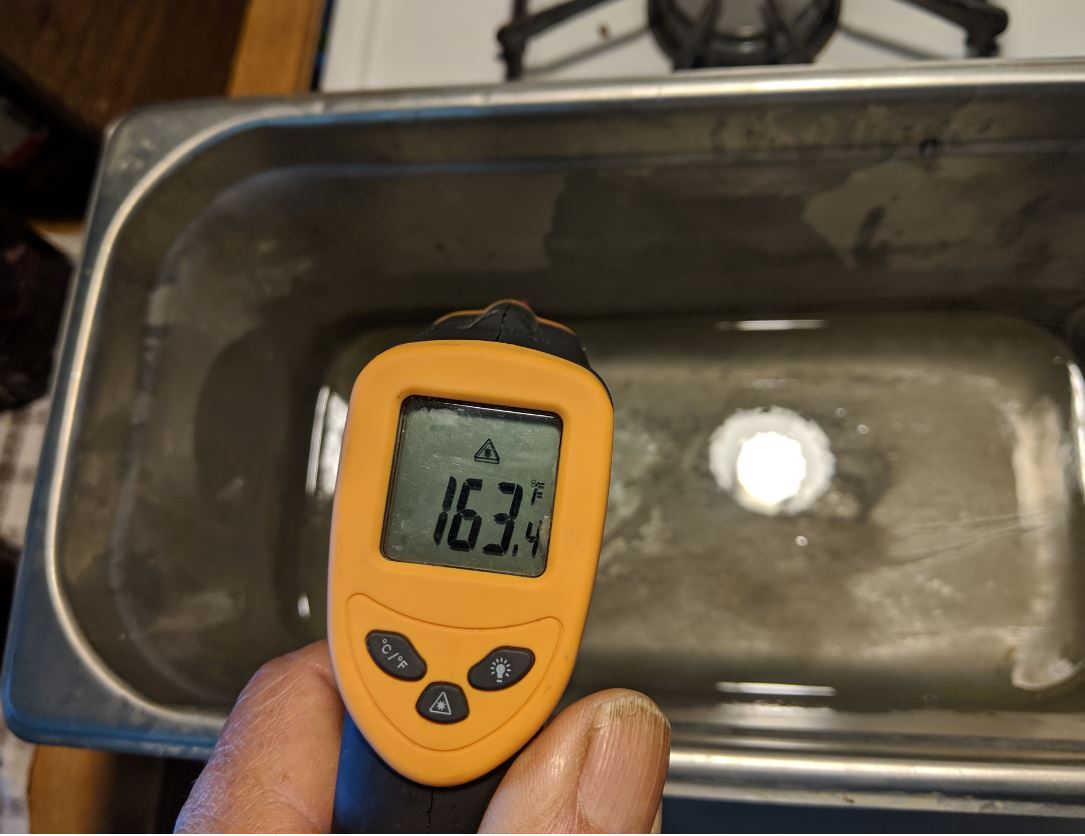
A digital infrared thermometer works great for keeping tab on the temperatures.
3. Once the crystals are completely dissolved, and the solution is crystal clear, bring it up to around 170°F and turn off the heat.
4. Preheat the rolls of towels: Place the half rolls of towels in a microwave for 30 seconds to preheat the towels (no longer than 30 seconds, as the microwave will char the inner towels, or perhaps cause them to burn). This formulation requires both the towels and the solution to be quite warm in order for the towels to fully absorb the liquid.
5. Place the roll(s) into the solution: Carefully stand the rolls on end in the pan–I use the potato masher to hold them in place. Be careful to avoid sudden movements or splashing!
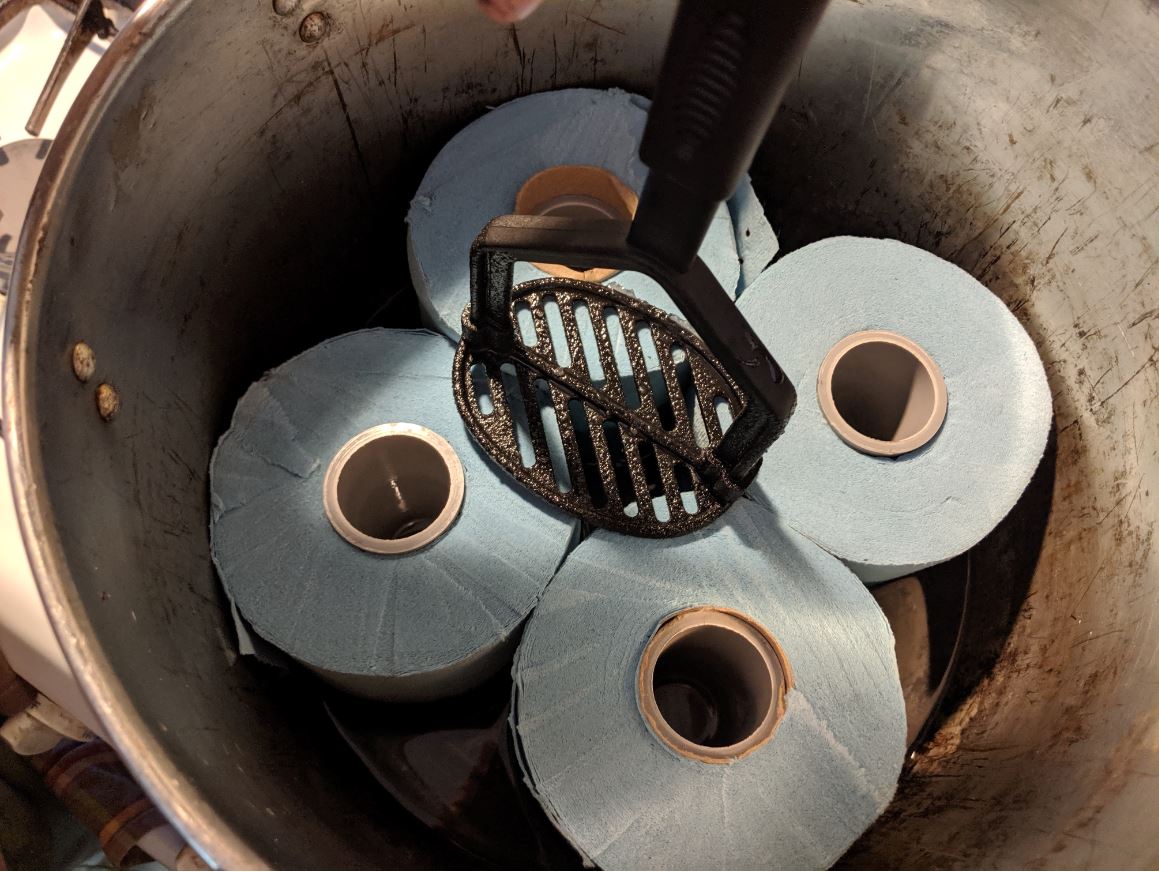 Here are four rolls placed into a pot of hot solution. This pot is too small, which makes the rolls difficult to manipulate or flip over.
Allow the rolls to absorb the hot solution: the OA/gly solution will wick up into the rolls, reaching 3/4 of the way up in a couple of minutes. At that point, we use kitchen tongs to carefully flip the rolls over to absorb the rest of the solution.
Optional: keep low heat on the pot during absorption, but don’t forget to keep an eye on the temperature, not allowing it to exceed 170°F.
Drain the towels: Once all the solution is absorbed, use tongs to place the rolls on a grid to drip off for about 30 seconds, then place the rolls on end in plastic tubs. At this time use the tongs or other utensil to make the rolls as round as possible, for easier removal of towels in the field.
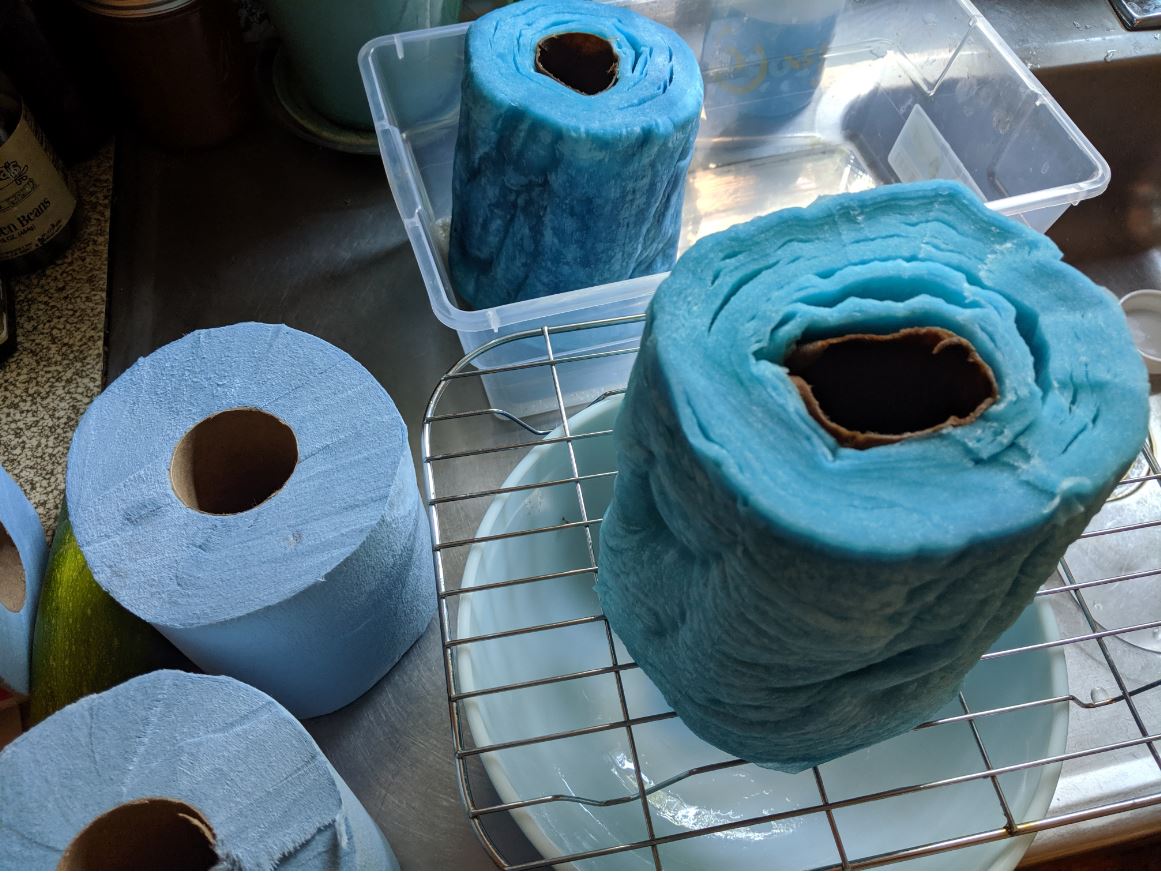
Here’s a towel draining on the rack (very little drips off) before placing it in a plastic tub for firming up, and then transport. I measured the gained weight of a number of rolls, and they were consistent enough for my purposes. This “saturate and drain” method is very fast.
I’ve been looking for a larger pot in which to prepare the rolls. Yesterday, Stephanie and I stopped at a yard sale, and bought a large Frigidaire Radiant Wall Broiler Grill and 2 Racks (for a dollar). These vintage pans are readily available on EBay.
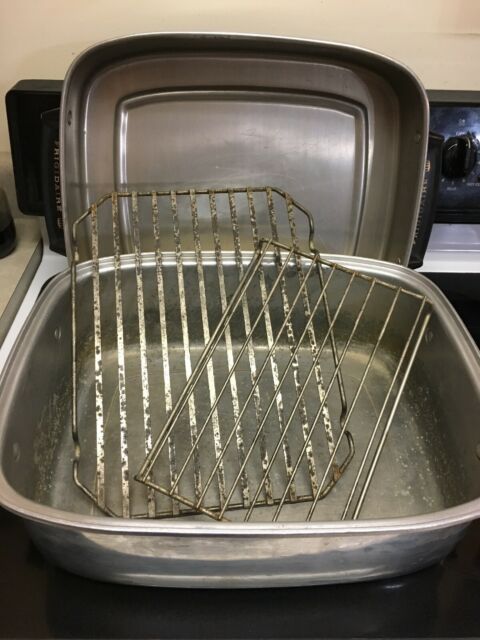
I was curious as to whether the acid would damage the aluminum, and whether the thin aluminum would apply even heat to the oxalic/glycerin solution, so I heated up some leftover solution:
Wow, very impressed! Even heat distribution when placed over two gas burners. I held the solution at around 170°F for several minutes (note the plastic potato masher for dissolving lumps of OA). There was minimal discoloration to the pan, so apparently scant chemical reaction. I don’t need to make any more towels for a while, but plan to use this pan in the future. The pan will hold 8 rolls at a time, and the lid and rack will make a great drain pan.
Flip and firm up the towels: allow the rolls to sit for a few hours or overnight. After a few hours, the OA will recrystallize, improving the texture of the towels for application in the field (they get more stiff and less “oily”). At this point, flip the towels over, and the remaining uncrystallized solution will equalize in the towels. See photo below.
Note the blue pigment line down the center of the towel above, indicating even distribution of solution from both ends of the roll. Also note the small brown circle of char typical from preheating the dry roll in the microwave.
Field application: Apply 2 half towels per dose between the brood chambers, leaving a bee space between the towels. This will apply a total dose of 18 g of OA.
Don’t expect immediate results—full mite control will take 6-7 weeks. Treatment can be repeated at 6 weeks.
Acknowledgements
Thanks to Maggi group for their initial work on this application method, to all the beekeepers who have donated to my research, to my sons and crew, my assistant Brooke Molina (who handles getting things done on the right dates, plus the mountain of data sheets), and my ever supportive wife Stephanie.
References
[1] https://scientificbeekeeping.com/beyond-taktic/
https://scientificbeekeeping.com/extended-release-oxalic-acid-progress-report-2/
https://scientificbeekeeping.com/extended-release-oxalic-acid-progress-report-3/
https://scientificbeekeeping.com/the-varroa-problem-part-15/
[2] Maggi, M, et al (2015) A new formulation of oxalic acid for Varroa destructor control applied in Apis mellifera colonies in the presence of brood. Apidologie 47(4): 596–605.
[3] In order to minimize the effect of outliers, we can use robust statistics, in which for “average” values we calculate the median instead of the arithmetical mean, and use the median absolute difference instead of the standard error of the mean.
[4] Using https://scientificbeekeeping.com/randys-varroa-model/
[5] I’ve created a handy calculator for the use by other researchers or citizen scientists at https://scientificbeekeeping.com/henderson-tilton-calculator/
First published in: American Bee Journal, October 2018
Contents
A Revisit of Sheesley and Poduska. 1
Sheesley and Poduska’s Data. 2
Sheesley’s Conclusion. 7
Citations and Notes. 8
Determining the Relative Value of Hives for Almond Pollination
First Published in ABJ October 2018
Randy Oliver
ScientificBeekeeping.com
As we approach time to line up almond contracts, we should be setting prices based upon hard data. Growers pay for fertilizer by the pound, water by the acre-foot, and for labor by the piece rate. So why the heck don’t they pay for pollination services in the same manner? In today’s almond pollination market, the best beekeepers are not being paid for what their bees are truly worth, and bargain-hunting growers are getting screwed.
Half my annual income comes from renting bees for almond pollination—I’ve been doing it for nearly 35 years. These past couple of years, we’ve finally broken through the “glass ceiling” of $200 for the rental of strong hives. This is because the supply of bees has barely kept up with the continually-growing demand for hives to pollinate California’s now more than 1 million acres of almond orchards. It’s not that beekeepers are gouging the growers—it’s just become more expensive to consistently produce strong hives by February 15th.
But not all growers are willing to pay $200, and some beekeepers (including myself) will take less for weaker colonies. The question then is, what are the relative productivities of colonies of various strengths as far as the pollination service that they provide?
The best agricultural management decisions are based upon sound interpretation of scientific data. Yet I again and again find almond growers basing their decisions upon advice derived from less-than-rigorous interpretation of a single landmark study done in 1970—that of Sheesley and Poduska [[1]]. For example, a 2017 publication from the University of California [[2]] stated:
In a 1970 study on colony size and pollen collection, the 8-frame colony did three times as much pollination work as the 4-frame colony. Beyond about 12 frames of bees, increased colony size does not seem to increase foraging.
Is it really true that an 8-framer is three times better than a 4-framer? Or that growers are wasting their money on colonies of greater than 12-frame strength? To see, we’ll need to perform…
A Revisit of Sheesley and Poduska
Sheesley performed a meticulous and labor-intensive study. The paper is open access, and is a worthwhile and easy read that gives you an idea of the state of almond pollination 48 years ago.
Practical application: it’s disappointing to see how little progress we’ve made in applying the authors’ excellent recommendations to almond pollination contracts.
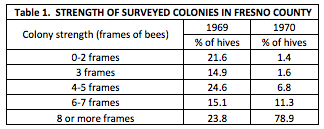
Briefly, they performed the study shortly after the California Beekeepers Association changed their minimum colony strength standard for almond pollination to 4 frames covered with bees. Their study also spanned one year in which colonies were relatively weak overall, followed by a season in which the hives were much stronger. I feel that it’s worthwhile to show just how much colony strength could vary from year to year then, as it does now, so I’ve copied their results below:
The authors explain:
Colonies were much stronger for almond pollination during 1970 than in 1969. A combination of three factors can be credited for this difference. Many beekeepers fed their colonies during the fall and late winter of 1969 to build colony populations for almond pollination. The late spring rains of 1969 in Fresno County provided more than the normal weed and range plant pollen and nectar sources. This allowed beekeepers to enter the 1969 winter with much stronger colonies than in the previous year. An awareness of the minimum colony strength standards adopted in 1968 in California may have encouraged the combining or culling of some colonies prior to the 1970 almond bloom period.
Practical application: beekeepers will provide what the growers demand and are willing to pay for.
The table above indicated that beekeepers could indeed supply strong hives in mid winter nearly half a century ago—but that was before varroa, and when there were only 1/7th as many bearing acres of almonds as there are today [[3]]. Strong colonies today don’t come cheap, and almond pollinators are forced to put more and more money into mite control, transportation, and feeding, as well as to continue to combine or cull weak colonies in order to meet the demand for 8-frame or better hives.
Sheesley and Poduska’s Data
The researchers used the amount of pollen collected by a hive as a proxy for pollination services rendered, and graded each hive at least four times in order to assign it an accurate strength, as determined by the number of frames covered with bees (standard California almond grading). I’ve retyped their data below:
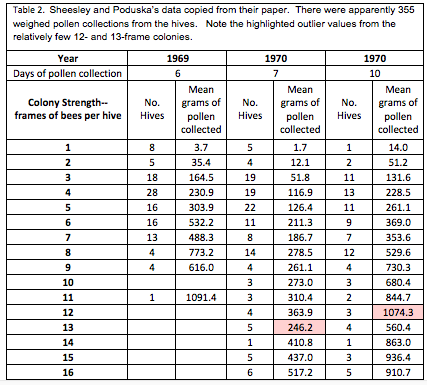
Note the two highlighted outlier values, based upon data from only 3 and 5 hives. Also note the far greater amount of data collected from hives of 8-frame strength or less, indicating that interpretation of data for that strength range will be more robust than for stronger hives. The human eye is not very good at interpreting a bunch of numbers in a table—we do a much better job with recognizing patterns when numbers are presented in graphical form, as in the chart below:

Figure 1. Although a column graph might actually be more appropriate for presenting this data, a line graph helps the eye to pick out the relationship between colony strength and amount of pollen gathered. Sheesley’s data was collected during three different time periods and conditions, and each data point is the mean of different numbers of hives. In 1969, overall colony strength was weaker—perhaps contributing to greater pollen collection due to less competition. The circled outlier values really show up, but they were taken from only a few hives. It’s outliers such as these that add to the difficulty of interpreting a data set.
In order to account for the seasonal differences, I adjusted the three data sets by dividing each set by the total amount of pollen collected the 4 – 11-frame colonies in that group. This allowed me to group all the data into one set for better analysis:
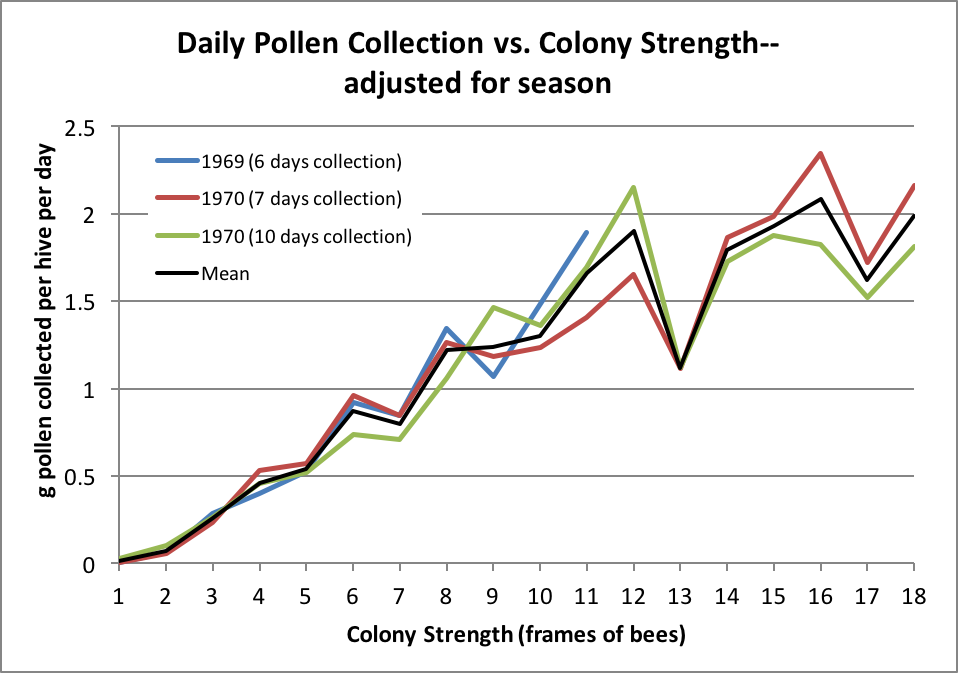
Figure 2. Seasonal adjustment makes the data less messy, and allows for generating trendlines. And that’s what we’re interested in—whether there is a predictable relationship between colony strength and the amount of pollination service performed.
Unfortunately, the adjusted data shown above still over-represents those outlier values from a relatively few 12- and 13-frame colonies. The data in Table 1 are the means of measurements from the indicated number of hives–thus we don’t know the degree of variation in the original data. As colony strengths increase, those means are calculated from fewer measurements, so there is more variability in them. Any beekeeper knows that there is tremendous hive-to-hive variation in performance; what I’m trying to do is to tease meaningful information from this data set.
Practical note: the more that an author “works” the data, and the more convoluted the statistics, the more leery I generally am of the interpretation. That’s why I’m walking you step by step through my analysis of this important data set.
So I reworked the data by weighting it—by plotting all 355 datums individually in the scattergram below. Although you can’t tell by looking at it, each point may represent up to 28 values [[4]]. By doing this, I could then have Excel calculate weighted regressions, which gave less weight to the few outlier values.
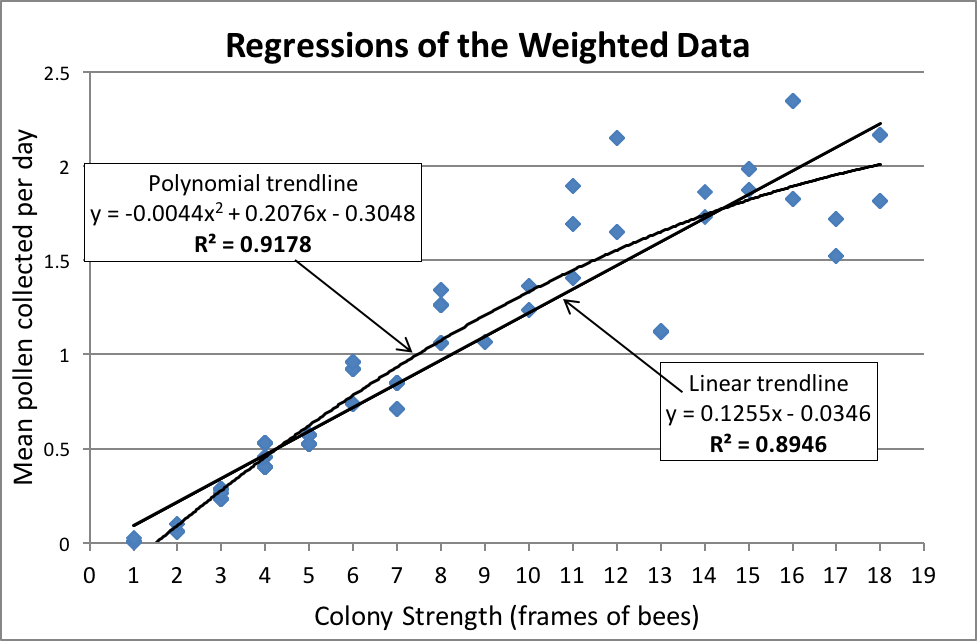
Figure 3. Now we’re getting somewhere! Note in the above scattergram that the relationship between colony strength and performance is essentially linear up through 16-frame strength. That said, I used the even better-fitting polynomial curve for further analysis, since it accounts for the changing brood-to-adult bee ratio over the range of colony strengths. Keep in mind that the data for colonies up to 8-frame strength is by far more robust than that for colonies of greater strength.
Note in the above chart the very high R2 values for both the linear and polynomial regression curves—indicating that the direct, and nearly linear, correlation between colony strength and pollen collection is quite strong (the higher the R2 value, the stronger the correlation, with a value of 1 indicating a perfect match). For general purposes, let’s look at the linear regression, which fits the data closely overall, as well as reflecting other data that I’ve seen [[5]]. In the table below, I’ve used its formula to show how easy it is, for practical purposes, to compare a hive’s pollination value relative to its frame strength:
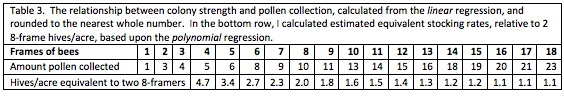 In the table above, compare the amount of pollen collected by a 4-frame colony as compared to that by 8-, 12-, and 16-framers. I calculated the equivalent stocking rates for use in drawing up pollination contracts.
Practical application: my analysis of Sheesley and Poduska’s data suggests that it has been widely misinterpreted. It certainly appears that there is a direct and nearly linear relationship between the number of bees in the hive and the amount of pollen collected, regardless of colony strength. Thus, an 8-framer provides roughly twice the pollination service of a 4-framer, and a 16-frame colony does as much work as four 4-framers. California’s favorite pollination broker, Joe Traynor, has long argued that one strong colony per acre may well provide adequate pollination services under most conditions.
OK, I finally got that off my chest! However, since the highest brood-to-adult bee ratio occurs in the 6 – 10-frame strength range [[6]], it would be biologically expected that colonies of that size would have the highest demand for pollen by both the nurse bees and the newly-emerging workers and drones, and thus be more efficient pollinators on a per-bee basis. This is reflected by the polynomial regression equation, which I then used for all following calculations.
Practical application: what both beekeepers and growers are most interested in are the relative dollar values for colonies of various strengths at providing pollination services. So let’s do the math.
As explained by Sheesley, almond growers may overpay for services when they rent weak colonies, as well as underpay when they rent very strong hives. So I plotted the dollar value of expected pollination service performed (as measured by amount of pollen collected) relative to colony strength, using the benchmark figure of $180 for 8-frame hives [[7]]:
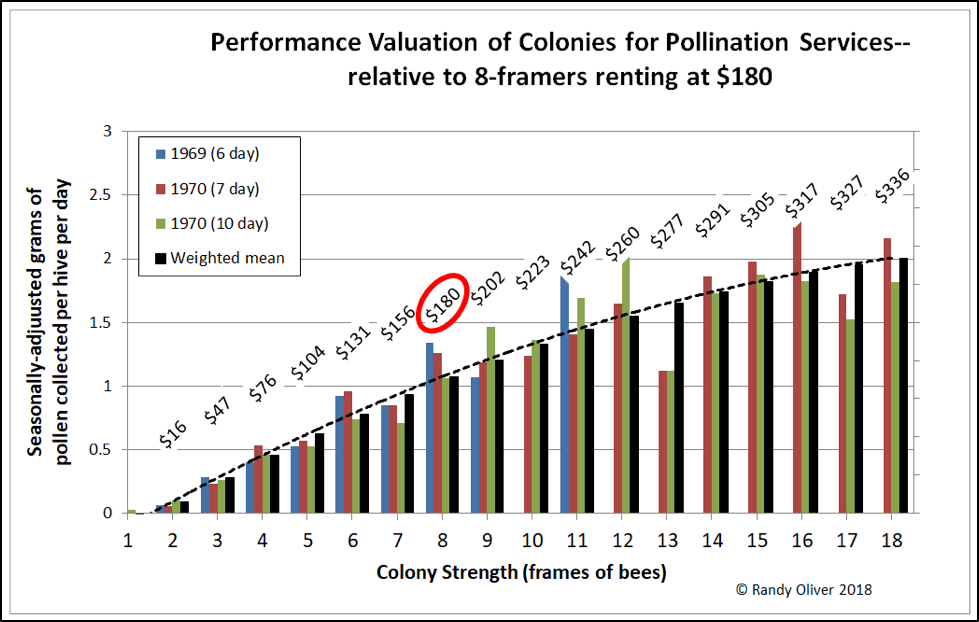
Figure 4. Assuming a benchmark rental rate of $180 for a colony of 8-frame strength, we can calculate the expected performance valuation for colonies of other strengths (shown as the dollar figures above each colony strength). It’s easy to see that growers these days are typically overpaying for 4 – 6-frame hives, and grossly underpaying those of us who provide colonies in the 12 – 16-frame range.
Practical application for almond growers: yes, it would be equally cost-effective for you to pay a beekeeper $240 per hive for 11-frame colonies stocked at 1.5 hives per acre compared to paying $180 for 8-framers stocked at 2 hives per acre. And the $240 for those 11-framers would be a much better deal than that “bargain” you got by paying $140 for 6-framers.
Sheesley’s Conclusion
Sheesley and Poduska didn’t elaborate on the interpretation of their findings to any great degree—the oft-repeated extrapolations appear to have grown with repetition, rather than being based upon detailed analysis. But way back in 1970, the authors were quite clear on one thing—that pollination fees should be based upon colony strength, rather than amount of woodenware delivered to the orchard:
Beekeepers who provide strong pollinating colonies need to be paid for the additional management expenses involved. Almond growers and beekeepers both can profit by adopting a multiple rental price structure for almond pollination based upon colony strength. It seems logical that written almond pollination agreements in the future should financially encourage the use of strong honeybee colonies.
Those words were written nearly 50 years ago! Why the heck doesn’t every grower pay on a minimum agreed-upon frame strength—I’ve filled such contracts for 35 years, but for some reason they haven’t caught hold in general. Those contracts call for a target stocking rate of frames per acre, and pay the beekeeper by the graded average frame strength actually delivered, with a maximum strength top out so that the grower doesn’t break his budget. Such a contract ensures that the grower gets exactly what he pays for, and that the beekeeper gets rewarded for the cost of preparing his hives prior to delivery. It’s a win-win for both players.
Take-home message to growers: for pollination services, pay for, and stock the orchard, by number of frames of bees per acre, rather than number of hives per acre. You and the beekeeper can both benefit from pollination contracts that make it worthwhile for the beekeeper to provide strong, healthy hives that will provide the best pollination services. And you can actually SAVE MONEY by paying for very strong hives, and stocking them at a lower number per acre.
Citations and Notes
My apologies for misspelling Poduska in the ABJ version of this article.
[1] Sheesley, B & B Poduska (1970) Strong honeybee colonies prove value in almond pollination. California Agriculture 24(8): 5-6. http://calag.ucanr.edu/archive/?type=pdf&article=ca.v024n08p5
[2] Connell, J (2017) Honeybees, Colony Strength, and Beekeeper Challenges. University of California Agriculture and Natural Resources http://www.sacvalleyorchards.com/almonds/pollination/honeybees-colony-strength-and-beekeeper-challenges/
[3] Johnson, DC (1987) Fruits and Nuts, Bearing Acreage, 1947-83. National Agricultural Statistics Service, U.S. Department of Agriculture. Statistical Bulletin No. 761.
CFDA (2018) 2017 California Almond Acreage Report https://www.nass.usda.gov/Statistics_by_State/California/Publications/Specialty_and_Other_Releases/Almond/Acreage/201804almac.pdf
[4] Each value represents the mean pollen collection for all colonies in that test group that were of the same frame strength.
[5] Oliver, R (2012) 2012 Almond Pollination Update. ABJ April 2012 https://scientificbeekeeping.com/2012-almond-pollination-update/
[6] See Fig. 3 in https://scientificbeekeeping.com/understanding-colony-buildup-and-decline-part-4/
[7] Goodrich, B & RE Goodhue (2016) Honey bee colony strength in the California almond pollination market. ARE Update 19(4): 5-8. https://s.giannini.ucop.edu/uploads/giannini_public/4c/be/4cbee741-f4aa-4f11-96bf-d8a84681051b/v19n4_2.pdf
First published in: American Bee Journal, September 2018
Contents
Defining our Objectives. 4
LIVE AND LET DIE “Bond Method.. 4
“NATURAL” Beekeeping.. 5
The Mutualistic Symbiosis Between the Bee and Humans. 6
Recreational Beekeeping. 7
“TREATMENT FREE” Beekeepers. 7
Eliminating the Fitness Benefit to the Varroa/DWV Complex Gained by Killing its host hive. 9
Darwinian Beekeeping. 9
The Dream of a “Gentler” Mite. 10
Impact upon other Beekeepers, Wild-type bees, and other Pollinators. 11
How to be a Part of the Solution. 11
Wrap Up. 16
Notes and Citations. 16
The Varroa Problem: Part 17c
Being Part of the Solution
First published in ABJ September 2018
Randy Oliver
ScientificBeekeeping.com
A question from an earnest beginning beekeeper recently hit home—“If I treat for mites, isn’t that a bad thing, since it slows down the evolution of the bee?” It pains me to see such well-intentioned beekeepers being racked with guilt, due to simple lack of understanding of the biological details involved in both creating and solving The Varroa Problem.
I use the term “scientific beekeeping” because I find it disturbing as to how much “information” given to beekeepers consists of a muddle of misinterpreted anecdotes, indiscriminant repetition of so-called “facts,” and the promotion of theories and practices lacking any supportive evidence. I can’t fault beekeepers for buying into the reasoning of internet beekeeping gurus who push idealistic arguments for why you need to keep bees this way or that, but I suggest that you instead ground your management practices in bee biology, rather than upon catchy names.
Beekeepers can rationalize anything they do, but as an industry, we truly need to address The Varroa Problem, and our part in creating the varroa/DWV Monster. One of my most common suggestions to those touting an idea, is to “think it all the way through”—to follow the logical outcome to the end. My hope is that by providing some graphics that detail the genetic consequences of our actions, we can then visualize the long-term genetic pros and cons of various management strategies on the evolution of The Monster.
Practical application: keep in mind that it is not varroa that kills a colony—it is typically a virulent strain of Deformed Wing Virus, vectored and facilitated by the mite. Once the infestation rate of varroa exceeds about 15% (~50 mites in an alcohol wash of ½ cup of bees), DWV tends to go “epidemic” in the hive, killing the developing brood (Fig. 1).
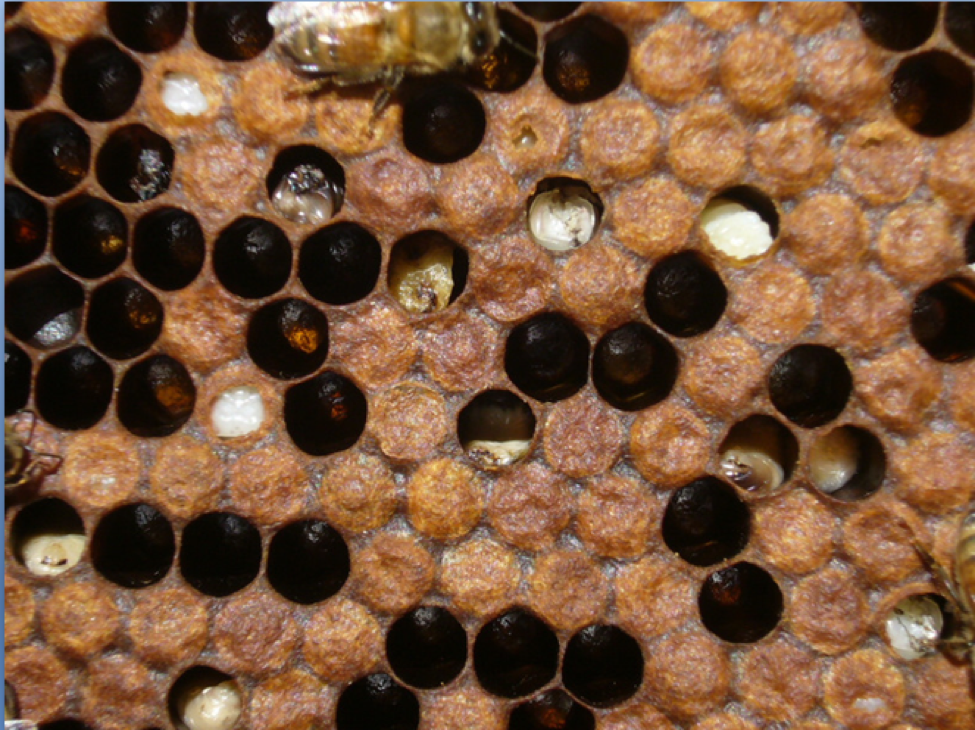
Figure 1. Brood exhibiting signs of Parasitic Mite Syndrome. This is an indicator that the colony doesn’t have much longer to live, unless varroa is immediately controlled. An important thing to keep in mind is that there may be no external indication that the colony is suffering, and one may not even notice any adult bees with deformed wings.
Once the brood starts to go, pretty soon the adult bees start to disappear (Fig. 2), indications being that some may drift to other hives,[[1]] carrying virus-vectoring mites with them. And when the colony can no longer defend itself, robbing foragers from other hives then unwittingly carry mites back to their own colonies.
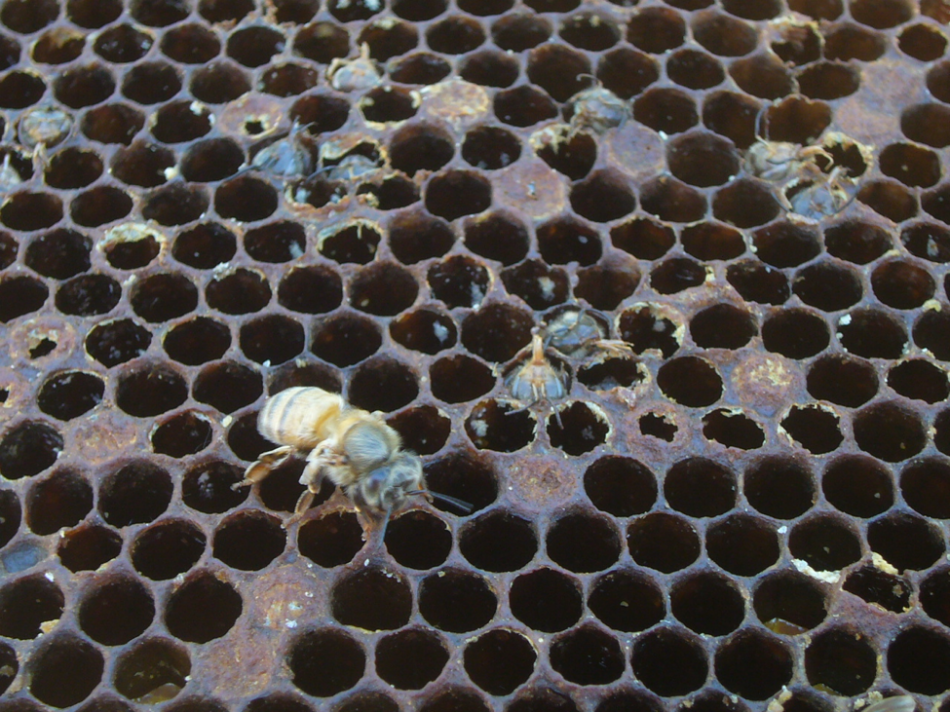
Figure 2: Too late—this colony has already collapsed—dispersing bees, mites, and whatever strain of virus that killed the colony to other hives within flight range. It is this dispersal that rewards The Monster for causing the death of a colony late in the season.
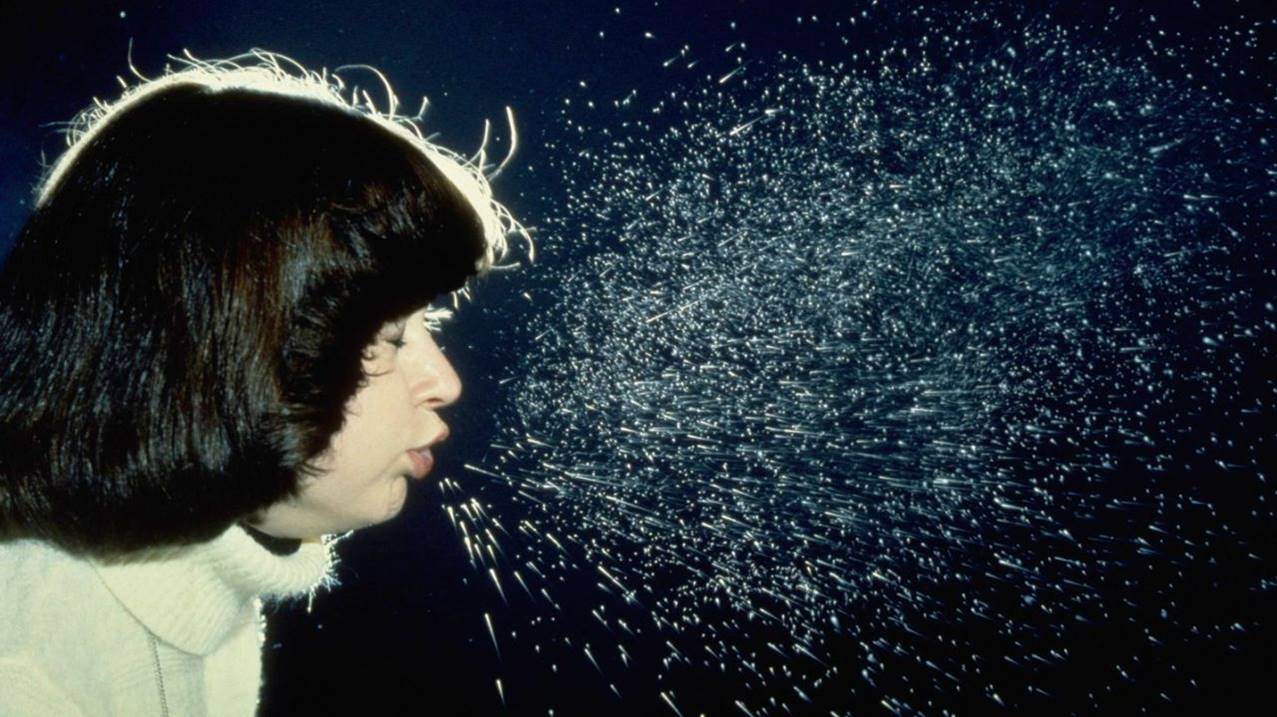
We beg people with a cold or the flu to cover their mouths when they sneeze in order to prevent the transmission to others of the virus strain that has infected them. Think of every collapsing hive as being a giant sneeze of virus-transmitting bees and mites.
A Recap: in the previous installment, I illustrated how in nature, without human intervention, natural selection would favor the evolution of varroa-resistant bees and avirulent virus strains. “Standard” beekeeping, involving varroa monitoring and treatment, is relatively neutral—it doesn’t make things worse, but certainly isn’t a part of The Solution, since it propagates non-resistant bee stocks, and depends upon repeated treatments. On the other hand, the lack of varroa control practiced by some “alternative” beekeepers may inadvertently favor The Monster, and be part of The Problem.
There are plenty of vociferous “alternative beekeeping” proponents who have somehow divined how we “should” keep bees. Keep in mind that it’s very difficult to reason a person out of a position that they didn’t legitimately reason their way into,[[2]] so I don’t expect them to change their tune; I’ll leave it up to my readers to decide for themselves whether they are being part of The Problem or part of The Solution, by “thinking it through to the end.”
Let me make clear that I’m in favor of experimentation to improve our beekeeping practices—I spend my life doing exactly that![[3]] But don’t pull the wool over your eyes just because something sounds good, or allows you to dispense with mite monitoring—instead, study the following graphics I’ve created, and pay attention to the genetic consequences of various beekeeping practices.
Defining our Objectives
With regard to solving The Varroa Problem, our objectives are straightforward:
- To shift the genetics of the managed honey bee breeding populations towards mite resistance, and
- To eliminate the fitness benefit to the varroa/DWV complex resulting from causing the death of their host colony.
So let’s see how various methods stack up in the graphics below—again, red indicates problematic non-resistant bees and virulent DWV; blue indicates mite-resistant bee genetics and less virulent DWV. Follow the genetic consequences from left to right.
LIVE AND LET DIE “Bond Method
One way to solve The Varroa Problem is to step aside and allow natural selection to do so (Fig. 3).

Figure 3. “Live and Let Die” survival selection. One brutal way to eliminate mite-susceptible bee bloodlines is by the “Bond Method.” A good deal of luck may be required and most of your hives may die, plus you may overwhelm your neighbors’ hives with mites.
No need to squint: I realize that these graphics may be difficult to read on the pages of ABJ, so I’ve posted them all in a larger format at https://scientificbeekeeping.com/scibeeimages/The-Monster.pdf.
Given several years, if we all practiced the Bond method, the only bees left alive would likely exhibit some form of mite resistance or tolerance. But nearly all professional beekeepers north of the 30th latitude would probably be out of business. The reality is that those of us who make our living by pollinating crops and producing honey simply cannot accept those kinds of losses, so IMHO, Bond is dead in the water, other than for researchers or affluent hobbyists.
Practical application: the Bond Method can work, but keep in mind that it is not necessary to punish the colonies in this manner—you can apply equally strong selective pressure by just pinching the queens that don’t make the grade. Then give the colony a second chance with a new queen.
“NATURAL” Beekeeping
Truly “natural” beekeeping would be akin to putting out manmade nest cavities for wild bluebirds to move into (Fig. 4).
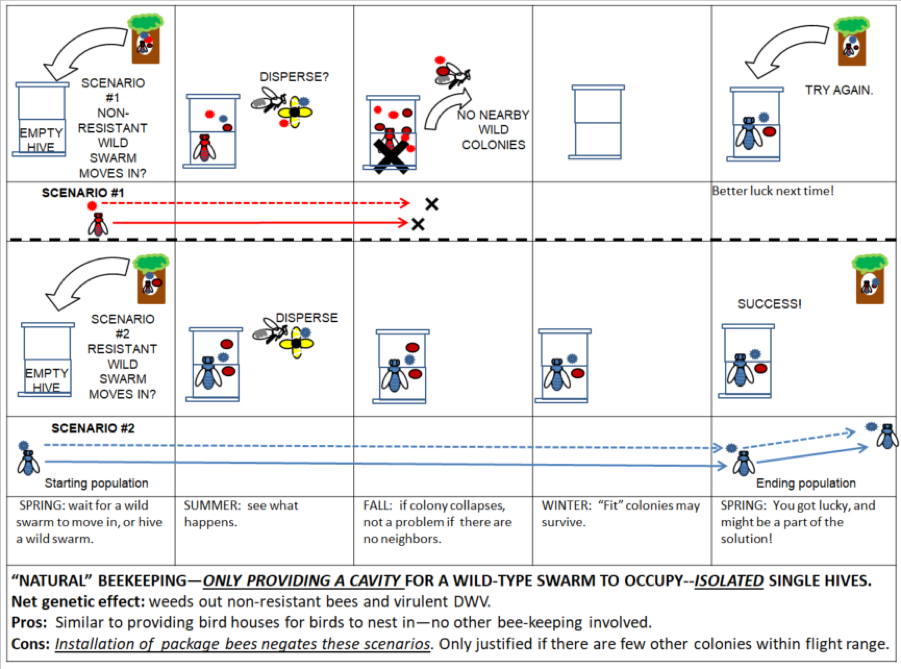
Figure 4. Similar to putting out a birdhouse, truly “natural” beekeeping would involve solely offering a cavity for a natural swarm to move into–if you were to stock the hive with bees from somewhere else, you’d then be introducing foreign genetics, as well as unnaturally increasing the density of colonies in the landscape, which would reward The Monster. If you’re lucky, you could be a minor part of The Solution.
But most beekeepers are going to want to keep more than a single hive in an apiary; this is where we become part of The Problem.
The Mutualistic Symbiosis Between the Bee and Humans
Humans were first predators of the honey bee, but then learned to enter into a mutualistic symbiotic relationship (not that the bees would ever notice). By providing the bees with protected nest cavities, and perhaps mechanical migration and/or supplemental feeding and parasite control, both species can benefit. But such benefits may come at a cost to the bee when the unnaturally-maintained density of colonies in the landscape allows for the enhanced transmission of parasites (Fig. 5).
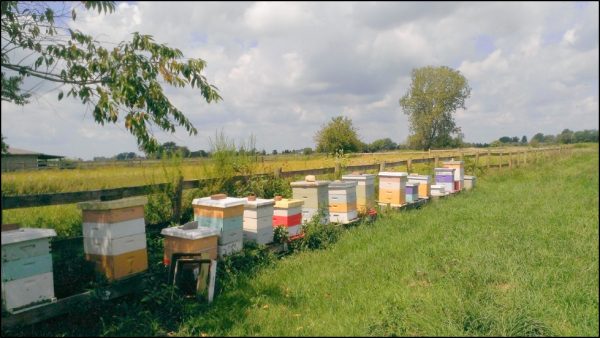
Figure 5. The Varroa Problem is a result of us consistently restocking unnaturally high numbers of honey bee colonies per square mile. Since we will undoubtedly continue to do so, it then confers upon us the responsibility to minimize the transmission of parasites among those hives.
Today’s better professional beekeepers don’t lose many colonies to varroa, mainly by virtue of the application of miticides (whether synthetic or “natural”). Such effective mite management minimizes the reproduction and dispersal of mites and virulent DWV. Unfortunately, it also confers a fitness advantage to any mite that carries an allele that provides resistance to that miticide. Thus, we must consider chemical control of varroa to be a stopgap measure.
But that stopgap measure is still working for the time being. As I showed in Fig. 5 of my last installment, those professional beekeepers who follow best management practices, while not being part of The Solution, are not necessarily part of The Problem, so can be let off the hook for the time being.
Practical application: the beekeepers who are seriously part of The Problem are those, whether large-scale or small, whose poor management unintentionally allows collapsing hives to disperse the most virulent combinations of varroa and DWV to their neighbor’s apiaries in late summer—this is irresponsible and indefensible. But the distressing thing is that there is another group of beekeepers who, while thinking that they are doing good, are actually just as much a part of The Problem.
And this brings us to the subject of the evolution of the fourth player in this game—the population of human bee-keepers.
Recreational Beekeeping
When I was younger, the main reason that people were interested in beekeeping was for honey or pollination, or simply to enjoy the quirky hobby of keeping stinging insects. The local bee club would be populated by aging suburban males. But that population started to change once bees made the papers in the mid 2000’s due to CCD. Recreational beekeeping exploded, and the demographics of the current beekeeper population has now shifted to include a much larger proportion of younger males, females, and urbanites, often motivated by idealism, or the commendable desire to get more in touch with nature. But many of these individuals simply want to “have” bees, rather than commit to the effort involved in being a good bee-keeper.
Such neglectful husbandry, or “bee having,” used to work just fine—before varroa entered the picture. But now it has evolutionary consequences upon the genetics of the honey bee, varroa, and DWV, as well as appreciable biological impacts upon neighboring beekeepers and native pollinators. Unfortunately, many idealistic and well-intentioned beginning beekeepers think that some sort of magic is going to transform the coddled package bees that they just purchased into tough varroa-resistant survivors simply because they call themselves…
“TREATMENT FREE” Beekeepers
Contrary to the old-school beekeepers who managed their bees as livestock, many recreational beekeepers today instead practice some combination of uninformed wishful thinking, hard-core internet dogma, or simple, neglectful husbandry. I live in a rural area, and anyone who does not care properly for the animals that they keep soon makes the local paper with a charge of animal abuse or neglect—unfortunately, this is not the case with beekeepers.
Practical application: I hate having to treat my hives to manage varroa, but have not yet been able to breed bees that can consistently handle the job themselves. So we treat when necessary. I can understand wanting to be “chemical free” and do avoid the comb-contaminating synthetic miticides, so I reach a happy compromise by using organic acids and thymol to control varroa. Most important to us is to take good care of our bees—very few of our colonies ever die from varroa/DWV.
We produce thousands of nucs each season, headed by vigorous and lovely hand-reared young queens. It breaks our hearts to know that some of our buyers will not manage varroa, and that our beautiful young colony is thus doomed to die an untimely and grisly death due to lack of proper care. The saddest part is that those beekeepers truly believe that they are somehow “helping the bees” (Fig. 6).

Figure 6. Treatment-free beekeeping. Although done with the best of intentions, the end genetic result of going “treatment free” with commercial bee stock is exactly the opposite—it actually confers a fitness benefit to the most virulent mites and DWV. However, by taking steps to prevent those untreated colonies from collapsing, the beekeeper could instead perhaps be part of The Solution.
Ways to improve: start with resistant stock (support your local breeders), monitor varroa, treat or euthanize mite-infested colonies before they collapse and spread mites and DWV strains to surrounding colonies. Explain the flaws of this dogma to others—there is no reason to think that commercial stock maintained with miticides will suddenly transform into resistant bees because you wear the “Treatment Free” hat.
Practical application: if you are a recreational beekeeper, and stock your hives with local swarms or cutouts, there is a possibility that you might get lucky and chance upon some bees with a degree of mite resistance. But it would have been natural selection of the wild-type breeding population that favored those genetics, not your beekeeping. To the contrary, you can set that evolutionary progress back when you artificially increase the density of the host (bee) population by adding to the number of colonies per square mile. If your colonies then collapse from the varroa/DWV Monster, you’d be contributing to The Problem in the local wild-type bee population.
I’ve got nothing against the goal of treatment-free beekeeping—we’d all love for that to be a reality. There are a number of relatively-isolated “treatment-free” beekeepers who claim acceptable colony loss rates (treatment-free success is much easier if you’re in an area where there are long brood breaks, and few other beekeepers around). But if you’re not isolated, flooding the environment with mites and DWV from collapsing colonies has indefensible ramifications upon surrounding beekeepers, the wild-type bee population, and perhaps native pollinators. Repeating the same mistake year after year by restocking with package bees and hoping that some miracle not involving varroa treatment will happen is a fool’s errand, and favors The Monster.
The unfortunate fact is, that many of today’s recreational beekeepers are simply too uncomfortable handling bees to perform realistic varroa assessments. So they create an excuse for not doing so by adopting the alluring “treatment free” moniker. My plea is for all beekeepers to question dogma, and instead make the effort to understand the genetic consequences of your beekeeping decisions. The most important thing to do is to stop rewarding The Monster by:
Eliminating the Fitness Benefit to the varroa/dwv complex gained by killing its host hive
You may not be able to control how many hives there are within a 2-mile radius of your apiary, but it is within every beekeeper’s ability to prevent uncontrolled mite buildup and the resulting collapse. Noted bee behaviorist Dr. Tom Seeley makes this point clear in his article on Darwinian beekeeping [[4]].
To help natural selection favor Varroa-resistant bees, you will need to monitor closely the mite levels in all your colonies and kill those whose mite populations are skyrocketing long before these colonies can collapse. By preemptively killing your Varroa-susceptible colonies, you will accomplish two important things: 1) you will eliminate your colonies that lack Varroa resistance and 2) you will prevent the “mite bomb” phenomenon of mites spreading en masse to your other colonies. If you don’t perform these preemptive killings, then even your most resistant colonies could become overrun with mites and die, which means that there will be no natural selection for mite resistance in your apiary. Failure to perform preemptive killings can also spread virulent mites to your neighbors’ colonies and even to the wild colonies in your area that are slowly evolving resistance on their own. If you are not willing to kill your mite-susceptible colonies, then you will need to treat them and requeen them with a queen of mite-resistant stock.
Practical application: It’s Seeley’s last sentence that is most important; unfortunately, many well-intentioned “treatment free” beekeepers overlook the critical need to thwart the dispersal of The Monster.
Darwinian Beekeeping
Below I’ve illustrated a small Darwinian apiary, in which the beekeeper performs a preemptive killing of a mite-infested hive (Fig. 7). Keep in mind that Seeley is clear that the preemptive killing of the entire colony is not necessary—you also have the option of treating the hive and replacing the queen (not shown).
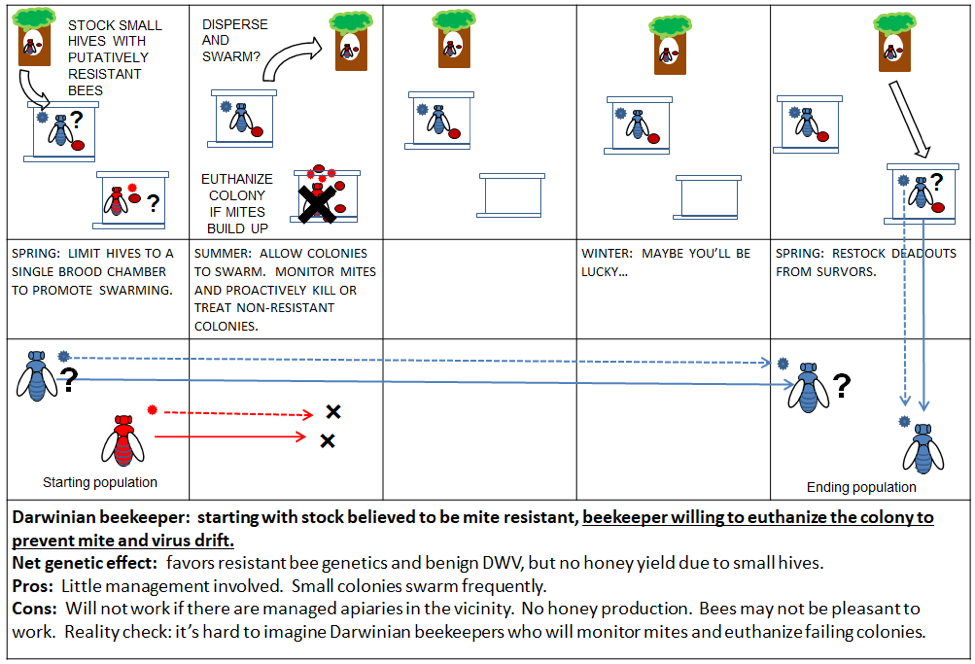
Figure 7. By restricting the cavity size, you minimize the amount of brood and encourage repeated swarming—such colonies may thus be able to tolerate varroa and survive. Given enough time, Darwinian beekeeping may also select for resistance.
As Seeley points out, our large hives and non-resistant bee stock are very favorable to varroa reproduction, so mimicking how colonies survive in the wild is an option for beekeepers. I do question, however, whether most Darwinian beekeepers will actually monitor varroa buildup and preemptively kill their colonies prior to collapse. And others have asked, what’s the point of keeping these tiny colonies if you can’t harvest honey or keep enough hives in an orchard for effective pollination?
The Dream of a “Gentler” Mite
The varroa mite exists in a well-established host-parasite relationship with its native host Apis cerana, in which there is little if any fitness benefit derived from killing its host colony. When we inadvertently introduce varroa to Apis mellifera [[5]], some strains of mites may adapt to a new niche—one with a vast new food resource—closely-located hives full of worker brood [[6]]. Varroa continues to adapt to utilizing worker brood as food,[[7]] so it will be up to A. mellifera in turn to adapt to its new parasite (which it is able to do if humans don’t intervene).
The thought of varroa evolving into a “gentler” mite is a pipe dream—keep in mind that at one time there were two strains of varroa in the Americas—the Korea haplotype and the more benign Japan haplotype. The more “virulent” Korea strain quickly outcompeted and displaced the more benign one.
Due to our movement of queens, packages, and hives, we beekeepers homogenize and disperse varroa bloodlines throughout the country (along with the DWV strains that they carry). I don’t see this situation changing, so it’s likely safe to assume that we beekeepers will inevitably confer a fitness advantage to those strains of mites that are most successful at reproducing in our hives.
Practical application: our established beekeeping practices will always favor the mite bloodlines that are most successful at reproduction and most resistant to miticides, and we will spread those mites everywhere. Just accept this as a given.
Therefore, it’s a no-brainer that we need to step up our efforts to breed for varroa resistant bees.[[8]] Natural selection would do the job for us if we just got out of the way, but our commercial industry would have a hard time taking the hit during the transition. So until truly resistant bees stocks become readily available, we need to focus on management practices that don’t reward The Monster.
Impact Upon other Beekeepers, Wild-type bees, and other Pollinators
And as elucidated by Graystock,[[9]] the pathogens infecting honey bees easily transmit to and from other pollinator species via visited flowers. And collapsing hives very effectively disperse both varroa and virulent strains of DWV to all surrounding colonies—whether managed or wild type. This has major evolutionary implications.
Practical application: as pointed out by Dr. Samuel Ramsey, you are your brother’s beekeeper– even though there may be a thousand beekeepers in an area, the bee population as a whole is like one big apiary due to the proximity of the hives to one another.
Because many recreational beekeepers these days typically have high rates of colony loss due to varroa/DWV and then repeatedly restock with domestic package bees, we are inadvertently perpetuating a strong fitness advantage for the varroa/DWV Monster.
How to be a Part of the Solution
Allow me to reiterate our two objectives:
- To shift the genetics of the managed honey bee breeding populations towards mite resistance, and
- To eliminate the fitness benefit to the varroa/DWV complex from causing the death of their host colony.
(1) SHIFTING BEE GENETICS TO MITE RESISTANCE
It’s time for some straight talk about shifting the genetics of the honey bee population, as this is where many recreational beekeepers delude themselves. It does no good whatsoever to simply allow non-resistant package bee colonies to die from varroa/DWV (Fig. 6). Neither does it have any appreciable impact upon the honey bee breeding population even if you are lucky enough to identify the rare colony that exhibits mite resistance, unless you then manage to rear hundreds or thousands of daughters from that queen.
Practical application: I hate to pop the that balloon, but no matter how well-intentioned you are, the small-scale beekeeper has virtually zero chance of changing the genetics of any breeding population unless he/she collaborates with a large queen producer.
Such collaboration could consist of letting a queen producer know that you’ve identified a colony that has kept varroa under control for at least a full season. But for most beekeepers, you can exert the most influence by voting with your dollars.
Practical application: with regard to shifting the genetics, this can only happen by changing the market demand for queen bees. So long as beekeepers are willing to pay queen producers for whatever kind of non-mite-resistant queens are available, there is no reason to expect the producers to make the effort to realistically select for mite resistance. Support any breeder who is engaged in a serious program to select, propagate, and sell tested stock that exhibits resistance to varroa. Keep in mind that it is always the consumer that drives any market—when queen buyers finally start to demand mite-resistant stock before they part with their dollars, the queen producers will respond in a heartbeat.
The USDA is currently collaborating with a large-scale queen producer to bring tested mite-resistant VSH queens to the market. There are others who claim to have mite resistant stock, but until we come up with a testing organization, you’ll need to monitor varroa levels in your hives, and let others know if someone is producing stock that exhibits resistance to varroa in your region.
The bottom line is that there is little that the small-scale beekeeper can realistically hope to do with regard to shifting the genetics of any bee population. That is not to say that a local population may not exhibit some degree of mite resistance. If you’re unable to obtain truly mite-resistant bee stock, then you can still be part of The Solution by:
(2) ELIMINATING THE FITNESS BENEFIT TO THE VARROA/DWV COMPLEX FROM CAUSING THE DEATH OF THEIR HOST COLONY.
Without the resulting late-season dispersal/transmission of virulent mites and virus strains, there would be no fitness benefit conferred upon the varroa/DWV Monster from killing its host colony. You can avoid being part of The Problem by not rewarding the varroa/DWV Monster for doing so. Allow me to repeat myself:
Think of every collapsing hive as being a giant sneeze of virus-transmitting bees and mites.
Update 25 May 2019: recent research by myself and others indicates that in some areas, mite and virus drift occurs in conjunction with the robbing out of collapsing hives; in other areas it appears to be more of a function of the drifting of mite-carrying bees from one hive to another. In either case, substantial mite drift can occur in late season.
When you allow a hive to collapse from varroa/DWV, you spread those parasites to all neighboring hives for at least a mile in all directions. Please be a responsible beekeeper! Photo credit Lester V. Bergman.
Along with being part of the beekeeping community comes the responsibility to do everything you can to prevent the transmission of virulent mite and virus strains to others.
I’ll end this article with an illustration of how any beekeeper can help to both shift the genetics of our bees to resist varroa, and at the same time remove the reward to the varroa/DWV Monster from causing colony death (Fig. 8).
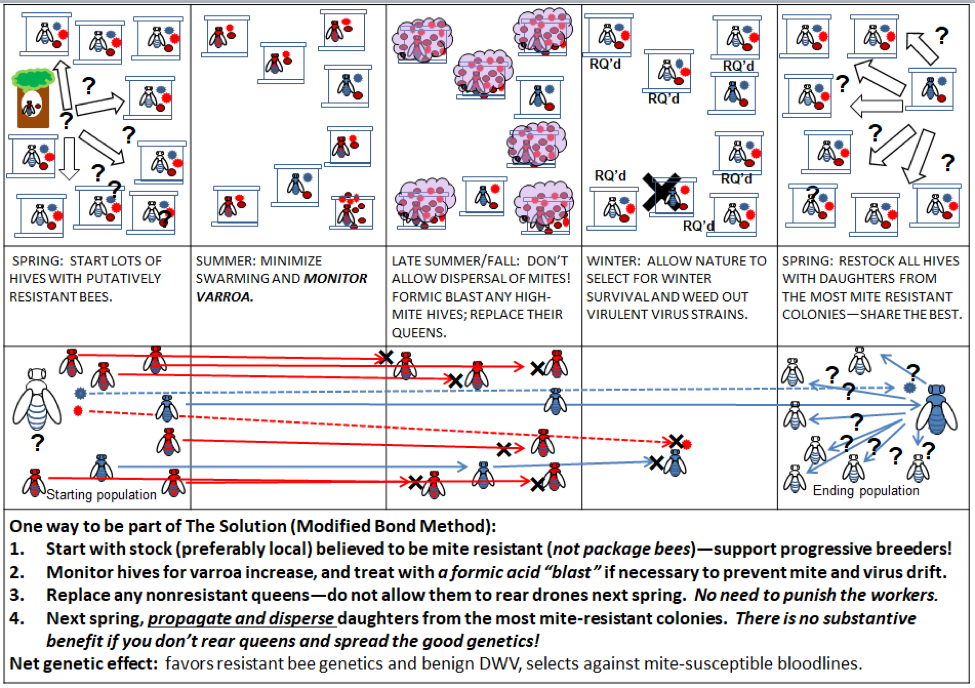
Figure 8. Thanks to Dr. John Kefuss for promoting his “Modified Bond” method, of which this is a variation. No colonies need to be sacrificed—all can be productive. The only costs are minimal mite monitoring, application, if necessary, of a non-contaminating strong formic acid “blast,” and the relatively minor cost of rearing replacement queens. Pros: no loss of colonies, honey production, no comb contamination, live colonies for nucs next season. Everyone benefits! Cons: Minor expenses of monitoring, treatment, and queen replacement.
In the above illustration, the beekeeper proactively steps in to prevent any colonies from collapsing and dispersing mites and DWV, and requeens (with potentially resistant queens) any colonies that don’t pass the test. The beekeeper can be every bit as ruthless as nature is in the Bond Method, but no colonies need to die—it is only the genes of nonresistant queens that need to be eliminated. No combs are contaminated with miticides, since formic acid leaves no residues.
Practical application: in our own operation, we’ve found that the cost of checking every hive for its varroa level prior to supering up for honey more than pays for itself in savings in mite treatments, the maintenance of nonproductive hives, and by eliminating most all colony losses (other than from queenlessness). Other than the minimal-mite potential breeders, we treat all the other hives (with thymol and/or oxalic acid) to keep varroa under control, and use a formic blast (Fig. 9) to eliminate the mites (and generally the queen) from any high-mite outliers.
A suggestion: instead of wearing an anti-treatment hat, swap it for a pro-genetic improvement hat.
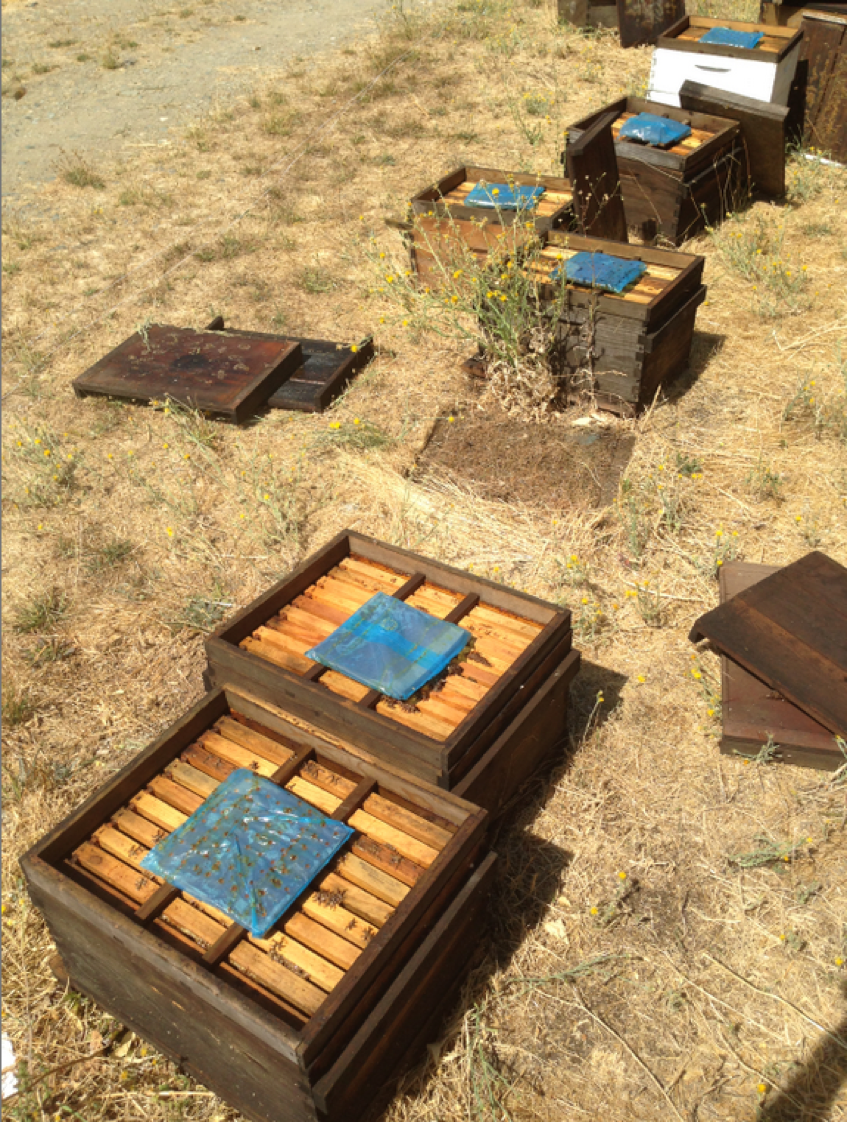
Figure 9. Here, after removing any honey for extraction, we’ve broken down the high-mite hives into singles. We then apply a formic blast (in hot weather) to kill nearly every mite in the hive (we’re using leftover MiteAway II pads in this photo). We can use a strong dose, since we are not trying to save the queens, and have already pulled the honey.
Practical application: a very effective way to eliminate varroa from an infested hive is to break it into singles, and apply 300 mL of time-release 65% formic acid to each box (home-made pads in Ziploc bags with punched holes, or 3 MAQS). This treatment, even in hot weather, kills only a few workers and young larvae (and generally the demoted queen), but eliminates virtually all the mites within a week. The formic acid then quickly evaporates, leaving no residues, and the hive can then be given a new queen [[10]].
Wrap Up
I appreciate the enthusiasm of today’s new beekeepers, and their desire to help our bees to deal with varroa. And I can’t think of any commercial beekeeper or bee breeder who wouldn’t love to be able to dispense with varroa treatments. I hope that this lengthy article helps us all to make biologically-informed decisions as to how each of us can realistically be part of The Solution, or at least not contribute further to The Problem. To that end, I’ve offered examples of how to evaluate the evolutionary consequences of various varroa/virus management and bee-breeding strategies—please evaluate your own!
My dream is that before I die, I can again enjoy being a successful “treatment free” beekeeper. But it’s not gonna happen as a result of wishful thinking or simple luck—it’s gonna take work, and a realistic commitment to shifting the genetics of entire breeding populations. I encourage all beekeepers to be part of The Solution—first, by monitoring varroa and preventing the collapse of their hives due to DWV, and second by putting the pressure on queen producers to start offering bee bloodlines confirmed by testing to exhibit resistance to varroa. Every beekeeper should be on the lookout for the rare colony that can handle mites on its own, and should they identify one, make sure that someone produces hundreds of daughters from that queen.
And please give your support to the dedicated and hard-working bee breeders worldwide who are engaged in serious programs involving selection for regionally-adapted mite-resistant bees.
Notes and Citations
[1] We clearly need more research in this area—I’ve set up a field experiment to collect supportive data this fall.
[2] I lifted this observation from the excellent book Bad Science, by Ben Goldacre (2008) Faber and Faber. I recommend that every beekeeper read this book before they buy any of the “hive health” products offered for sale without high-quality field data in support of their claims.
[3] My beloved wife Stephanie strongly confirms this point.
[4] Seeley, T (2017) Darwinian beekeeping: an evolutionary approach to apiculture. ABJ 157(3): 277-282. https://www.naturalbeekeepingtrust.org/darwinian-beekeeping
[5] The Korea haplotype of Varroa destructor is currently the most problematic varroa strain worldwide. But other strains of both V. destructor and V. jacobsoni appear to be adapting to parasitize Apis mellifera in different Asian countries. Any of those strains has the potential to become as problematic as the Korea strain.
[6] A resource not available for exploitation in A. cerana due to the intolerance by the A. cerana larva to varroa (apparent self-sacrifice in response to a varroa salivary protein).
[7] I find two recent papers of interest, as researchers study the genetic adaptation of V. jacobsoni to A. mellifera. I’d be very curious to see similar analyses for V. destructor.
Roberts, JMK, et al (2015) Multiple host shifts by the emerging honeybee parasite, Varroa jacobsoni J. Molecular Ecology doi: 10.1111/mec.13185.
Andino, GK, et al (2016) Differential gene expression in Varroa jacobsoni mites following a host shift to European honey bees (Apis mellifera). BMC Genomics17:926.
[8] “Traditionally, the terms “queen rearing” (the propagation of queens) and “bee breeding” (the evaluation and selection of breeding stock) have been used interchangeably in the beekeeping community. These are very different aspects and require different skills, knowledge, and practices….Scientific bee-breeding programs have largely been dependent upon institutional and government support. Frequently subject to short-term funding programs that have been turned over to the industry have historically lacked oversight and soon become unrecognizable. Without a long-term commitment and supporting resources, selection efforts are relaxed and gains are quickly lost.”—Cobey, SW, WS Sheppard, and DR Tarpy (2012) Status of breeding practices and genetic diversity in domestic U.S. honey bees. In Honey Bee Colony Health, CRC Press.
[9] Graystock,P, et al (2015) Parasites in bloom: flowers aid dispersal and transmission of pollinator parasites within and between bee species. http://rspb.royalsocietypublishing.org/content/282/1813/20151371
Graystock,P, et al (2016) Do managed bees drive parasite spread and emergence in wild bees? International Journal for Parasitology: Parasites and Wildlife 5(1): 64-75. Open access.
[10] In our operation, we already have singles with new queens ready, just waiting for the blasted and queenless second brood chambers to be added to them.
First published in: American Bee Journal, August 2018
Contents
A Primer on the Drivers of Evolution. 2
Defining the Niche. 2
The Breeding Population. 3
The Honey bee Populations in the U.S. 4
Reproduction and Dispersal 7
Acknowledgements. 9
Notes and Citations. 9
The Varroa Problem: Part 17b
The Evolution of Bees, Mites, and DWV
First Published in ABJ August 2018
Randy Oliver
ScientificBeekeeping.com
My hope is to clarify exactly how various beekeeping practices affect the evolutionary pressure on the genomes of the honey bee and the varroa/DWV Monster. Armed with such knowledge, every beekeeper can then decide for themselves whether they are contributing to The Solution.
In this age of polarized online discourse, it’s not hard to find those with very strong opinions as to exactly how one should or shouldn’t keep bees, along with some heavy laying on of guilt. The problem is, that often a proponent of a view may have made up their mind without fully understanding the biology involved, but despite that, engage in argument solely to win, as opposed to arguing to learn [[1]]. In this article, I’d like to simply lay out the facts, so at least such arguments can be biologically informed.
I’ve previously explained how we beekeepers are part and party to creating the varroa/DWV “Monster.” We’ve helped it to evolve–by setting up a situation that confers a “fitness” advantage to symbiotic combinations of varroa and DWV that cause the collapse of their host colony late in the season.
The Solution is to strive for two objectives:
- To shift the genomes of our bee populations towards those that exhibit resistance to varroa, and
- To engage in beekeeping practices that eliminate the fitness benefit to the varroa/DWV Monster derived from causing the collapse of their host colony.
Both of the above objectives require a clear understanding of how our actions must be considered in the light of their evolutionary effect upon the bee, the mite, and the virus. So let’s start with…
A Primer on the Drivers of Evolution
First we need to understand the concepts of ecological niche, fitness cost or benefit, and the process of evolutionary genetic adaptation to a niche. Perhaps the easiest way to explain them is to think of the genetic code of a species as being a written business model. Any successful business model represents a way to exploit an available niche in the business environment. Those business models that exhibit the most success (fitness) in that niche succeed; the rest fail.
But as the economic environment tends to change over time, businesses must adapt—that’s evolution. They evolve by tweaking the codes of their business models, and then testing each tweak, by trial and error, in the market (the environment). The best compromises between benefits vs. costs tend to be more successful. We see the resulting evolution of businesses (and species) in retrospect—only the winners survive. And the winners pass the secrets of their success to following generations via their business model (spelled out in the genetic code of a species).
Practical application: evolution is nothing more than the tweaking of a species’ business model over time. This is most clearly exemplified by viruses, which are essentially nothing more than a set of instructions. In this age of molecular biology, evolution is defined as a proportional shift of the genes (alleles) in the overall genetic code of a species’ breeding population [[2]]. So what we need to focus upon are whether our beekeeping practices confer a fitness cost or benefit upon the genes of the breeding populations of the species involved in The Varroa Problem.
There are four species directly involved in The Varroa Problem—the bee, the mite, DWV [[3]], and human beekeepers. In the unmanaged breeding populations of Apis mellifera, natural selection is taking its course—favoring bees that somehow deal with varroa and DWV. What we beekeepers need to focus upon is how our practices either reward or punish virulent varroa/DWV combinations in the artificial niche that we create for the honey bee.
The Niches of the Players
The Niche of the honey bee
The fundamental niche of the honey bee is to exploit the floral resources of any habitat that has adequate nectar- and pollen-producing plants, water, and some sort of nesting cavities. Apis mellifera as a species can adapt to a wide range of biotic (such as plant species and phenology [[4]], competitors, predators, parasites) and abiotic (such as winter temperatures, rainfall or drought) conditions.
Thus, regional populations of A. mellifera–in response to evolutionary selective pressure for overall fitness at exploiting specific environments–resulted in the evolution of the various honey bee subspecies (races) that we know today. Each of those races has adapted to exploit a specific less-than-optimal realized niche (Fig. 1).
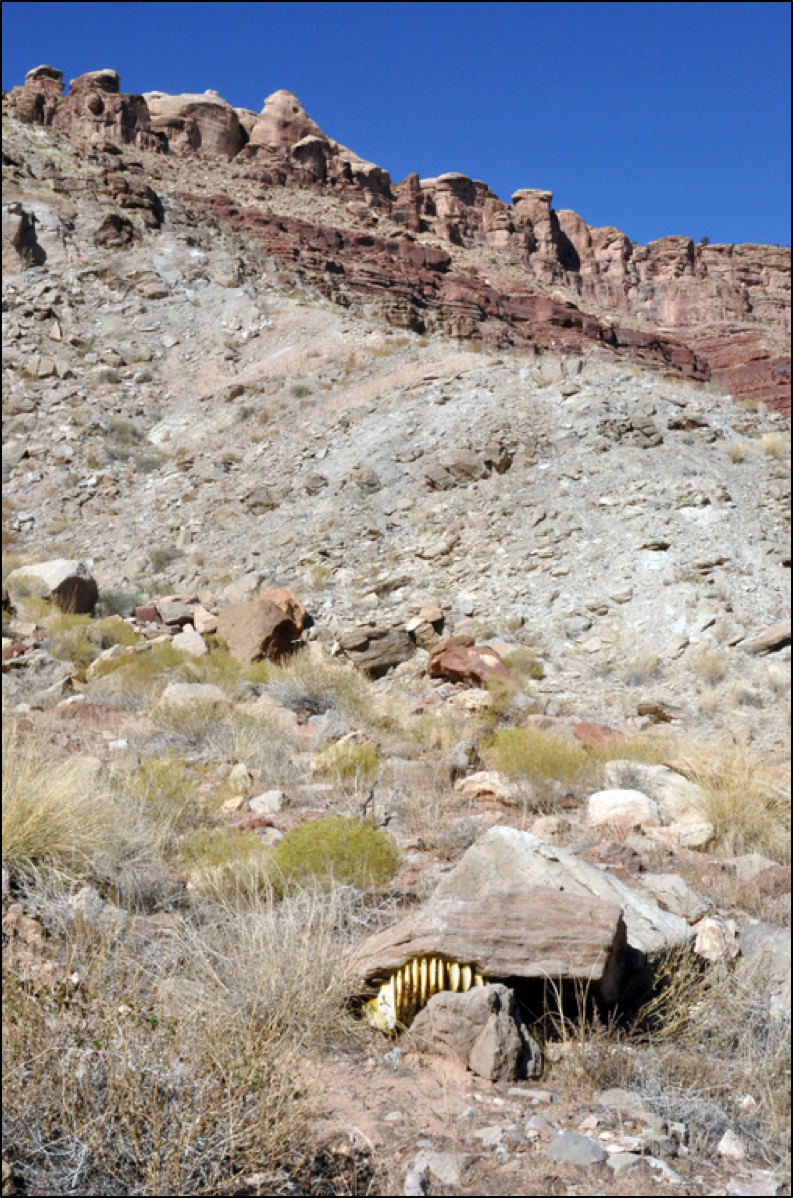
Figure 1. The realized niche being exploited by this wild-type colony in Utah is a far cry from optimal for the honey bee. Beekeeper Jerry Shue (who took the photo) and associates are working with their local wild-type population.
Now here’s where it gets interesting: adapting to a more refined realized niche involves tradeoffs—adaptation is always an evolutionary compromise. Those tradeoffs become more apparent during periods of environmental stress (e.g., weather, resources, or parasites). Thus, a generalist bee race may do well in any environment during good times (or if helped by the beekeeper), but a specialized race may outperform the generalist during times of environmental stress.
Practical application: a generic domestic bee stock can perform quite well in good times; a more specialized locally-adapted race may exhibit greater fitness during bad times (like after the honey flow). The question to any breeder is whether to select for colonies that perform best during good times or bad times.
The addition of varroa changed the realized niche of the honey bee—life got much tougher. And when DWV teamed up to collaborate with varroa, life for the bees got tougher yet. Our bees will likely need to make some compromises in order to deal with the mite. Luckily, those compromises do not necessarily involve the bees being more defensive or less productive—but we as an industry need to start putting more selective pressure upon our bees to take over the job of varroa management from us.
Practical application: in the process of breeding generic domesticated bees for traits favored by beekeepers, the tradeoff may be the loss of attributes which confer greater fitness under the unforgiving hand of Nature in the regional niche to which local races are better adapted.
The Niche of The Varroa Mite
In colonies of its native host, Apis cerana, life for varroa is tough. The bees fervently groom the mite from their bodies, only allow it to reproduce in the drone brood, and even then only if it doesn’t harm the pupa. The bee further restricts mite reproduction by only rearing drones from time to time.

Figure 2. If varroa were able to only exploit the drone brood in Apis mellifera, it wouldn’t be nearly the problem that it is for our bees. The photo above shows mites in drone brood shortly after almond pollination.
Unlike the generalist niche of Apis mellifera, in its original host, Varroa destructor exploits a very narrow niche, each strain of the mite apparently being specifically adapted to reproduce solely upon the drone brood of a regional race of Apis cerana [[5]].
When the Korea strain of varroa adapted to start reproducing in Apis mellifera worker brood, that opened up a whole new niche to exploit—unlimited food, nearly year round, and with very little push back from the bees. The Korea strain of varroa quickly exploited this unoccupied niche, and dispersed throughout the world. It later hooked up with DWV, which allowed it to reproduce [[6]] and disperse even more effectively.
Human perpetuation of non-resistant strains of bees, kept in continually-restocked apiaries, as well as the extra-large broodnests of managed hives, create an even more amendable niche for this strain of varroa. The mite is continuing to adapt to its new host and its symbiotic virus strains [[7]], and has now perfected the technique of killing colonies at just the right time for maximum dispersal of its bloodlines.
The Niche of Deformed Wing Virus
This formerly obscure insect virus rapidly adapted to using a novel vector—varroa—to spread from bee to bee and hive to hive [[8]]. Varroa opened up a whole new niche for the virus, since the mite allowed the virus to bypass the bees’ well-established anti-viral defenses by transmitting the virus directly into the bloodstream of the bee. And it may well be that varroa further helps the virus by digesting the bees’ critical fat bodies (which are involved in numerous aspects of bee physiology and immune response) [[9]].
And then some strains of virus adapted to not only infect individual bees, but to completely overwhelm the colony, causing collapse and the resulting robbing and drift of bees, which allowed for rapid dispersal of those virus strains to colonies throughout the landscape [[10]].
Practical application: we are never going to eliminate varroa or DWV from beekeeping—they are here to stay. If we stay our current course, it’s quite possible that the varroa/DWV Monster will evolve into an even more formidable parasitic combination. On the other hand, we do have the option of adopting management methods that apply selective pressures to tweak the gene pools of the breeding populations of the bees, the mite, and the virus in our favor.
The Breeding Population
A population is made up of members of the same species that interbreed and live in the same area at the same time. The collective set of all the alleles that exist within a population is referred to as its gene pool. Changes in the gene pool pave the way for species adaptation… and, ultimately, evolution. [[11]]
Practical application: if an individual beekeeper wishes to be part of The Solution to The Varroa Problem, they need to keep in mind which breeding population(s) of bees, mites, and viruses their actions affect—or whether they affect them at all.
For example, buying a package of domestic bees and allowing it to die from the varroa/DWV Monster is not going to change the gene pool of the producer’s breeding population in any way—on the contrary—it only increases the proportion of non-resistant bees dispersed that season. And during the collapse of that unfortunate colony, the drift of mites and virulent DWV to other hives only increases the proportion of their genetics in the next generation of your local bee population.
On the other hand, if you’re lucky enough to hive a swarm of gentle bees that turn out to exhibit resistance to varroa, and then produce hundreds of daughters from that queen, you’d have actually helped to shift the genetics of the bee population in a positive way.
Practical application to “treatment-free” beekeepers: simply allowing colonies to die is not part of The Solution—you need to propagate the queen lines that survive.
So let’s take a minute and look at the existing breeding populations of bees in the U.S.
The Honey bee Populations in the U.S.
There’s evidence that there are different regionally adapted “wild-type” breeding populations of the honey bee in the U.S. [[12]], as well as selectively-bred domestic breeding populations of managed bees. Each of these populations is genetically adapted to its specific realized niche—the wild-type bees living without human assistance (or interference); domestic strains adapted to benefit from the large nest cavities and feeding provided by beekeepers. Both of these niches changed with the introduction of varroa as an added biotic factor.
The Wild Type populations: Occupying this “natural” niche (in North America) are established wild-living introduced populations long independent of human management. Prior to varroa–dark, often hot-tempered “wild” honey bees were common in the woods. Some of these populations likely trace back to very early introductions of races of bees from different countries, and although they have likely interbred over the years with other bloodlines, their mitochondrial DNA indicates that they have survived to date without “rescue” by humans [[13]]. These wild populations, due to their diversity and apparent survivorship despite varroa, may offer valuable genetic combinations for improving our managed stocks. This is also true for the more recent invasion by the hybridized Africanized bee.
| Here we get into semantics— a feral animal is one which has escaped captivity or domestication and gone on to survive in the wild without assistance. A feral population is descended from an inbred domesticated stock. This would be the case for colonies founded by escaped swarms from commercial non-resistant bloodlines. These days, most of those feral colonies perish within a year or two from the varroa/DWV Monster.
On the other hand, the early introductions of honey bees to North America likely carried genomes closer to “wild type,” and readily adapted to ecological habitats similar to those of their natal countries. The fact that mitochondrial bloodlines of races of bees not propagated by commercial breeders continue to exist throughout the U.S. indicates that at least some of our free-living honey bee populations can be considered as wild type rather than feral escapees.
|
Some of these wild-type populations are isolated from managed colonies, and may be of low density (as in the Arnot Forest)—which would not reward varroa/DWV symbionts that cause their host colony to collapse (especially if such collapse occurs during the freezing winter when no dispersal can take place).
Of interest is that these wild-type populations of honey bees appear to be able to maintain some degree of genetic integrity despite the presence of managed bees in the landscape [[14]]. However, such wild-type populations at the interface with managed apiaries may face competition from those large-cavity colonies, and need to deal with parasite drift, robbing pressure, and the infusion of genetics through interbreeding with the managed bees.
I’ve made up some diagrams to illustrate the effects of various management practices upon bee and DWV evolution. I’ll first offer an idealized version of the natural selective pressure on a wild type population living in a sparsely-populated (by bees) forest (Figs. 3 & 4):

Figure 3. The legend for the diagrams.
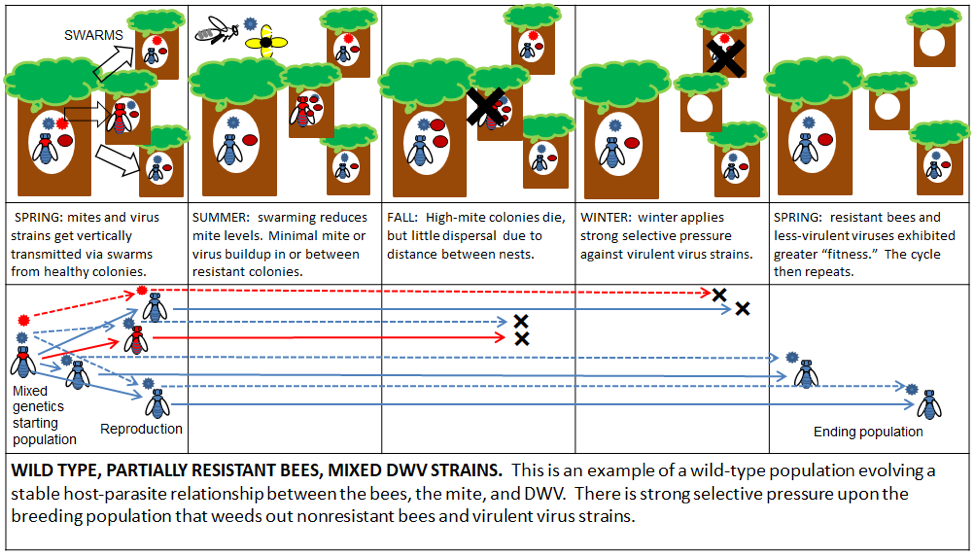
Figure 4. The result of natural selective forces upon the evolution of the genomes of the bee and DWV in a wild-type population. Simple interpretation for all diagrams: a left-to-right shift to blue is good, a shift to red is bad [[15]].
Practical application: these naturalized populations of bees don’t need no stinkin’ humans, and are likely better off without us. They would be great candidates for Darwinian beekeeping. However, I for one, enjoy working my own domesticated bee stock without protective gear or the “angry” and exhausting buzz of a cloud of bees around my head. There’s nothing wrong with keeping gentle bees—how many people try to make a living by milking wild goats?
The Domesticated Livestock population: populations of bees in which the genetics are controlled by the queen breeder/producers, who typically select for gentleness and productivity. The niche to which these bees are adapted is very different than that of the wild type bee—Dr. Tom Seeley listed 20 major differences in his article Darwinian Beekeeping [[16]]. The most important differences are:
- The expanded nest size (bigger than the typical bee-occupied tree cavity), which allows for much larger broodnests and colony strengths, especially if the colonies are managed to prevent swarming. The big broodnests create the perfect feeding ground for varroa, allowing the mite to develop extremely large populations in the hives before they collapse.
- Supplemental feeding of colonies, which allows for maintaining apiaries at beyond the carrying capacity of the landscape, resulting in periodic nutritional stress (forcing longer-range foraging), and greater robbing pressure (which favors mite/virus dispersal).
- The high density of colonies—often dozens to hundreds (or thousands) in close proximity. This allows for vastly more efficient colony-to-colony parasite transmission (dispersal), prior to, and during collapse.
- The restocking of parasite-killed hives with fresh colonies, thus removing any fitness disadvantage to parasites from causing the death of their host colony.
- The use of miticides and antibiotics to control parasites, which removes the evolutionary pressure for the bee population to develop natural resistance.
I’m not saying anything critical of the above—I’m a commercial beekeeper myself. As with other forms of livestock husbandry, our current food-production system rewards large-scale livestock operations, and there are business opportunities (niches) for beekeepers who can provide migratory pollination services, produce honey at large-scale, and provide bees and queens for sale to other beekeepers. Professional beekeeping has evolved in order to take advantage of those business opportunities.
There is little financial incentive for professional beekeepers to change the above practices, since they work (Fig. 5). Accordingly, the queen producers will continue to breed bees specifically adapted to this niche—it is my hope that commercial genetics will soon include traits for varroa resistance. There is nothing “wrong” with commercial bee stock, any more than there is anything “wrong” with domesticated cattle, chicken, or dogs. These animals are bred for a purpose, and the queen breeders do an excellent job at supplying our industry with bees adapted to the livestock niche.
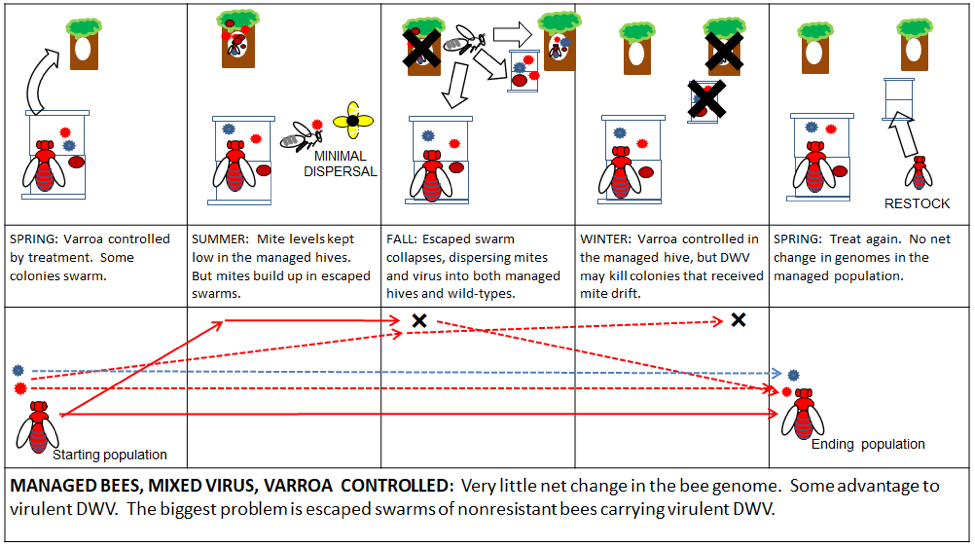
Figure 5. In a well-managed operation of domestic bees, there is little net effect—good or bad—upon bee or virus evolution. However, this scenario is completely dependent upon the availability and application of effective miticides. Compare the above to what happens if those treatments are not effectively applied (Fig. 6).
A key practical note: based upon the data of Mangus and Szalanski [[17]], it appears that these domesticated stocks of bees do not necessarily survive very well in the wild. There is absolutely no reason to expect domesticated bees to perform well in a niche to which they are not well adapted. And currently, most domesticated stocks have not been selected for resistance to the either varroa or DWV.
To effect evolutionary change in any breeding population’s gene pool, there must be a fitness advantage (or cost) conferred by certain alleles in both reproduction and dispersal. This applies to the bee, the mite, and the virus. So let’s look into those two drivers of evolution:
Reproduction and Dispersal
Shifting the gene pool of the honey bee towards mite resistance will require the disproportionate reproduction of resistant queens. Unfortunately, there are currently not enough queens from proven mite-resistant stock available for purchase. One problem is that we don’t have an impartial testing organization to compare purported resistant stocks in various areas
Practical need: our industry could use an independent All America Selection organization to test purported mite-resistant queen stocks in each region of the country. We could copy the established models for testing plant cultivars [[18]]. We’re unlikely to see any serious change in bee genetics until proven mite-resistant stock becomes more readily available to commercial beekeepers.
Commercial queen producers sell over a million queens each season. They are going to produce non-Darwinian bees. But there’s no reason that they couldn’t be producing gentle, productive, mite-resistant stock.
Practical application: be realistic. If you’re in an area with a preponderance of commercial beekeepers, as a small-scale beekeeper, you’re not going to shift the genetics of the breeding population. On the other hand, if there are no large-scale beekeepers around, and you have cooperative recreational beekeepers willing to work with you, by all means try to propagate and disperse mite-resistant bees.
The above is tough if other beekeepers continue to import domestic stock from elsewhere each season—that genetic infusion will make it difficult for any regional stock to develop. My hat is off to those beekeepers worldwide who are working cooperatively to propagate varroa-resistant regional bee stocks. Otherwise, your efforts will likely be futile.
Bottom line: If you want to change the genetics of a bee breeding population, you need to focus upon increasing the reproduction and dispersal of mite-resistant queen lines. If you’re not reproducing a lot of queens yourself [[19]], then get some resistant queens from (or to) a producer who will. And only when those better queens get dispersed throughout your region’s breeding population can mite resistance become a reality.
Dispersal of mites and DWV is another matter, and is largely a direct result of our beekeeping practices. Large apiaries, poor mite management, and the replacement of collapsed colonies with more non-resistant bees favor the most virulent symbiotic combinations of varroa and DWV (Fig. 6).
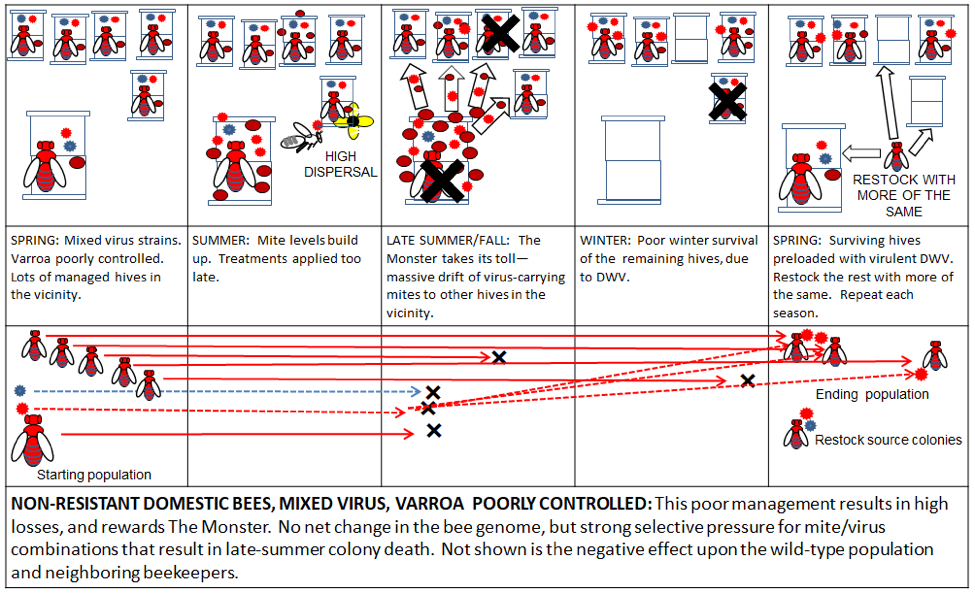
Figure 6. Poor varroa control in a managed apiary using non-resistant domestic stock rewards The Monster, since it confers a fitness advantage to mite/virus combinations that kill their colony in late summer. This not only perpetuates The Varroa Problem, but may even make it worse over time.
Similar to malaria, DWV is generally not much of a problem without an effective vector to disperse it. That effective vector is a high infestation of varroa. And if the virus manages to kill its host colony during robbing season, it then very effectively uses the mite to disperse it to new host hives. Both the virus and the mite evolutionarily benefit from such dispersal.
Practical application: dispersal, dispersal, dispersal—I said it three times. All beekeepers should work to minimize the dispersal of varroa and virulent DWV from their hives to others in the vicinity, as this only rewards The Monster [[20]].
I’ll continue next month with illustrations of the genetic consequences of other forms of apiary management, including “treatment free” beekeeping.
Acknowledgements
Thanks as always to Pete Borst for research assistance, and to all the dedicated and hard-working bee researchers from whose publications I draw useful information.
Notes and Citations
[1] A recent article in Scientific American addresses the difference: The Tribalism of Truth. Available for free download.
[2] An allele is an alternate form of a gene; in the breeding population of any species, there may be several common alleles for any gene (e.g., for black, brown, or white coloration). There are also other heritable characteristics besides genes, such as the epigenetic adjustments to the environmental factors.
[3] Varroa also transmits other viruses, but they don’t appear to have evolved to take advantage of varroa as has DWV—see:
Nazzi, F, et al. (2012) Synergistic parasite-pathogen interactions mediated by host immunity can drive the collapse of honeybee colonies. PLoS Pathog 8(6): e1002735.
Some (such as the paralytic viruses) tend to be self limiting, due to their high virulence in individual bees. But it is DWV alone that has intimately coupled with varroa across the world. This is not to say that other viruses may not do so.
[4] The seasonal timing of bloom of the local plant community.
[5] Dr. Denis Anderson brought this to our attention in 1998, eventually leading to his identifying and renaming Varroa destructor. The following two papers track the process of discovery.
Denis L Anderson & Stefan Fuchs (1998) Two genetically distinct populations of Varroa jacobsoni with contrasting reproductive abilities on Apis mellifera, Journal of Apicultural Research, 37(2): 69-78.
Anderson, D (2006) Clarification of aspects of Varroa reproduction—first stage of a possible new control method. RIRDC Publication No. W06/007. Open access, but unfortunately was not funded.
[6] Di Prisco, G, et al (2016) A mutualistic symbiosis between a parasitic mite and a pathogenic virus undermines honey bee immunity and health. Proceedings of the National Academy of Sciences 113(12): 3203-3208.
[7] DWV is not new to the honey bee, but existed as an opportunistic “cloud” of variants, very rarely causing noticeable problems. But once varroa entered the picture, two variants (DWV A and B) quickly outcompeted the numerous other strains of the virus (see the following citation). So when I refer to the varroa/DWV “Monster,” I’m talking about these varroa-adapted DWV strains.
[8] Martin, SJ, et al (2012) Global honey bee viral landscape altered by a parasitic mite. Science 336: 1304-1306.
[9] Despite varroa and DWV having been a major problem for decades, we are still on the learning curve as to many details of the biology of this complex host-parasite relationship.
[10] Nazzi (2012) op cit.
[11] www.nature.com/scitable/ebooks/essentials-of-genetics-8/contents
[12] https://scientificbeekeeping.com/whats-happening-to-the-bees-part-5-is-there-a-difference-between-domesticated-and-feral-bees/
[13] Mitochondrial DNA can be used to track unbroken maternal bloodlines. Since the maternal bloodlines of some wild-type bees do not exist in the commercially-managed bee populations, then they could not be recently-escaped ferals, and were apparently not extirpated by the invasion of varroa.
[14] Daly, HV, et al (1991) Clinal geographic variation in feral honey bees in California, USA. Apidologie 22: 591-609. Open access. See Figure 3 at my What’s Happening Part 5 link above.
[15] I toyed with a number of ways to illustrate the effects of management practices upon bee and DWV evolution. I’ll post these illustrations to to my website for better viewing.
[16] Seeley, TB (2017) Darwinian Beekeeping: An Evolutionary Approach to Apiculture. ABJ 157(3): 277-282. Open access at https://www.naturalbeekeepingtrust.org/darwinian-beekeeping
[17] Magnus, R and AL Szalanski (2008) Genetic variation in honey bees from south central United States. Poster at 2008 ESA Open access. Compare the pie charts (Figure 4) that I created from their data at my What’s Happening Part 5 link above
[18] https://all-americaselections.org/about/
Another existing program is the Smart Bees project in Europe.
[19] https://scientificbeekeeping.com/queens-for-pennies/ and https://scientificbeekeeping.com/small-scale-queenrearing/
[20] There is the special case with the Bond Method, in which such dispersal puts extremely strong selective pressure upon the bees; but the Bond Method requires that one only restock colonies with survivors. I’ll illustrate this in the next article.
First published in: American Bee Journal, July 2018
Contents
Being part of The Solution rather than part of The Problem.. 1
Assigning the blame. 2
Let’s first get some facts straight. 3
Our part in creating the monster. 8
Understanding Bee, Varroa, Virus & Beekeeping Coevolution. 9
it’s all about successful dispersal and transmission. 10
Here’s how it works. 11
Next. 13
Acknowledgements. 13
Notes and Citations. 13
The Varroa Problem: Part 17a
Treatment Free Beekeeping
and
Being Part of The Solution Rather than Part of The Problem
First Published in ABJ July 2018
Randy Oliver
ScientificBeekeeping.com
I’ve noticed some hot buzz words of late—such as “treatment-free,” “natural,” or “Darwinian” beekeeping, or the “rewilding” of the honey bee. I feel that it is worthwhile to explore these concepts from an objective practical and evolutionary perspective. My hope is to facilitate rational discussion of our options for solving The Varroa Problem.
The Varroa Problem is not just a bee/mite issue—it’s an evolutionary event in which viruses and beekeepers are fully involved players. Varroa would likely no longer even be much of a problem if it were not for the fact that some of our beekeeping practices work in favor of the mite and Deformed Wing Virus (DWV). The Solution to The Varroa Problem is for beekeepers to better understand how their management practices affect the evolutionary pressure upon the bee, varroa, and DWV.
I’m 100% behind the concepts of “natural” and “treatment free” beekeeping, but as a biologist, am concerned that many who think that they’re helping, are actually inadvertently working against the natural evolutionary process. There are ways to be part of The Solution, but they’re a little more involved than simply withholding treatments for varroa. In this two-part article, I hope first to dispel some myths, then explain how the coevolution of varroa and DWV created a monster, how beekeeping practices play a part in the evolutionary selective pressure, and then to objectively rank different management approaches as to as whether they qualify as being part of The Problem or part of The Solution.
Assigning the blame
Along with the explosive increase in recreational beekeeping, there comes a good deal of passionate arguing about the “best” way to keep bees. These debates often seem to be more about a beekeeper’s ideology or tradition rather than about actual bee biology, and often devolve into the mere repetition of rigid dogma rather than the constructive weighing of evidence and analysis of the long-term evolutionary consequences to the bee.
The British Columbia Honey Producers Association publishes an excellent quarterly called Bee Scene. In last fall’s issue [[1]], an article by beekeeper Kerry Clark caught my eye– “Mutual Respect in the Treatment-Free Debate.” I’m in full agreement, since either side has grounds for making a case. I find closed-minded finger pointing, blaming, and demonization of others to be counterproductive. Although proponents of either side can convincingly rationalize and justify their positions, the truth is that both sides are often right, and both sides are often ill-informed about the biology involved.
So let’s just step out of our echo chambers for a moment, and educate ourselves as to exactly what created The Varroa Problem, and then how we can make better-informed decisions as to how to solve it. I’ll begin by suggesting that we all accept some part of the responsibility:
Are large-scale commercial beekeepers part of The Problem? For the most part, yes.
Are small-scale “treatment free” beekeepers part of The Problem? For the most part, also yes.
Practical application: both of the above are the wrong questions to be asking. May I suggest that it is more worthwhile to be “pro” a desirable goal, rather than “anti” this or that. Our goal is healthier bees, free of The Varroa Problem. So the question that every beekeeper should ask themselves is, are you being part of a realistic solution?
There are ways that every beekeeper, depending upon their circumstances, can help to be part of The Solution–or at least less a part of The Problem. But first we need to clearly define exactly why we still suffer from The Varroa Problem thirty years after the invasion of the mite. It’s all about the biology and evolutionary processes involved in bee/mite/virus/beekeeping dynamics. It’s actually relatively straightforward to understand, but without a clear understanding of the evolutionary selective pressures resulting from our various beekeeping practices, any efforts to solve The Problem will be futile in the long run.
Let’s first get some facts straight
The main problem that I see is that much of the discussion that I read is based upon erroneous information, so I’d first like to go over some easily-verifiable facts.
The oft-repeated alarm about the “decline” or “imminent extinction” of the honey bee is a false narrative—beguiling but unsupported by fact. It’s true that the varroa/DWV complex has made beekeeping more difficult than it used to be, but the simple fact remains that the number of managed colonies of bees is increasing in the U.S. as well as in most every other country.
Practical application: the health of honey bee colonies will indeed decline if varroa is not managed. But if varroa is kept to a low level, my colonies appear to be as healthy as they’ve ever been in my 50 years of beekeeping. Many professional beekeepers are enjoying financial success these days.
Let’s look at the oft-trumpeted colony mortality figures. Under natural conditions, the honey bee population in any area will swing up and down over the years, the majority of colonies perhaps dying when there is a severe winter, prolonged drought, or some plague, but then during good times the population quickly rebounding until it reaches the carrying capacity of the land.
So let’s imagine that there is a consecutive series of good years, and that a “stable” population of wild honey bee colonies has come into balance with the available floral resources. Under these perfect conditions, what percentage of colonies will die each year? Let’s do the math. Under perfect conditions every single colony will swarm at least once during the season—thus temporarily doubling the population. But if the overall population of colonies is to remain stable, that means that at least half the colonies must die each year. And this is where natural selection takes place—with the most “fit” colonies having a better chance of surviving Fig. 1.
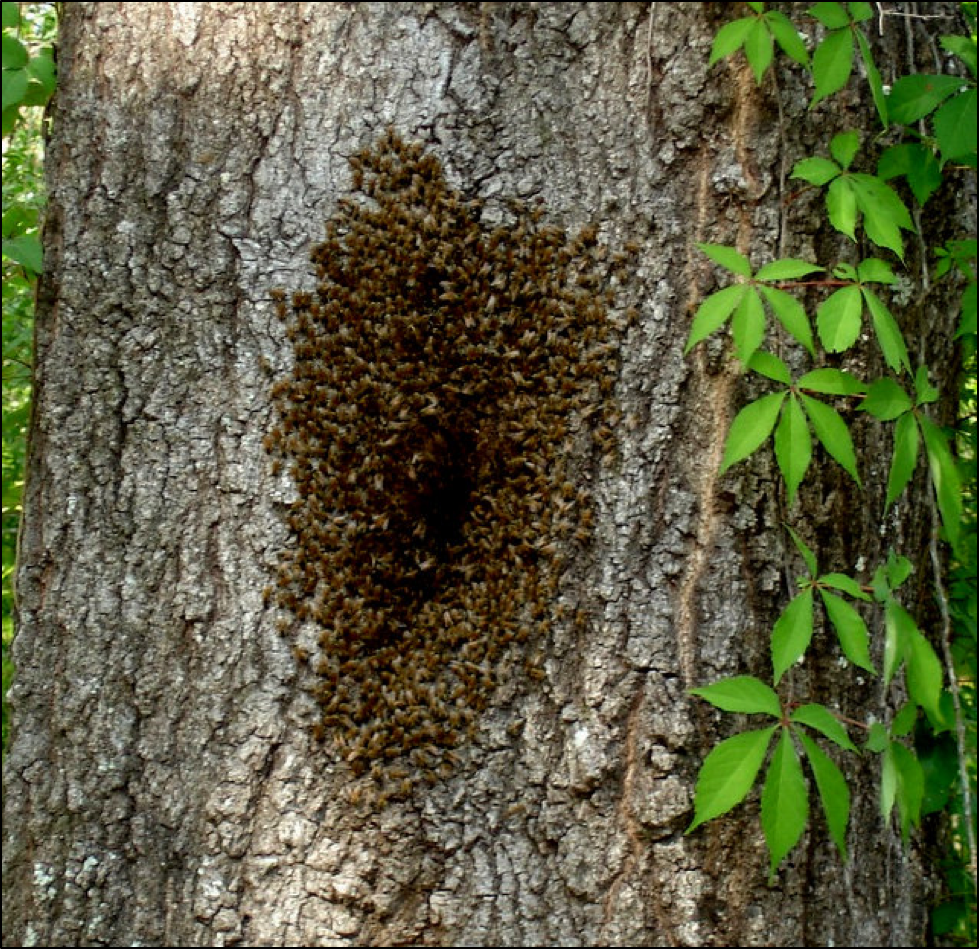
Figure 1. Life is tough for colonies living in the wild. Their success at surviving until reproduction in their second season is low. The unforgiving environment exerts strong selective pressure for “fitness.” The addition of varroa/DWV to the environment has added another component to that required fitness.
Practical application: don’t let the elevated colony loss rates from those who aren’t adequately controlling varroa mislead you—the honey bee, left to its own devices, is a survivor, and is going to do just fine. Keep in mind that if you go out of your way to help slacker (less fit) colonies to survive, that you are working against the natural evolutionary process. Start each season with more colonies than you plan to take through the winter—and cull those that don’t perform.
That said, regarding the wild populations of the Western honey bee in their native ranges in Europe, some subspecies are indeed under threat not only from varroa, but also from having their invaluable locally-adapted genomes contaminated by introduced commercial bloodlines from nearby managed colonies. In this case, the recent pleas by Blacquière and Panziera [[2]] to modify beekeeping practices to help conserve the genetic heritage of these threatened races certainly apply. As explained by Neumann and Blacquière [[3]]:
Here lies a great opportunity for beekeeping in several countries, where economic constraints are no longer leading as beekeeping has become a hobby sector, with dispersed and small apiaries being the rule. Sustainable solutions for the apicultural sector can only be achieved by taking advantage of natural selection and not by attempting to limit it.
Practical application: I fully support the efforts by those involved in sustaining threatened races of honey bees in their native lands. Recreational beekeepers in those countries can be part of The Solution.
On the other hand, in North America the honey bee is a well-established, but non-native invasive species. Its presence is not necessary for the survival of native species of plants—a function that is well-performed by native pollinators, who may in fact face competition from the honey bee. Thus, the honey bee is not a necessary component for the functioning of natural ecosystems on this continent.
That said, we North Americans place great value on the honey bee to perform pollination services of agricultural crops, as well as for producing honey and beeswax. As such, bees kept for these purposes can be considered as domestic livestock. In addition, many recreational beekeepers enjoy keeping bees simply as pets.
Practical application: when bees are kept as either livestock or pets, it confers upon the keeper the responsibility to provide for their care (Fig. 2), and to be respectful of other beekeepers’ operations. The unmanaged bee population not only doesn’t need our help, but may be harmed by well-meaning recreational beekeepers (I’ll explain further on).

| 2.3 Parasites
…If prevention is not effective, treatment must be implemented to effectively control worms, lice, mites, flies and other internal and external parasites …
Farmers must develop a management plan to increase the livestock’s resistance and/or resilience to parasites over time.
|
Figure 2. As an example of our ethical responsibility to our livestock, I offer the above snip from the Grass Roots Farmer’s Cooperative. The practice of good animal husbandry requires that those who are responsible for their livestock control external parasites (in our case, varroa). Furthermore, we should each be part of a plan to improve the resistance of our animals (our bees) to that parasite.
Another false claim is that our beekeeping practices are not sustainable. Clearly, we need to wean ourselves off our miticide dependence for varroa control, but there are plenty of beekeepers who could correctly claim that their management practices appear to be sustainable for the foreseeable future.
A case in point: my sons and I have a 35-year history of supplying, without fail, healthy, strong colonies for almond pollination. In recent years we tripled the size of our operation, all the while selling off about a third of our bees as nucs each spring. And we do so without the use of synthetic miticides, and the rare use of an antibiotic. Our operation and methods appear to be fully sustainable.
A third myth is the claim that one’s beekeeping practices are “natural.” In reality, as soon as a beekeeper sets up an apiary, they’ve created an unnatural density of colonies, all then forced to compete against each other. This unnatural host density also allows for an unnaturally elevated colony-to-colony transmission of parasites. The only form of truly “natural” beekeeping that comes to mind is practiced in Africa and some other countries—where the bee “keeper” simply hangs a hollow log in the occasional tree and hopes for a swarm to move in, from which they can later steal some honey.
Practical application: I came of age as a California “Flower Child,” am a long-term organic gardener, and live as close to an “all-natural” lifestyle as I can. So I have the right to say that the term “natural beekeeping” is an oxymoron. The moment that you place a swarm, package, or nuc into a hive, you’ve unnaturally intervened. And if the bees that you use are of commercial stock, it is even more unnatural. And if you place more than one hive in an apiary (or you have beekeeping neighbors), you’ve then created an even less natural situation.
Bees don’t care a whit about whether anything is “natural” or “artificial”—they only care about the end result (Fig. 3). They’ll happily move into manmade structures and thrive there—so long as the cavity is dry and insulated. As far as “natural” food, I can easily see the health of my colonies improve in late summer when I feed them an artificial pollen sub, and it’s well established that colonies winter just fine on stored sugar syrup—bees just need good nutrition, and don’t care where it comes from. And bees hate many of the “natural” essential oils and other concoctions often introduced in their hives—I personally use the “natural” treatments of thymol and organic acids mainly due to their lack of contamination of the combs [[4]] and their apparent short-term adverse effects upon colony health, rather than because they can be claimed to be “natural.”

Figure 3. Honey bee swarms will readily choose manmade cavities in which to nest—they appear to base their choice upon location, volume, water tightness, and defensibility rather than whether it is “natural” or “artificial.” The swarm colony above is thriving in a narrow, rectangular, artificial cavity made of pressure-treated wood and plywood with urea-formaldehyde glue. Photo courtesy beekeeper Scott Ball.
Now don’t get me wrong–I’m not saying that the above cavity will be best for thermoregulation during winter, but rather that the bees may evaluate the benefit of various methods or products differently than do the beekeeper.
Practical application: using the word “natural” doesn’t put a halo around your head nor necessarily make a management method or product beneficial to bees. “Natural” is an arbitrary distinction—but it’s a good baseline to which any “improvements” can be compared. Similar to how humans appear to benefit from living in fabricated structures, and from eating diets of crops artificially selected for human edibility and nutrition, the honey bee can also not only adapt to unnatural cavities and management methods, but may actually benefit from some of them.
O.K., now that we’ve got some facts straight, let’s start looking at the relationship between bees and beekeepers.
Our part in creating the monster
We’re all sick to death of The Varroa Problem. The question then is how can Joe or Jane Beekeeper help to solve the problem. In order to do so, they need to understand why The Varroa Problem has not gone away on its own—as did the decimating plagues of the past that we suffered during the invasions of wax moth, chalkbrood, tracheal mite, and Nosema ceranae.
Understand that there is no “balance of nature”—biological life continually adapts to the environment of our ever-changing planet. All life forms use the same “operating system” based upon DNA, yet that code is continually being modified via mutation and reordering, with the winning codes being determined by natural selection (most species–like the dinosaurs–eventually go extinct, since they did not adapt well enough). The honey bee, due to the multiple matings of the queen, as well as the bees’ notably high rate of genetic recombination, is expert at adaptation. And one of the environmental factors that bees need to adapt to are viruses—the rogue pieces of genetic material that hijack the cellular machinery of living things.
Viruses are the ultimate parasite, stripped of any excess machinery—consisting simply of a set of genetic instructions coupled with a target-specific fusing/ injection mechanism. It’s debatable as to whether viruses should even be called a life form, as an infective virus can be created in the lab from scratch [[5]]. Viruses only replicate–they don’t think, feel, eat, or have any “plan,” nor any necessary need to harm or kill their host (Fig. 4). They are perhaps the clearest example of how the process of evolution works at the genetic level, due to the simplicity of their reproductive process, as well as the fact that it takes place at such high speed.

Figure 4. In the photo above one can see two adult bees with the deformed wings resulting from a severe infection of DWV when those bees were in the pupal stage. You can also see some prepupae apparently also suffering from DWV, plus a sick adult bee at the upper left unable to emerge from its cell. Of interest, there would be little or no fitness benefit to the virus from killing or deforming its individual host bees, unless the virus depended upon causing the colony to collapse in order to get dispersed to other hives.
Practical application: viruses are everywhere—every living organism has means for dealing with them. The Varroa Problem is not only about varroa—the mite is only the vector. The real problem is the viruses—mainly Deformed Wing Virus. This virus has before our very eyes rapidly evolved to take advantage of its new vector. And beekeepers are part of why that came about.
Understanding Bee, Varroa, Virus & Beekeeping Coevolution
Varroa is a minor problem for its native host, the Eastern honey bee, Apis cerana. Humans started The Varroa Problem when we exposed the Western honey bee to the mite. Even then, it still took quite a few years for a novel strain of varroa–the Korea haplotype–to adapt to Apis mellifera, and then become today’s worldwide problem.
Once this strain of varroa evolved to the point that it was able to effectively reproduce in Apis mellifera colonies, it changed the environmental niche of the honey bee—the colony now needed to deal with an immune-system-destroying parasite, along with a novel mode of exposure to viruses and bacteria introduced through the mite’s feeding wounds.
Practical application: the honey bee is now in the process of evolutionary adaptation to this huge change. Beekeeping practices influence that evolutionary process.
We humans have since inadvertently introduced varroa to nearly every population of Apis mellifera on the planet. Each initial invasion of the mite then decimates the established wild population of honey bees—but typically a few colonies survive. Those survivors then provide a low host density for the mite (fewer bee colonies), thus severely limiting hive-to-hive horizontal transmission of the mite. This minimizes the mite invasion pressure upon of the survivors, allowing natural selection to then take place, favoring those few colonies that exhibit some degree of mite resistance. Eventually, those somewhat resistant lines of bees reestablish a population. This has happened again and again.
So why is varroa still such a problem for us? It’s because of three key things:
- Our lack of selection for varroa-resistant bee stock,
- Our continual restocking of colonies that die—thus maintaining a high host density, and
- The evolution of Deformed Wing Virus.
I’m not going to belabor our need for varroa-resistant stock—we all know that. It’s the next two things that we need to understand. After varroa first kicked our butts, it appeared that we could deal with the mite by treating once a year with an effective miticide. But then an obscure insect virus called Deformed Wing Virus evolved to take advantage of varroa as a vector and facilitator. Certain forms of DWV then coevolved with varroa to exploit an endless source of food—the worker brood in the continually-restocked colonies in managed apiaries large and small. We are now dealing with a monster—the varroa/DWV complex—in which both species mutually benefit from their “marriage.” This insidious symbiotic partnership is our nemesis, and will likely only get worse until we all keep mite-resistant bees.
Practical application: so long as we keep providing an endless platter of brood in non-resistant restocked hives, nature will continue to select for mite/virus combinations that are best able to invade those new colonies. This is true for both bees kept as livestock and with those kept for recreation. Any beekeeper is not being part of The Solution if he/she stocks their hives with domestic stock and allows them to collapse due to lack of varroa management!
it’s all about successful dispersal and transmission
It may help to understand the difference between a parasite and a parasitoid. Parasites generally benefit by not killing their host—think of fleas or ticks—their species do better with live hosts continually transmitting young parasites to new hosts. A parasitoid, on the other hand, requires that the parasite kills its host in order to complete its life cycle—a critical component of that life cycle being dispersal to a new host individual.
In Apis cerana, varroa is an endemic parasite—always there at a low level, and vertically transmitting from parent colony to swarm [[6]], with little or no advantage to be gained by causing the collapse of its host colony. This can also be the case for A. mellifera, but so long as there are always other colonies within easy flight range, it will always be to to varroa/DWV’s advantage to kill its host colony in order to disperse by drift and robbing.
Take home message: in the case of the varroa/DWV monster, causing the collapse of the host colony at the right time greatly increases the odds for that line of virus to be transmitted to other colonies. When a beekeeper allows managed colonies to collapse from varroa/DWV, that beekeeper is inadvertently giving an adaptive advantage to the varroa/DWV combinations that are the most effective at causing the death of their host colony. Restocking that varroa-killed hive with another package of domestic bees and then allowing it to again collapse in the same way is completely contrary to being part of The Solution.
Here’s how it works
Neither varroa nor DWV benefit from causing the death of bee pupa or adults. But so long as beekeepers continue to maintain a high host density (lots of hives in the neighborhood), it then becomes evolutionarily advantageous to a DWV strain to kill its host colony–so that drifting bees and incoming robbers then better disperse that particular combination of varroa/DWV to surrounding hives [[7]].
Practical application: it is only advantageous for the varroa/DWV monster to kill its host colony if there is a good chance that the collapse will result in the parasites being transmitted to at least two new colonies not yet infected by the specific genetics of the virulent parasites—otherwise it would be to the parasites’ advantage to not overly harm its host colony, and instead be vertically transmitted to its future swarms. The key factor is colony density—how many other colonies there are within flight range.
It would also not be advantageous for varroa/DWV to kill its colony during winter cold, since that would also spell the death of that bloodline of mites and strain of virus. Thus I’d expect low density, unmanaged honey bee populations in long-winter areas (such as in the Arnot Forest) to rapidly develop stable host-parasite relationships with varroa/DWV.
The best (most adaptive) timing for varroa/DWV dispersal to occur would be during the late-summer nectar dearth when robbing and bee drift is likely to occur (Figure 5). This must be balanced against the virulence of the varroa-DWV monster—if the mites were then to rapidly reproduce in the new host colonies, they might kill the colony during the winter. So the late-season timing is just right, since that’s when the colonies reduce broodrearing, and thus suppress mite reproduction. This allows the newly-introduced virulent varroa/DWV monster to lie relatively dormant until spring buildup begins.

Figure 5. In the simulation above, starting with 100 mites in the hive, varroa overtook the colony in late August, finally infesting over a third of the brood cells. Due to the high infestation rate of the adult bees in August and September, the virus would suddenly go “epidemic” due to the amount of vectoring by the mite, and every mite during its phoretic phase would stand a good chance of feeding on an adult bee with a high DWV load, thus resulting in the pupae subsequently parasitized by those mites being overwhelmed by the virus. At collapse, drifting and robbing bees very effectively transmit both the mite and virus strains to surrounding colonies.
Practical application: the marriage of varroa with DWV is a match made in hell, as far as managed bees are concerned, since so long as there is an unlimited supply of nearby hives to infect, it will always be to DWV’s advantage to kill its host colony in late summer or early fall. In this respect, varroa/DWV acts more like a parasitoid than a parasite—at the bee colony level—since the virus uses the drifting and robbing bees to infect its next host colony. It is the virus-induced collapse and resulting horizontal transmission that we do not want to evolutionarily reward.
Thus, if we look at where the varroa/DWV marriage stands today, we see that there is selective pressure for DWV not to be too virulent (as are the paralytic viruses), as it could kill its host colony during winter or early in the season when little robbing takes place, but to be virulent enough that when the mite infestation rate exceeds around 15 mites per 100 bees in late summer, that the colony collapses at just the right time for transmission to other hives. This timing may be synchronized by the apparent increase in the efficiency of varroa as a vector as the duration of its phoretic phase increases during late summer [[8]]—our understanding of this insidious relationship keeps growing.
The bad news is that both varroa and DWV are able to evolve rapidly—the honey bee reproductive cycle typically takes a full year—that of varroa, around 17 days, and for DWV, mere hours. And as suggested by genetic analysis by Andino [[9]] varroa is likely still adapting to its new host, and may eventually become an even more successful parasite unless we start breeding bees that can fight it on their own. And you can bet money on DWV continuing to evolve [[10]]!
Next
All is not doom and gloom. The honey bee is demonstrably able to overcome the varroa/DWV complex. It’s really up to us beekeepers whether we continue to contribute to The Problem. In the next installment I’ll go over the pros and cons of the various proposed options for beekeepers, big or small, wishing to be part of The Solution.
Acknowledgements
Thanks as always to Pete Borst for research assistance, and to all the dedicated and hard-working bee researchers from whose publications I draw useful information.
Notes and Citations
[1] Bee Scene 33(3): 27. British Columbia Honey Producers’ Association.
[2] Blacquière, T & D Panziera (2018) A plea for use of honey bees’ natural resilience in beekeeping. Bee World, 95(2): 34-38. Open access.
[3] Neumann, P & T Blacquière (2017) The Darwin cure for apiculture? Natural selection and managed honeybee health. Evolutionary Applications 10:226–230. Open access.
[4] Thymol can actually leave substantial residues in the combs, perhaps depending upon the method of application. But those residues would not generally be considered to be of concern to human health, and based upon my experience with Apiguard®, do not appear to have an adverse effect upon colony buildup following treatment.
[5] Lamp B, et al. (2016) Construction and rescue of a molecular clone of Deformed Wing Virus (DWV). PLoS ONE 11(11): e0164639. doi:10.1371/ journal.pone.0164639
[6] Yes, I understand that the swarm is actually the parent colony (containing the old queen), with the daughter colony (with a new queen) remaining behind. Apis mellifera appears to exhibit a greater propensity for the robbing of weaker colonies than does A cerana (Anna H. Koetz, AH (2013) Ecology,behaviour and control of Apis cerana with a focus on relevance to the Australian incursion. Insects 4(4): 558–592), perhaps to avoid horizontal transmission of the mite.
[7] Such dispersal of a pathogen is termed “horizontal transmission.” This concept is nicely reviewed by Nolan, MP IV (2016) Impacts of inter-colony distance, mite host choice, and colony polyandry on the host/parasite relationship between Apis mellifera and Varroa destructor. Dissertation, University of Georgia.
[8] Piou V, et al (2016) A. Impact of the phoretic phase on reproduction and damage caused by Varroa destructor (Anderson and Trueman) to its host, the European honey bee (Apis mellifera L.). PLoS ONE 11(4):e0153482.
[9] Andino, GK, et al (2016) Differential gene expression in Varroa jacobsoni mites following a host shift to European honey bees (Apis mellifera). BMC Genomics 17:926.
[10] Martin, SJ, et al (2012) Global honey bee viral landscape altered by a parasitic mite. Science 336: 1304-1306.
First published in: American Bee Journal, May 2018
Contents
Bee Drift and Mite Dispersal (continued) 1
So why do colonies allow bees to drift in?. 1
The sheer numbers involved. 4
The amount of mite drift into other hives. 5
Collapse and Robbing. 7
What happens to all the mite-infested bees when a colony collapses?. 8
Swarms coming back to bite you in the Butt. 9
Acknowledgements. 10
Notes and Citations. 10
The Varroa Problem: Part 16b
Bee Drift and Mite Dispersal (continued)
First Published in ABJ April 2018
Randy Oliver
ScientificBeekeeping.com
It’s clear that there may be a considerable amount of hive-to-hive drifting by bees and mites in the typical apiary. This then raises the question of whether there is anything that we can do about it?
So why do colonies allow bees to drift in?
Let’s start with some definitions. As I’m sure that you’re aware, the female members of the honey bee colony allocate their work to two distinct morphological castes–the fertile queen and the reproductively-suppressed workers. The workers further divide up their labor between behaviorally and/or physiologically distinct subcastes [[1]]. Some years ago, three heavyweight researchers in bee behavior–Breed, Robinson, and Page [[2]]–demonstrated that there are distinct guarding and soldier behavioral castes [[3]]. The guards are typically younger than the soldiers and station themselves at the nest entrance(s). The soldiers don’t fly much, but instead appear to “hang out” on the combs, perhaps waiting for a signal of alarm pheromone from the guards to stir them into action [[4]] to drive off a large intruder (by using warning bumps and/or and stinging).
Practical application: I’m explaining this so that the reader understands the difference between guarding behavior (which takes place at the hive entrance and periphery of the cluster), and soldiering behavior (the sort of mass stinging response to disturbance that beekeepers generally find distasteful). This may be an important distinction, since we may be able to breed for bees with good guarding behavior, without breeding for increased soldiering behavior.
Guard bees are responsible for warding off potential robbers attempting to enter the hive to steal the colony’s precious food stores, or other insects (such as hive beetles or yellowjackets) interested in the protein-rich beebread or brood. Guarding is also important to prevent “social parasitism,” such as that practiced by the Cape bee, in which a foreign “queen” can enter a hive and take over reproduction (similarly, a few bees in a “usurpation swarm” can enter a hive and overthrow the queen [[5]]). Just as a watchful police force is of necessity in human societies that hold items of value, the guard caste is of paramount importance for protecting the resource-rich honey bee nest from thieves and predators (Fig. 6).

Figure 6. The guarding subcaste is the first line of defense at any opening to the resource-rich nest cavity. These guard bees are harassing a foreign worker that drifted, and may not allow her to enter their hive. Should the guards emit alarm pheromone, that cue would then trigger the soldier bees inside to launch a defensive attack.
Worker bees typically engage in guarding behavior when they are around two to three weeks of age [[6]]. There is a genetic component to the proportion of the worker population that act as guards, as well as in determining their persistence [[7]]. Guard bees normally reject non-nestmates attempting to gain entrance to the hive—recognizing them by smell or by their behavior [[8], [9], [10]].
The importance of foreign worker rejection due to their exhibiting the wrong odor is even more important since the invasion of varroa –in an intriguing recent study out of Italy, the researchers discovered that the odor (volatile cuticular hydrocarbons) of adult workers changes when they are parasitized by a phoretic mite. Guard bees mounted a greater defense against previously parasitized workers than against those that hadn’t carried a mite [[11]].
Practical application: perhaps we could breed for this trait, thus helping to prevent invasion of mites into a hive.
Keep in mind, however, that allocating a proportion of the worker caste as guards comes at a cost to the colony as a whole. As explained in a nice overview by Rivera-Marchand [[12]]:
The cost of defense is minor for Africanized bees in the mainland where resources are abundant. These bees can afford to defend instead of storing food, because flowers are available through the year. However, for temperate bees… defense can affect [colony] growth… where resources are limited, it seems that defensive colonies are not able to gather enough resources for reproduction. Colonies with low defensive levels may have a reproductive advantage over the more aggressive colonies …”
Practical application: we can only hope that the fitness advantage gained by the extreme defensiveness of the Africanized bees may be lost as African alleles introgress northward into the established European populations in North America. This may, however, be wishful thinking, since the Western European (“German Black”) feral bees already established in some areas have long been known for their “nastiness” [[13]]. Only time will tell…
In order to overcome the costs involved in defense, European races of honey bees adjust the number of engaged guards conditional on the state of attractivity of their stored resources to competitors—that is, they set plenty of guards when they are protecting their stores from robbers, but once the nectar flow begins in earnest (and robbing pressure presumably decreases), the number of guards at the entrance decreases, and the rejection rate of foreign bees drops to near zero [[14]].
Butler and Free [[15]] found that the appearance of bees exhibiting the characteristic swaying-bobbing flight of robbers (which to a human appears “sneaky”) alerts the guards and increases the amount of guard bee interception of foreign bees. Ditto for the introduction of foreign intruders into the hive. Perhaps surprisingly, they also observed marked bees switching back and forth between guarding, foraging, and robbing. And as anyone who has spent time watching the hive entrance has seen, drifted foragers that act either “self confident” or “submissive” are generally allowed free passage by the guards; if instead they attempt to escape, the guards will grab them and try to sting them. If a drifted foreign bee spends 2-3 hours in a hive, it picks up enough of its new colony’s scent that it is no longer challenged by the guards of that hive.
Since drifting workers may be foragers intent upon robbing, or may carry infectious parasites or pathogens [[16]], it’s surprising to me that guards ever allow any drifting bees into a hive. However, it’s easy to observe that unless there is a nectar dearth, colonies tend not to exhibit many guards [[17]], and drifted bees are typically readily accepted. I suspect that this may have more to do with our unnaturally dense aggregation of hives in apiaries, rather than an innate willingness of colonies to accept foreign workers into their nest.
Investigating this further, I found a couple of studies of interest. One [[18]] found that ant colonies increased production of their soldier caste when the foragers were exposed to foreign ants. Similarly, Butler [[19]] found that introducing foreign bees at the entrance increased the amount of guarding, “suggesting that colonies regulate guard numbers in response to robbing and intrusion.”
On the other hand, Rittschof [[20]] found that colonies repeatedly experimentally disturbed exhibited less guarding behavior—apparently becoming habituated to the disturbance. Perhaps this also occurs in response to the continual drift occurring in an apiary.
The last question in my mind is related to the near-universal desire for beekeepers to breed for gentleness:
Practical breeding question: as much as I love to be able to work my sweet-tempered bees in shorts and tee shirt, has my selection for “gentleness” reduced their propensity to guard the entrance against foreign bees?
So much for between-hive drifting of bees, which certainly accounts for some degree of mite diffusion in an apiary. But far more mites appear to disperse during late-season collapse and robbing.
The sheer numbers involved
Sadly, for the vast majority of colonies in which varroa is inadequately managed, the combination of stress due to the mites, coupled with an in-hive epidemic of one or more viruses, ultimately results in that colony’s unfortunate collapse. At that time, there can be a lot of mites in the hive (Fig. 1).

Figure 1. The above simulation reflects the kind of alcohol wash counts [[21]] that I commonly see in untreated hives stocked with non-resistant bees; to the right are the numbers of mites necessary to produce such counts. That 17,000 figure may sound high, but is supported by simple math and hard data.
Colonies with very high mite numbers often collapse during the late summer or autumn, leaving behind a hive devoid of bees, but full of honey (Fig. 2).
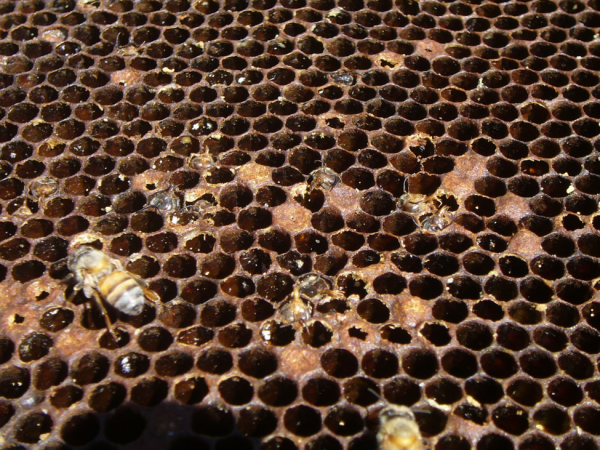
Figure 2. Typical signs of a colony that has collapsed due to a varroa-vectored epidemic of DWV. Note the white fecal deposits from the mites, the bee with deformed wings, and the workers unable to emerge from their cells. The hive may be full of honey, but you’ll rarely see a mite.
So here’s the question: I don’t see any mites remaining in a hive after it’s collapsed—where the heck did they go? Mites don’t just walk out of a hive–they hitch a ride on an exiting bee.
An unanswered question: there are three main possibilities as to where each mite ends up:
- The bee carrying it flies off toward the horizon, and they both die.
- The bee carrying it drifts to another hive.
- The mite hops onto a robber bee to be carried to its
Obviously, options 2 and 3 have significant ramifications for other hives in the area.
The amount of mite drift into other hives
There have been a few studies in which researchers have quantified the amount of mite immigration into monitored hives in an apiary. I put their published data into the chart below (Fig. 3).
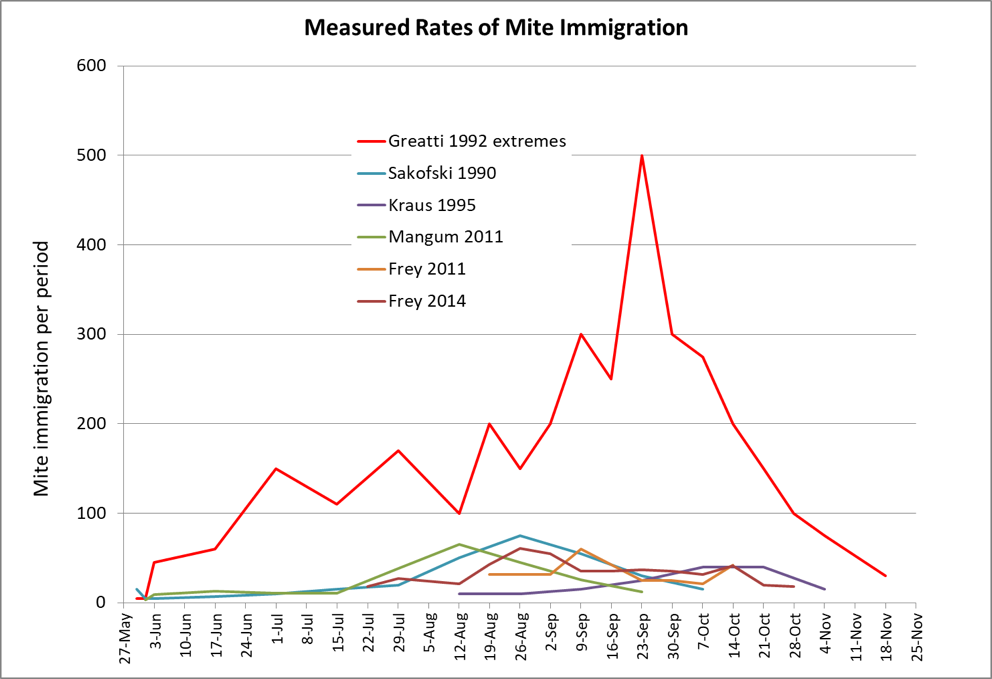
Figure 3. It is apparently not unusual for a colony to experience serious late-season varroa immigration numbering in the hundreds, and sometimes in the thousands of mites, as in the Greatti’s study, for which I used the most extreme values from their monitored hives. Data from [[22]].
The hard data above indicate that mite immigration is typically pretty low early in the season, and then spikes when there is late-season robbing and collapse. Although the counts by Greatti were substantially higher than those of other observers, they may more closely reflect what many of our colonies are experiencing these days.
Greatti counted between 2,000 and 3,500 mites invading each of their 10 monitored hives over the course of a season—with nearly 500 mites invading one hive over the course of 4 days, despite the fact that all surrounding apiaries either had been, or were undergoing, treatment with miticides.
Practical question: is this immigration of mites due mainly to the drifting of workers abandoning their collapsing hive, or instead due to bees engaged in robbing inadvertently carrying them home? And if not the bees in managed apiaries, is it from collapsing feral colonies and/or escaped swarms?
I have yet to see data that answers the above questions. Some research is already underway, and I hope to run an experiment myself this summer in order to help to answer the question. I’ll review some intriguing observations below.
Collapse and Robbing
As a colony begins to collapse, its virus-weakened workers no longer mount a defense against robbing bees; if there is a nectar dearth at the time, other colonies will help themselves to that unguarded honey. Some proportion of the mites in the dying colony would be expected to climb onto those robbers prior to their returning home.
What I found of great interest were the following observations by the Greatti:
It was difficult to discover the source of the mites: the question arises, where mites survive during acaricide treatments, since all the apiaries in the neighbourhood had been treated the year before, and again during September and October, so infestation levels of these colonies were low to moderate. Thus, it seems likely that most mites came from feral swarms. Only two feral colonies were detected near the experimental apiary (about 200 m from it); one was caught, the second did not survive repeated robbing.
After I published Donald Aiken’s data on his mite drops while he was applying oxalic acid vaporization (totaling some 17,000 mites from a single hive), he shared an observation:
The hive I treated and recorded the resulting mite drops from was very strong and produced over 200 lbs of honey. It actually continued to bring in honey after all the flowers were gone from my immediate neighbourhood. I conjectured at the time that they were sucking it out of the fence posts, but in retrospect they must have been robbing out weak hives that were infested with varroa.
Think about the above. Let’s say that foragers robbing a collapsing hive carry fairly heavy loads of honey (50 mg) back home. That would mean that every pound of weight gained by that hive would require 9,000 bee return trips from the hive being robbed. If those returning foragers brought back only 1 mite per every 10 trips, that would still be 900 new mites being brought home for every pound of honey gained!
I suspected that massive mite immigration occurred in some of my monitored hives last fall [[23]], but upon further modeling, I’m now not so sure—I need to monitor actual immigration to confirm.
Research needed: Donald’s observation gives me an idea for quantifying the correlation between robbing and immigration of mites into the robbing hives. In an area such as mine, where there is no natural colony weight gain late in the season, set up a bunch of treated hives on scales, and monitor the mite influx. Then look for a correlation between late-season weight gain and the increase in varroa immigration. This might help to clarify why only some colonies exhibit late-season spikes in mites. If you’re interested in helping to collect such data, see [[24]].
Greatti had another interesting observation [[25]]:
[In only] a few instances was robbing of infested colonies in hives or feral colonies observed… perhaps robbing does not always lead to massive attacks, particularly when other sources of forage are present, and thus it is difficult to observe.
Original from Greatti: “only in a few instances, robbing of infested colonies in hives or feral colonies was observed…Perhaps robbing does not always lead to massive attacks, particularly when other sources of forage are present, and thus it is difficult to observe.”
Greatti had another interesting observation—that in only a few instances was robbing of infested colonies in hives or feral colonies observed, and that perhaps robbing does not always lead to massive attacks, particularly when other sources of forage are present, and thus may be difficult to observe.
The above observation brings to mind Wyatt Mangum’s fascinating article on surreptitious robbing [[26]]. Could it be that as colonies begin to weaken from the varroa/virus complex, this sort of surreptitious robbing allows mites to rapidly disperse to new hives? Remember the previously-mentioned finding by Cervo that mites in highly-infested colonies may be attracted to the odor of foreign bees.
Practical application: prior to varroa, it was evolutionarily adaptive for a colony to steal honey from a weakened neighbor. But today that serving of free honey will likely come with a side order of mites.
I’ve yet to see good data as to the distance that foragers will go to rob; Seeley [[27]] suggests that at the low density in Arnot forest, scant robbing occurs. On the other hand, he and Loftus [[28]] discuss observing a spike in mite infestation levels in hives when a colony 60 meters distant collapsed. But even once we figure out the range for robbing, I’m still left struggling with yet another question:
What happens to all the mite-infested bees when a colony collapses?
We’ve all seen it—an entire colony appears to “disappear” overnight. Since there are no dead bees to be seen, it’s clear that the entire workforce abandoned the hive. The as-yet-unanswered question then is, where do those bees (and all the mites that they’re carrying) go? Do they simply fly off towards the horizon to die? Or do some of them drift into other hives? There is surprisingly little data on this, although Dr. Dennis vanEngelsdorp has mentioned that one of his team found marked bees drifting from a collapsing colony into other hives at considerable distance.
Research needed: this is a crucial question crying for an answer—do all those mite-infested bees just “disappear,” or do they instead flood into surrounding hives? We clearly need far more data on the drifting of marked bees from collapsing colonies to other hives in order to understand why we observe such high rates of late-season mite immigration. It would be fairly simple to quantify the amount of drifting that occurs at collapse by stocking a yard with hives of yellow and black bee stocks, and allowing the hives of one color to collapse, then inspecting the hives of the other color to quantify the number of drifted bees during those collapse events. Please contact me if you’d like to run this important, yet simple experiment in one of your yards.
OK, it’s pretty clear that drift and/or robbing could account for large amounts of mite dispersal into other hives. But as pointed out by Greatti:
The degree of reinfestation of single colonies, on different days of observation, varied greatly; however, the most reinfested or the least reinfested colonies of a group often remained the same in successive observations, and sometimes for long periods of time…Marked differences among colonies of the same group in the same day of observation were often observed…
That’s exactly what I observed with the potential breeder queens that I was tracking last season. I observed huge mite spikes in only half my monitored hives in any apiary—the rest maintained low varroa levels, which then raises the question:
Selective breeding questions: some colonies appear to pick up a huge load of mites in early autumn, yet others somehow manage to maintain very low mite levels. Can we breed for colonies that prevent such mite immigration?
We may not yet know the answers to the above questions, but there is an aspect of apiary management that may be very helpful in minimizing autumn mite immigration.
Swarms coming back to bite you in the Butt
I often hear beekeepers shrug off, “yeah, I think that half my colonies must’ve swarmed this spring” (Fig. 4). But it’s not like those swarms just disappear once they fly off.

Figure 4. It’s easy to rationalize that it was just too hard to prevent your colonies from swarming. But any escaped swarm has the potential to become a “mite factory” whose output you may later come to regret.
Allow me to share one final quote from Greatti:
A lost swarm can be a source of thousands of mites at the end of the season or during the following year, and thus can endanger several colonies, when it may be weakened by heavy Varroa infestation and is consequently liable to robbing by other colonies.
We frequently hear of the propensity of Africanized bees to swarm frequently, but as pointed out by Medina-Flores [[29]], this strategy may be most adaptive in areas with short winters, regular nectar flows, and plenty of nesting cavities:
In the temperate dry region that we studied, blossoms are scarcer, colder temperatures reduce colony reproduction during winter, and its vegetation provides fewer nesting sites than in subtropical regions. Thus, it is less likely for bee colonies to swarm frequently and to establish feral populations in temperate climates than in more tropical environments.
Nevertheless, both Winston and Loftus [[30]] have documented that temperate colonies may swarm several times a season if they crowd their cavity. And the cold-adapted Primorsky Russian bees swarm at the drop of a hat. When conditions are good, it would be normal for most of the hives in an inadequately-managed apiary to swarm at least once per season.
Those swarms carry a starting population of mites with them, and if they are successful at establishing a nest, that varroa population will build up. Depending upon timing, that swarm colony will eventually collapse from the varroa/virus complex—typically with a population of approximately 5,000-15,000 hungry mites. The question is, how many of those mites will make it back into your hives when that collapse inevitably takes place?
Practical application: it appears that one of the most important mite management tools would be to minimize the number of swarms that issue from your own apiary. Remember that every lost swarm has the potential to create a nuisance with your neighbors, to become competition for your bees, and then a mite factory that will eventually collapse. Controlling swarming is good management!
Acknowledgements
Thanks as always to Pete Borst for research assistance, and to all the dedicated and hard-working bee researchers from whose publications I draw useful information.
Notes and Citations
[1] There are genetic components as to how each patriline of sisters behaves, as well as environmental cues and triggers.
[2] Breed, MD, GE Robinson, RE Page (1990) Division of labor during honey bee colony defense. Behav. Ecol. Sociobiol. 27: 395-401. Worth reading!
[3] Reviewed in: Nouvian, M, et al (2016) The defensive response of the honeybee Apis mellifera. Journal of Experimental Biology 219: 3505-3517 doi:10.1242/jeb.143016 Open access.
[4] Suggested by Breed, and supported by my own observations.
[5] https://scientificbeekeeping.com/whats-happening-to-the-bees-part-2/
[6] Winston, ML (1987) The Biology of the Honey Bee. Harvard University Press.
[7] Breed MD, Rogers KB (1991) The behavioral-genetics of colony defense in honeybees—genetic-variability for guarding behavior.. Behav Genet 21:295–303.
[8] Dani, F, et al S (2005) Nestmate recognition cues in the honey bee: differential importance of cuticular alkanes and alkenes.. Chem Senses 30:477–489.
Of interest is that attempting to mask the “foreign” smell with an added odorant may not be effective.
Couvillon, MJ, FLW Ratnieks (2008) Odour transfer in stingless bee marmelada (Frieseomelitta varia) demonstrates that entrance guards use an “undesirable–absent” recognition system. Behavioral ecology and sociobiology 62, Issue 7, pp 1099–1105.
Ratnieks FLW, et al. (2011) Acceptance by honey bee guards of non-nestmates is not increased by treatment with nestmate odours. Ethology 117: 1–9.
[9] Breed, MD, et al (1998) Comb wax effects on the ontogeny of honey bee nestmate recognition. Anim Behav 55:13–20.
[10] Well reviewed by Breed, MD, et al (2015) Chapter 9 Nestmate Recognition in Eusocial Insects: The Honeybee as a Model System in L. Aquiloni and E. Tricarico (eds.), Social Recognition in Invertebrates.
[11] Cappa, F, et al (2016) Bee guards detect foreign foragers with cuticular chemical profiles altered by phoretic varroa mites, Journal of Apicultural Research 55(3): 268-277.
[12] Rivera-Marchand, B, et al (2008) The cost of defense in social insects: insights from the honey bee. Entomologia Experimentalis et Applicata 129: 1–10.
[13] The dark Apis mellifera mellifera bloodline (M mitotype) established itself as feral populations the U.S. early on, This is one reason that the “gentler” Italian and Carniolan (C mitotype) bloodlines were more popular. Many of us older beekeepers remember the “hot” dark feral bees that used to be common, and the studies by Magnus and Szalanski (https://scientificbeekeeping.com/whats-happening-to-the-bees-part-5-is-there-a-difference-between-domesticated-and-feral-bees/) confirm that the M line of bees still thrives in some areas.
[14] Downs SG, Ratnieks FLW (2000) Adaptive shifts in honey bee (Apis mellifera L.) guarding behavior support predictions of the acceptance threshold model.. Behav Ecol 11:326–333.
[15] Butler CG, Free JB (1952) The behaviour of worker honeybees at the hive entrance. Behaviour 4:262–292.
[16] As noted by Free, the “infrequency, or absence, of drifting of bees between wild colonies may be one reason why they are comparatively free from disease.”
[17] At least with the gentle bee stock the I keep; I’m curious as to the degree of guarding exhibited by wild-type bees. Please let me know if you have observations.
[18] Passera, L, et al(1996) Increased soldier production in ant colonies exposed to intraspecific competition. Nature, 379, 630-631.
[19] Butler CB, Free JB (1952) The behaviour of worker honeybees at the hive entrance.. Behaviour 4:262–292.
[20] Rittschof, CC & GE Robinson (2013) Manipulation of colony environment modulates honey bee aggression and brain gene expression. Genes, Brain, and Behavior 12(8): 802–811.
[21] Per half cup of bees.
[22] I either took published numbers from tables, or scaled data off of published graphs. Since the various authors collected data over different time intervals, I needed to take some liberties in adjustment in order to create the graph.
Sakofski, F, et al (1990) Seasonality of honeybee colony invasion by Varroa jacobsoni Oud. Apidologie 21:547–550
Greatti M, Milani N, Nazzi F (1992) Reinfestation of an acaricide-treated apiary by Varroa jacobsoni Oud. Exp Appl Acarol 16:279–286
B Kraus, Re Page Jr. Population growth of Varroa jacobsoni Oud in Mediterranean climates of California. Apidologie, Springer Verlag, 1995, 26 (2), pp.149-157.
Mangum, WA (2011) Varroa immigration and resistant mites. ABJ 151(5): 475-477.
Frey E, Schnell H, Rosenkranz P (2011) Invasion of Varroa destructor into mite-free honeybee colonies under the controlled conditions of a military training area. J Apic Res 50:138–144.
Frey E, Rosenkrantz P (2014) Autumn invasion rates of Varroa destructor (Mesostigmata: Varroidae) into honey bee (Hymenoptera: Apidae) colonies and the resulting increase in mite populations. J Econ Entomol 107:508–515.
[23] See my article “Selective Breeding for Mite Resistance,” which should be posted to my website by the time of publication of this piece.
[24] https://scientificbeekeeping.com/suggested-protocol-to-determine-amount-of-mite-immigration/
[25] I slightly paraphrased this quote to make it read better.
[26] Mangum, W (2012) Robbing: Part 2: Progressive robbing. ABJ 152(8): 761-764.
[27] Seeley, TD (2007) Honey bees of the Arnot Forest: a population of feral colonies persisting with Varroa destructor in the northeastern United States. Apidologie 38: 19–29.
[28] Loftus JC, ML Smith, TD Seeley (2016) How honey bee colonies survive in the wild: testing the importance of small nests and frequent swarming. PLoS ONE 11(3): e0150362.
[29] Medina-Flores CA, et al 2014. Africanized honey bees (Apis mellifera) have low infestation levels of the mite Varroa destructor in different ecological regions in Mexico. Genet.and Mol. Res. 13:7282-7293.
[30] Winston, ML (1987) The Biology of the Honey Bee. Harvard University Press.
Loftus JC (2016) op cit. (and Seeley, pers. comm.)
First published in: American Bee Journal, April 2018
Contents
Bee Drift and Mite Dispersal 1
Dispersal of varroa. 2
Phoresy, grooming, and host preference by the mites. 3
The shifting of varroa’s preferred transport. 6
Our unnaturally close placement of hives in apiaries. 7
Measured rates of hive-to-hive worker and drone drift. 7
The Diffusion of Mites. 8
Are some hives more attractive to drifting bees?. 10
Are there other reasons that bees drift?. 10
Altruistic self removal 11
Manipulation of host behavior. 12
Competition and the weaponization of infectious parasites. 14
Next Month. 14
Acknowledgements. 14
Notes and Citations. 14
The Varroa Problem: Part 16a
Bee Drift and Mite Dispersal
First Published in ABJ April 2018
Randy Oliver
ScientificBeekeeping.com
The success of any parasite is dependent upon its ability to disperse to new hosts in order to ensure the propagation of its bloodline. To do so, varroa has a number of tricks up its sleeve. Unfortunately, our beekeeping practices play right into the mite’s hands.
In my previous article, I relayed my suspicion that the bee drift from, or the act of robbing of collapsing colonies accounted for the sudden late-season spike in mite counts that I observed in a proportion of my potential breeder hives. Most frustratingly, since we had varroa well under control in all of our apiaries, I can only conclude that drift of mites must have come from feral or poorly-managed colonies outside of our control. This late-season onslaught of mites is one of today’s hottest topics among beekeepers struggling to keep their hives alive. So I’ve dug deep into the subject of the drifting of bees and mites from hive to hive.
Dispersal of Varroa
Varroa is considered to be a minor parasite of its native host Apis cerana [[1]]. It was a different story when it was introduced to Apis mellifera. But even then, an annual treatment with Apistan® was initially all it took to keep your colonies alive from year to year. Unfortunately, those days were not to last, since a previously ignored virus–deformed wing virus (DWV)–quickly evolved to form a mutually-beneficial (yet diabolical) symbiotic relationship with the mite. Here’s how their deadly game is played:
- The mite, which appears to be immune to the virus [[2]], transmits DWV to both adult and pupal bees. The virus in return, suppresses the pupal immune response, thus allowing the mite to be more successful at reproduction in pupae that are seriously infected by DWV [[3], [4]].
- Those DWV-infected worker bees that successfully emerge to engage in nursing, then transmit the virus to the larvae that they feed. Fortunately, those larvae are generally able to contain the infection, and the virus doesn’t seriously harm the bee colony until the mite reaches a very high infestation rate in the hive come late summer or autumn–at which point the virus gets out of control and causes the colony to collapse, just as robbing becomes prevalent.
- At this time the mites get carried from the collapsing hive to robbing colonies, thus successfully dispersing successful strains of both the mite and virus to new host hives.
What a perfect match—a mite and a virus unwittingly working in harmony to kill their host colony at just the right time for optimal dispersal!
Practical application: the above successful dispersal appears to be exactly what inundated my strong potential breeder hives with mites last fall—they must have robbed out collapsing colonies within flight range.
But it’s not only the mite and virus that are partners in this coevolutionary process—both the bee and the beekeeper are also involved, and the success of the above game is dependent upon us continuing to do two things. So long as beekeepers stubbornly restock their operations with non-resistant bee bloodlines and fail to control the mite, this problem will continue. And it is further exacerbated by our placing large numbers of colonies close together in apiaries.
Practical application: Biologically, this is a fascinating example of evolution taking place before my very eyes—the mindless process of natural selection has allowed a formerly obscure insect virus to rapidly evolve to take advantage of a recently-introduced vector (varroa) in an artificial situation created and sustained by beekeepers themselves.
Since I can’t imagine that we will ever dispense with keeping our hives in apiaries, as a biologist it’s clear to me that the only way out of this situation is for our beekeeping practices to also evolve–by switching to keeping resistant bee stocks, and learning to control varroa earlier in the season. Hence my being a cheerleader for the selective breeding for mite resistance, and for better understanding mite management.
| Side notes:
1. Many beekeepers nationwide experienced serious losses this winter, depleting the supply of strong colonies for almond pollination. The usual suspects—drought and poor varroa management—are likely to blame, but there is reason to suspect that a more virulent form of DWV may be involved, as it appears to be in the process of spreading throughout the country [[5]]. This variant has been associated with elevated colony mortality in Europe [[6]]; I hope to soon report on the analysis of the samples shipped to me in 2016 from across the U.S.
From what I’m hearing, those beekeepers who got varroa under control early last season were less affected. This would make sense, since it would help to prevent their colonies from entering winter while their virus epidemic was still raging.
Practical application: by waiting to control varroa until after you’ve pulled the honey, it may be a case of “too little, too late”—it takes a long time for the colony to get DWV back under control after a mite treatment, which may result in your colonies dwindling over the winter and perhaps struggling in spring [[7], [8]].
The other prime factor in drought years is nutrition—in order to thrive, a colony needs good nutrition to rear the generation of brood that will form its wintering cluster. Not only that, but during a warm winter, such as we experienced in California this season, a colony will need enough pollen or sub in January to get a round or two of brood reared prior to almond bloom. I had photos of brood combs sent to me at the beginning of bloom, looking pretty sick from what appears to be nutritional stress.
2. There’s been a lot of buzz about the serendipitous finding that lithium salts might be useful as a varroacide [[9]]. Unfortunately, the paper did not point out an important finding detailed in the authors’ patent application—that lithium is highly toxic to bee larvae. Please do not mess around with this chemical—qualified researchers will be running field trials this season. |
Phoresy, grooming, and host preference by the mites
Just when beekeepers are starting to learn to use the word “phoretic” to describe hitchhiking mites, Samuel Ramsey [[10]] points out that that is actually an improper use of the term, since the mites clearly feed upon the bee upon which they are riding (Figs. 1 & 2).
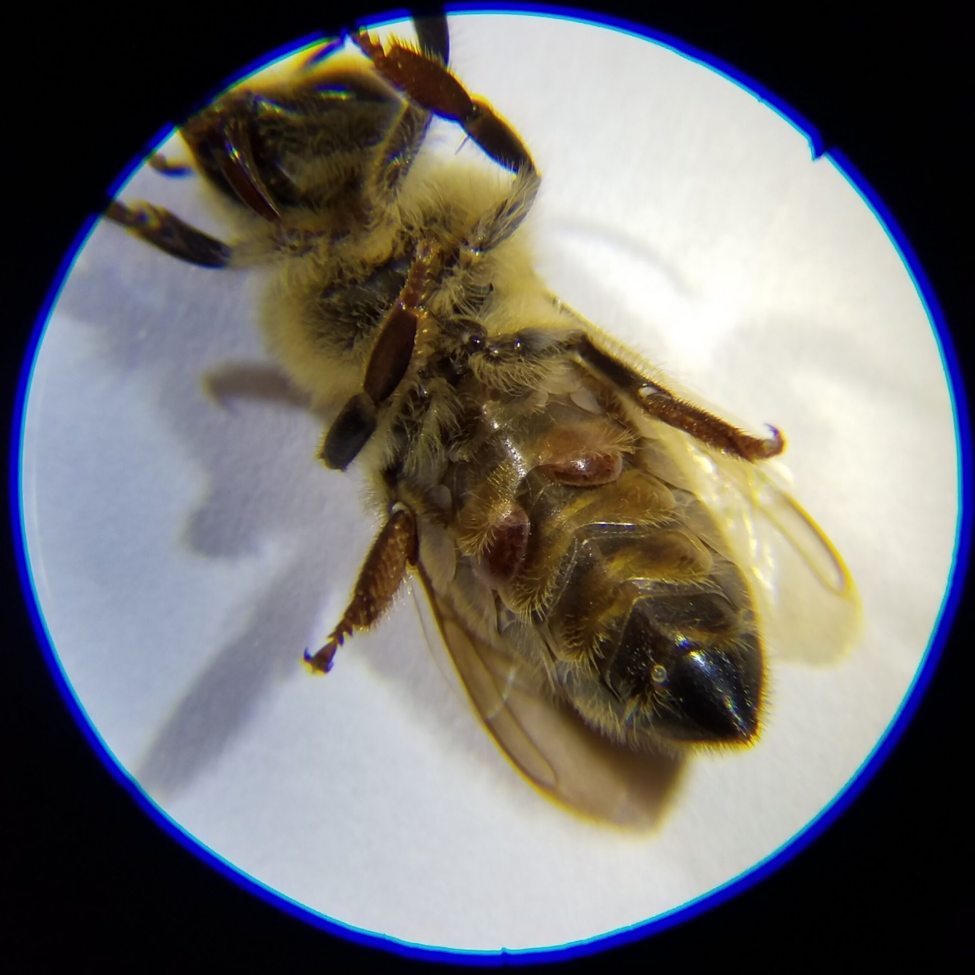
Figure 1. Two mites feeding upon a worker bee. For some unknown reason, the mites generally favor the left-hand side. It is difficult for a mite to gain safe access to the bee’s soft integument anywhere else on its body. Thanks to beekeeper Scott Koppa for permission to use this photomicrograph.
The definition of phoresy is: an association between two organisms in which one (e.g., a mite) travels on the body of another, without being a parasite. Ramsey points out that the mites are indeed feeding on the bee’s fat bodies, so technically they are in the dispersal phase. But rather than confusing things, I’ll just stick with the term phoretic to describe mites hitchhiking on adult bees until our good Editor tells me otherwise.
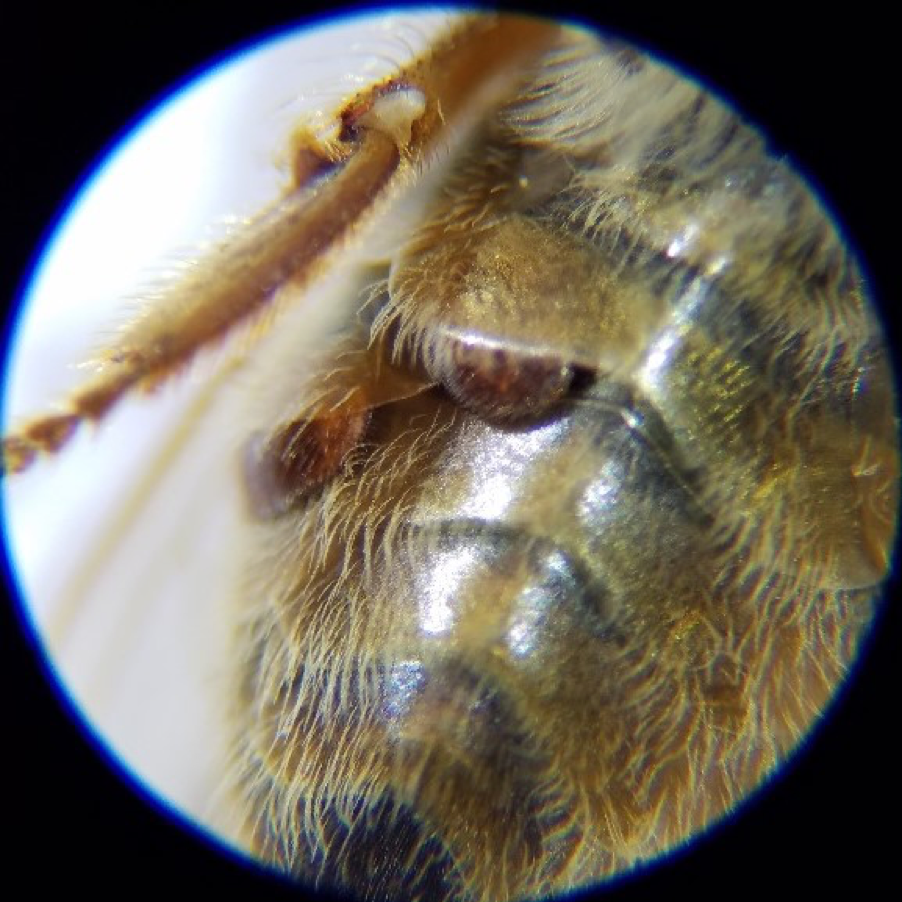
Figure 2. An even closer view. Dispersing female mites require both moisture and food while they are riding on a bee, waiting to find a prepupal cell to invade. In this position, tucked under an abdominal sternite, they can safely feed while avoiding being groomed off by their unwilling host. Thanks again to Scott Koppa for sharing these photos.
I hear a lot of optimism for selecting for bees that appear to exhibit better grooming or biting behavior against the mite. But keep in mind that Apis cerana has a long history with varroa, and shows it no mercy—fervently self- and allogrooming (one bee grooming a mite off another). Yet, as pointed out by Rath [[11]]:
Grooming workers have no chance to grab the parasite once an adult female V. jacobsoni reaches a position on the host where its concave ventrum fits closely to the rounded bee body. In this respect, the peculiar shape of V. jacobsoni is a morphological adaptation to the bees’ intensive grooming.
Indeed, varroa can successfully survive for a full year between bouts of drone brood rearing, all the while riding on hostile Apis cerana workers. This despite the fact that a mite can’t stay on the same bee indefinitely. Mites prefer to ride on nurse bees, likely for two reasons: (1) the nurses are more nutritious—having well-developed fat bodies, and (2) nurses are the only bees in the hive that stick their heads into a brood cell—a requisite behavior for a mite wanting to reproduce. But in a few weeks that nurse bee will graduate to foraging, and will then typically die in the field within another couple of weeks. That means that for a mite to survive in the hive, it will need to continually switch rides—thus exposing itself again and again to being groomed or bitten. Yet enough mites manage to survive in those inhospitable colonies to carry on.
In my modeling of mite population dynamics, I use the well-established figure of 0.5% of the mites dying per day from “natural” mortality (including grooming)–that’s only 1 mite out of 200 dying each day. If a colony were able to cause the death of only 2% of its mites each day, varroa would go extinct, since the mite death rate would exceed its reproductive rate. We haven’t seen that happen in any population of bees.
Practical application: although I strongly support selecting for bees that recognize and attack the mite, I’m not holding my breath that Apis mellifera is going to be able to become much better at grooming varroa than is A. cerana.
In support of the above, Kruitwagen [[12]] recently published a paper that found that the naturally-resistant Apis mellifera colonies that they studied did not groom any more intensely than did non-resistant bees.
The shifting of varroa’s preferred transport
Now here’s where it gets really interesting—back in 1997, Kuenen and Calderone [[13]] found that newly-emerged mites generally preferred to move off their newly-emerged worker (or drone) and onto a nurse bee. But a percentage of those mites appeared to be attracted to older workers. They pointed out that:
Colonies, like individuals, eventually die, thus mites must have some mechanism for transferring to new host colonies. Foragers leave the colony on a regular basis, thus mite presence on foragers may represent an avenue for mite movement from one hive to another. The transfer of mites among colonies likely occurs as foragers drift between colonies, and in temperate climates mite transfer rates are much higher during periods of nectar dearth, a time period during which robbing among colonies is more likely to occur…For reproduction, we would expect the mites to move onto bees that will most likely bring them near, or into contact with, brood susceptible to infestation. However, for dispersal to another bee colony we would expect mites to move onto foragers, perhaps foragers from a different colony (a forager that drifted into the colony or a robbing bee).
A study by Cervo [[14]] supports the above reasoning. He found that at varroa infestation rates greater than 20 mites per hundred bees, the odor profile differences between nurses and foragers decreased, and that instead of 70% of the mites preferring to ride on nurses, they then split equally between nurses and foragers. Furthermore, although their results were not statistically significant, there did indeed appear to be a trend toward mites increasing their preference for “foreign” foragers over “home” foragers as the infestation rate increased.
And then Nolan [[15]] took it a bit further. He hypothesized that a mite that had already gotten one round of broodrearing under her belt might be more willing to take the risk of catching a ride outside of the hive. He found that although all mites, upon emergence, preferred young bees, those mites that had already reared a generation of offspring were more likely to hitch a ride on a forager (including bees from another hive) than were young mites emerging for the first time.
Practical application: it appears that as the mite level increases in a colony–and the mite population begins to age–that the mites become less risk averse. They then begin to act like rats ready to catch a ride off a sinking ship–which makes perfect evolutionary sense. And we beekeepers then make it sooo easy for those rats to successfully find a new ship nearby.
Our unnaturally close placement of hives in apiaries
Fries and Camazine [[16]] long ago pointed out that:
The drifting of bees into the wrong colony occurs frequently in apiaries where colony densities are greater than under natural conditions. In contrast, there is little or no evidence for disease transmission by drifting of individuals between feral colonies in the wild. In most cases, colonies are widely separated, precluding drifting of bees from one colony to another.
In nature, colonies are often widely separated, according to the availability of suitable nesting cavities and the carrying capacity of the landscape. For example, Seeley [[17]] counted a density of about 2.5 colonies per square mile in the Arnot Forest (both before and after the arrival of varroa). Under those conditions, even a foggy-headed errant forager could likely find its way home by smell, and there would be little expected drift or robbing between colonies.
According to Hepburn [[18]], the observed range of nest density of A. mellifera is from 1-20 per square mile. However, the number of managed hives has been increasing worldwide, so in areas of favorable forage, colony densities are more likely to be at the upper end of the above range. Jaffé [[19]], extrapolating from the genetic diversity of sampled drones, estimated that typical colony density in temperate regions nowadays is in the range of 15-20 colonies per square mile. A quick calculation of the number of hives that my sons and I maintain in the 85 sq. mi. area around my home supports this estimate. And that is not to mention those apiaries in other areas where I commonly see over a hundred, or even thousands, of hives in close proximity.
Practical application: at the above hive density (an average of 15 hives within a half-mile flight radius), it’s no wonder that there is a great deal of bee drift and robbing, making it easy for varroa to disperse from hive to hive.
Measured rates of hive-to-hive worker and drone drift
Beekeepers need to keep in mind the great amount of drifting of bees that typically occurs in apiaries. When we place numerous similar-looking hives all at ground level in an apiary, we create an unnatural situation to which bees are not evolutionarily adapted. A number of researchers have documented the occurrence of a substantial amount of drifting of workers from hive to hive, even before varroa entered the picture. Jay [[20]] found that in palletized hives some 5-10% of marked bees drifted within a pallet. And when non-palletized hives were placed in rows of three, he found [[21]] that up to 35% of marked bees introduced to the center hive drifted to a hive on either side.
In another study of hives placed in rows, Pfeiffer and Crailsheim [[22]] found that 50 – 90% of marked bees drifted out of their parental hive into other hives, and that approximately 15% of those drifting bees switched hives at least three times during their lifetimes. They calculated that up to 40% of the workers in a hive may not have been “born” in that hive.
Surprisingly, they found that there was greater amount of drifting of bees from hives with a high brood-to-worker ratio (typical of rapidly-growing colonies)—I have no explanation for this. However, they found no correlation between the amount of drifting and the number of varroa mites in a hive (but none of their colonies collapsed due to varroa).
J.B. Free [[23]] found that most drifting takes place during the early orientation flights of workers, and that bees tend to drift from weak colonies to strong ones. In support of the hypothesis that drifting is an artifact of confusion, studies by Pfeiffer [[24]] and Jay [[25]] indicate that most drifting is to adjacent hives. Another study using RFID tags [[26]] confirms a large amount of in-apiary drift, as well as the occasional bee drifting to a colony at least a half mile distant. Seeley [[27]] documented up to 50% drifting of drones between hives in an apiary with “normal” colony spacing, compared to scant drift when colonies were dispersed roughly 100 feet apart. Such drifting of drones was likely evolutionarily adaptive prior to varroa, since it allowed for the better dispersal of a colony’s genes (since drones could hopscotch from one colony to the next to reach congregation areas normally too far away to reach).
Practical application: it may no longer be adaptive for colonies to accept foreign drones.
On the other hand, Goodwin [[28]], using painted bees, observed only ~1% worker drift during summer from varroa-collapsing hives into adjacent hives. This result is especially surprising, since the same author had previously documented that at least 13% of painted bees could drift to adjacent hives during a two-day period [[29]].
Practical application: although drifting due to confusion and misorientation can be substantial in an apiary, it’s not yet clear to what extent this contributes to the dispersal of phoretic mites from hive to hive. In any case, wider spacing between hives, landmarks, and distinct coloration of the boxes may help to reduce drift.
The Diffusion of Mites
The steady drifting of workers from hive to hive creates a ready transport system for varroa within a neighborhood. A study by the Tucson lab indicates that workers exiting a hive carry mites on their bodies at very close to the overall infestation rate of adult workers in the hive [[30]]. A couple of recent studies attempted to determine the effect of colony spacing upon mite buildup [[31], [32]]—both gave results that suggested some degree of mite drift was taking place, especially in late summer.
Similar to molecules, varroa mites would thus be expected to diffuse in an area’s bee population from hives of high “mite concentration” to hives with low concentration (Fig. 3).

Figure 3. The physical process of diffusion—the movement of particles from an area of high concentration into areas with a lower concentration. If the hive-to-hive drift of bees in an apiary worked the same way, it would tend to equalize the mite count between hives. It’s not clear to what extent this actually occurs.
If such drifting were random, then we’d expect the net result to trend towards an equalization of mite infestation rates throughout the apiary, since diffusion would favor the movement of mites from colonies with a high infestation rate to those with low infestation rates. The greater the “diffusion gradient” (between high-mite and low-mite hives), the greater the effect.
So what is the actual amount of mite transfer from high-mite hives to the rest of the colonies in an apiary? In order to get an idea, I ran a simulation, and looked at the number of mites that would be expected to be carried out of the hive each day on aging bees, but not expected to return to the hive (Fig. 4).
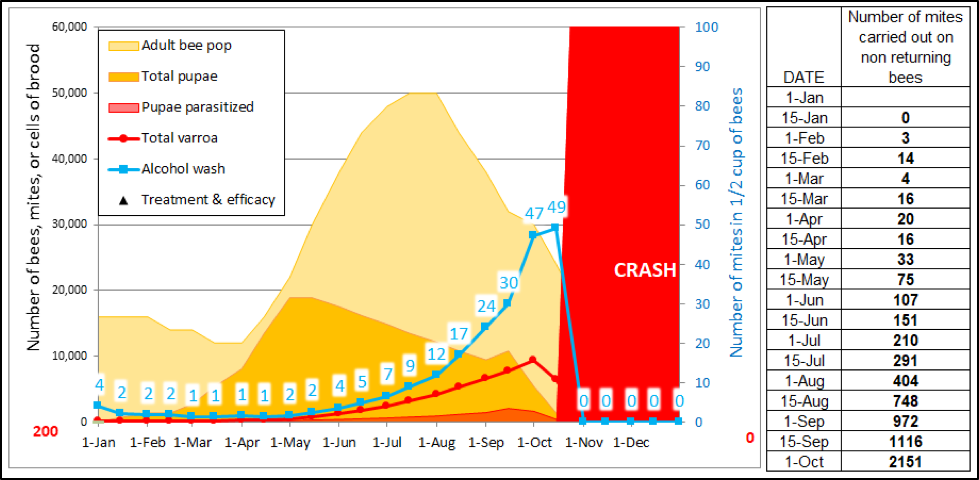
Figure 4. An example of a high-mite hive collapsing in the fall. Even before it collapses, it is spewing out mites every day on the bees that are lost from the hive due solely to aging. The figures to the right are independent of any hive-to-hive drifting, but indicate the sheer numbers of mites being lost to somewhere in the environment during each 15-day time period.
In reality, however, I’m not clear to what extent those emigrating mites make their way into other hives (I’ll show some measured numbers later in this article). There are far too many unknowns for me to attempt to calculate firm numbers, but my model suggests that even a daily immigration of 10 mites does not make an appreciable difference to a hive receiving at least one mite treatment per season.
Practical observation: in my monitoring for mites, I frequently find colonies with mite counts above 50 sitting right next to hives with counts close to zero, despite all colonies in that yard having been started from nearly identical nucs with sister queens earlier in the season. The question then, is whether those low-mite hives are somehow “dealing” with the mite drift, or driving off potential drifters, or something else.
Update May 2019: In order to answer some of these questions about colony-to-colony bee and mite drift, I performed a large field trial during late summer of 2018. I hope to publish the surprising results soon. I’m also engaged in a citizen science project in 2019 to collect hard data on mite immigration in hives across the U.S.
Are some hives more attractive to drifting bees?
This brings to mind a conversation that I had years ago with Dr. Jerry Bromenshenk, as we discussed the results of his electronic entrance bee counters. He found that some hives in each yard consistently gained more bees from other hives than they lost, and suggested that the reason that some colonies grow so strong is that they are more attractive to returning foragers.
Practical application: prior to varroa, it may have been advantageous to a colony to pick up stray bees, but the table may have now turned. Could it be that a potential trait for mite resistance is a colony’s lack of pheromonal or other olfactory attractiveness to bees from other hives?
Are there other reasons that bees drift?
The ability of bees to return to their parent hive with pinpoint precision is well known. One can easily observe this by moving a hive a foot to the side, and then watching as returning bees hover where the entrance was previously located–before finally relocating their hive by smell. Without such incredible navigation ability, a colony would lose too many foragers each day to be able to survive.
Thus, when the discussion of bees “drifting” to other hives comes up, I wonder why it occurs. I can understand the propensity of drones to drift, since there would be an evolutionary advantage for them to disperse widely, but that would not apply to the sterile workers. If anything, one would think that honey bee colonies would do everything possible to avoid drift for two main reasons: (1) workers accidentally drifting away from their hive would be a lost investment of resources, and (2) foreign bees trying to get into a hive would be expected to be robbers, or if not, potential carriers of pathogens. That said, there are some reasons that such drifting may occur, other than simple confusion in a crowded apiary.
Altruistic self removal
Kralj and Fuchs [[33]] found that exiting bees carrying a mite spent more time on flights, exhibited poorer orientation ability, and were less likely to return than bees not carrying a mite. Additionally, a fifth of those that did return had somehow lost their mite (perhaps to another bee on a flower, or at another hive entrance). The authors hypothesized that this self-sacrifice of infested workers:
…could be a more general response to diseases, and might be a trait which could be enhanced in breeding programs to strengthen the behavioural defence against V. destructor and, possibly, to other honey bee diseases.
Practical application: I heartily agree. In creating my varroa model, I needed to factor in the loss of the thousands of mites on the outgoing bees that don’t return–which allows the colony to shed a lot of mites in late summer and fall when the colony is shrinking (Fig. 4). Keep in mind the concept of intolerance—if every bee responded to the feeling of a mite on its body by immediately flying out of the hive and sacrificing itself, varroa would no longer be a problem.
The same authors later found that nosema-infected bees also self sacrificed and/or oriented towards the wrong hive entrance [[34]].
Practical application: this misorientation to an adjacent hive entrance may help to explain why I observed that if a colony gets sick, its immediately-adjacent neighboring hives also tend to get sick. Kralj and Fuchs found that mite-infested bees were twice as likely to return to an adjacent “dummy” entrance than to the proper entrance to their hive—over 70% of mite-infested bees initially oriented to the wrong entrance.
Rueppel [[35]] followed up by elegantly demonstrating that bees that sense that they are sick readily sacrifice themselves for the good of the colony, terming the trait altruistic self-removal. Such suicidal altruism for the good of the colony is similar to a worker sacrificing herself by stinging in defense of her hive. Furthermore, sick bees tend to exhibit a different odor profile, which is recognized by their nestmates, often resulting in aggressive behavior towards the sick individuals that may result in them being driven out of the hive [[36]]. Baracchi [[37]] found that DWV changes the odor of infected bees, inducing aggressive behavior by other workers towards the infected bees.
There may, however, be additional factors at work…
Manipulation of host behavior
Note that Kralj and Fuch found that although some parasitized bees committed self-sacrifice, others attempted to return home, but had difficulty orienting to the right hive entrance. Could it be that the parasite was affecting their behavior?
It’s been well established that infective pathogens often manipulate the behavior of their hosts to the parasite’s advantage [[38]]. Rabies virus causes infected animals to bite others; Toxoplasma protozoans cause rats to be attracted to cat urine and to engage in risky behavior. And humans become temporarily more sociable when injected with a flu vaccine [[39]].
The coevolution between Tomato yellow leaf curl virus and its vectors—aphids and whiteflies—is especially of interest, since it is similar to that of DWV and varroa. The sapsucking insects normally prefer the odor of virus-infected plants, since the virus suppresses the immune system of the plant, thus allowing the insects to grow and reproduce more efficiently on infected plants (similar to how DWV enhances varroa reproduction on infected pupae). But when an insect itself becomes infected by the plant virus, the virus causes the insect to seek uninfected plants—thus assisting in the transmission of the virus to new hosts [[40]].
So how about the bee viruses? Some of them replicate in the bees’ brains and appear to affect homing ability or other behaviors [[41]]. DWV replicates in the parts of the brain responsible for vision and olfaction (Fig. 5) [[42], [43]], and one strain has been identified as causing changes in bee defensive behavior [[44]]. I wouldn’t be the least bit surprised if some bee viruses modify workers’ behavior to drift to other hives.
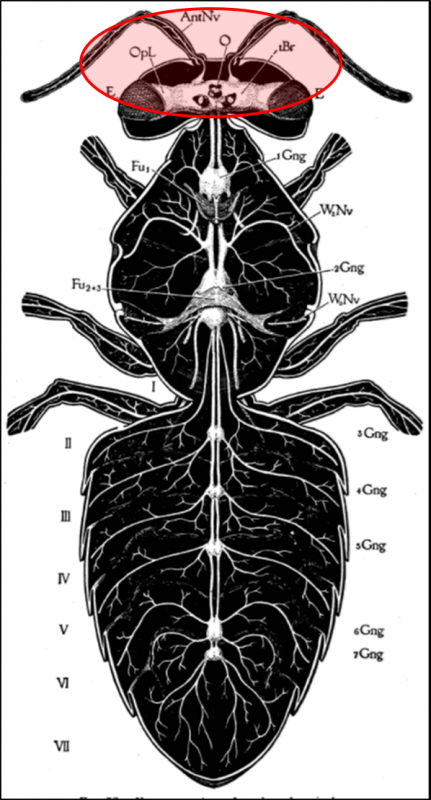
Figure 5. Viruses display tissue tropism, i.e., the adaptation to infect specific tissues. DWV replicates in various tissues of the bee, including those of the brain, suggesting that it is to the virus’s advantage to do so. Could it be that such infection causes poorer orientation and homing ability, perhaps leading to increased drifting to other colonies? Drawing from Snodgras [[45]].
It also occurs to me that there could be a dark trait of the honey bee that I have yet to hear being discussed in scientific circles:
Competition and the weaponization of infectious parasites
I can see an evolutionary advantage to the colony when sick workers fly away to die. But I observe that something else also occurs. In my field trials, I time and again observe that when a colony sickens, its immediately-adjacent neighbors tend to sicken and fail too. I can only assume that this is due to sick bees entering a neighboring hive [[46]], rather than simply flying away to die. It occurs to me that this may not be accidental.
Try visualizing a natural landscape of bee colonies as a bunch of small permanent “tribes” of sterile soldiers, each protecting the single fertile female of their bloodline. All tribes would be competing against nearby tribes for resources, and avoid each other’s foraging areas [[47]], robbing from each other at every chance (think of the relentless robbing pressure when hives are stocked beyond the carrying capacity of the landscape), and whose greatest threat is starvation due to competition for food.
It would be adaptive for any individual soldier, should it feel sick, to commit altruistic self-removal for the good of its tribe. At that point it could no longer help to promote the genes of its parent tribe– unless at that point that soldier took the further step of invading and dying in a different tribe, thus transmitting whatever pathogen it was suffering from to the competing tribe. Since its parent tribe had already been exposed to that pathogen, sharing the infection would have no downside to its bloodline, but would have the upside that the competing soldier tribe would now be equally exposed to the pathogen that the parent tribe was already forced to deal with. Such action would help to level the evolutionary playing field, and perhaps even knock out the competition—to the benefit of its parent tribe. It appears to me that such Trojan Horse behavior would favor the evolutionary success of a colony, even if it doesn’t seem like “fair play” to us humans. It would also explain why tribes set guards to prevent such Trojan Horses from entering.
A scientific challenge: so my question is, is there any reason to think that bees wouldn’t weaponize their parasites? It would be of huge evolutionary advantage to any colony exhibiting some degree of genetic resistance to that parasite to make sure that the competition was also having to deal with the disease. Some bright grad student could test this hypothesis by following the method used by Rueppell [[48]].
Update from the 2018 American Bee Research Conference:
Parasite manipulating hosts? Nosema ceranae infected honey bee workers are more easily accepted by non-nestmates
Yujie Li1, ZacharyY. Huang2
Parasites have been known to manipulate host physiology or behavior so that their own fitness is increased. Richard Dawkins cites many examples of this in his book, The Extended Phenotype. One of the examples he cited was that honey bees infected with Nosema apis will become foragers earlier and this might be beneficial to the parasite. We have previously shown that even though Nosema infection increases juvenile hormone biosynthesis and results in higher hormone titers (Huang & Lin, 2004 Eighth International Conference on the Juvenile Hormones, Scientific Program Abstracts p. 12), this is most likely not host manipulation because infected bees also showed increased higher metabolism.
Honey bee workers show guarding behavior with specialized “guards,” with an average age of ~14 days (Huang et al., 1994 J Comp Physiol A 174: 731–739). They “smell” each incoming forager and reject those that do not belong to the same colony. It is possible that Nosema might change host “smell” such that infected bees will be more easily accepted by non-nestmates, so that the pathogen may gain entry to a new colony to increase its fitness. The aim of this work is to determine whether honey bee workers infected with Nosema ceranae will become more easily accepted by non-nestmates. If so, it will more likely be a case of Nosemamanipulating the honey bee hosts.
We infected newly emerged worker bees with 50,000 fresh spores by feeding then with 2 microliters of 50% sugar syrup. Control bees were fed with syrup alone. The bees were then isolated in glass vials for 30 min to ensure all food was consumed to reduce Nosema spore transmission among bees. The bees were then caged for 7 days in the laboratory. On the 8th day, they were presented to a non-nestmate guard bee using a standard nest-recognition assay (Breed et al., 2004 Animal Behaviour 68: 921–928). We repeated the experiment with bees from 3 different colonies, each of them presented to four different recipient colonies.
There was a significant reduction in the percentage of bees rejected by non-nestmates when bees were infected with Nosema ceranae, compared to those not infected. We also found a significant colony effect for the colonies that provided the guard bees; the interactions between infection status and guard colony source were also significant. Source of infected bees did not differ significantly in their acceptance. These results suggest that besides other changes made by the microsporidian parasite, Nosema ceranae can also reduce aggression toward their host, perhaps to increase their spread to other colonies. The most likely mechanism is a change of hydrocarbons in the infected bees which will be investigated in a follow up study.
Next Month
I plan to cover why colonies allow bees to drift in and how those escaped swarms come back to bite you in the butt.
Acknowledgements
Thanks as always to Pete Borst for research assistance, and to all the dedicated and hard-working bee researchers from whose publications I draw useful information.
Notes and Citations
[1] Surprisingly, as pointed out by Rath in 1999 [[1]]: The important issue of mite dispersal among A. cerana colonies has not yet been studied.
[2] DWV virus has never been found in any varroa tissue other than the gut, and even then it’s not completely clear whether it is reproducing in varroa tissue. This question is far from resolved, and a paper currently in press claims to have detected DWV replication within the mite. One informative paper is: Erban, T, et al (2015) In-depth proteomic analysis of Varroa destructor: Detection of DWV-complex, ABPV, VdMLV and honeybee proteins in the mite. Scientific Reports doi:10.1038/srep13907
[3] Di Prisco et al (2016) A mutualistic symbiosis between a parasitic mite and a pathogenic virus undermines honey bee immunity and health. PNAS 113(12): 3203–3208. See Fig. 3 in the Supplemental Material, in which the mites exhibited nearly twice the reproductive success in pupae that later emerged with deformed wings.
[4] Piou V, et al (2016) Impact of the phoretic phase on reproduction and damage caused by Varroa destructor (Anderson and Trueman) to its host, the European honey bee (Apis mellifera L.). PLoS ONE 11(4): e0153482. Similar to above, the mites infesting pupae that developed deformed wings had more offspring.
[5] Ryabov, EV, et al (2017) Recent spread of Varroa destructor virus-1, a honey bee pathogen, in the United States. Scientific Reports 7: 17447. Open access.
[6] Natsopoulou, ME, et al (2017) The virulent, emerging genotype B of Deformed wing virus is closely linked to overwinter honeybee worker loss. Scientific Reports 7: 5242. Open access.
[7] Locke B, et al (2017) Persistence of subclinical deformed wing virus infections in honeybees following Varroa mite removal and a bee population turnover. PLoS ONE 12(7): e0180910.
[8] Wu, Y, et al (2017) Characterization of the copy number and variants of Deformed Wing Virus (DWV) in the pairs of honey bee pupa and infesting Varroa destructor or Tropilaelaps mercedesae. Front. Microbiol., https://doi.org/10.3389/fmicb.2017.01558 Open access. A good review of our current knowledge.
[9] Ziegelmann, B, et al (2017) Lithium chloride effectively kills the honey bee parasite Varroa destructor by a systemic mode of action. Scientific Reports 8:683.
[10] In prep.
[11] Rath (1999) op cit.
[12] Kruitwagen, A, et al(2017) Naturally selected honey bee (Apis mellifera) colonies resistant to Varroa destructor do not groom more intensively, Journal of Apicultural Research 56(4): 354-365.
[13] Kuenen, L & N Calderone (1997) Transfers of Varroa mites from newly emerged bees: preferences for age-and function-specific adult bees (Hymenoptera: Apidae). J. Insect Behav. 10(2), 213-228.
[14] Cervo R, et al (2014) High Varroa mite abundance influences chemical profiles of worker bees and mite-host preferences. J Exp Biol 217: 2998–3001.
[15] Nolan, MP IV (2016) Impacts of inter-colony distance, mite host choice, and colony polyandry on the host/parasite relationship between Apis mellifera and Varroa destructor. Dissertation, University of Georgia.
[16] Fries, I & S Camazine (2001) Implications of horizontal and vertical pathogen transmission in honey bees infested by Varroa destructor mites. Apidologie 38: 525–533.
[17] Seeley, TD, et al (2015). A survivor population of wild colonies of European honeybees in the northeastern United States: investigating its genetic structure. Apidologie, 46(5), 654-666.
[18] Hepburn, HR, et al (2014) Honeybee Nests: Composition, Structure, Function. Springer Science & Business Media.
[19] Jaffé, R, et al (2009) Estimating the density of honeybee colonies across their natural range to fill the gap in pollinator decline censuses. Conservation Biology, Volume 24, No. 2, 583–593.
[20] Jay, SC & D Dixon (1988) Drifting behaviour and honey production of honeybee colonies maintained on pallets, Journal of Apicultural Research 27(4): 213-218.
[21] Jay, SC (1965) Drifting of honeybees in commercial apiaries 1. Effect of various environmental factors. Journal of Apicultural Research, 4(3): 167-175.
[22] Pfeiffer, KJ & K Crailsheim (1998) Drifting of honeybees. Insectes Soc. 45: 151 – 167.
[23] Free J.B. (1958) The drifting of honey-bees, J. Agric. Sci. 51, 294–306.
[24] Pfeiffer, KJ & K Crailsheim (1998) Drifting of honeybees. Insectes Soc. 45: 151 – 167.
[25] Jay, SC (1965) Drifting of honeybees in commercial apiaries 1. Effect of various environmental factors. Journal of Apicultural Research, 4(3): 167-175.
[26] Thompson, H, et al. (2016), Thiamethoxam: Assessing flight activity of honeybees foraging on treated oilseed rape using radio frequency identification technology. Environ Toxicol Chem, 35: 385–393.
[27] Seeley, TD & ML Smith (2015) Crowding honeybee colonies in apiaries can increase their vulnerability to the deadly ectoparasite Varroa destructor. Apidologie 46:716–727.
[28] Goodwin, RM, et al (2006) Drift of Varroa destructor-infested worker honey bees to neighbouring colonies, Journal of Apicultural Research, 45:3, 155-156
[29] Goodwin, RM et al (1994) The effect of drifting honey bees on the spread of American foulbrood infections. Journal of Apicultural Research 33(4): 209-212.
[30] DeGrandi-Hoffman, G, et al (2016) Population growth of Varroa destructor (Acari: Varroidae) in honey bee colonies is affected by the number of foragers with mites. Exp Appl Acarol 69:21–34.
Compare the late-season mite infestation rates of bees in the hive in their Fig. 3 with the infestation rates of exiting bees in Fig. 4.
[31] Seeley TD, Smith ML. (2015) Crowding honeybee colonies in apiaries can increase their vulnerability to the deadly ectoparasite Varroa destructor. Apidologie 46: 1–12.
[32] Nolan, MP IV & KS Delaplane (2017) Distance between honey bee Apis mellifera colonies regulates populations of Varroa destructor at a landscape scale. Apidologie 48(1,): 8–16.
[33] Kralj, J. & Fuchs, S. 2006. Parasitic Varroa destructor mites influence flight duration and homing ability of infested Apis mellifera foragers. Apidologie 37: 577–587
[34] Kralj, J. & Fuchs, S. (2010) Nosema sp. influences flight behavior of infected honey bee (Apis mellifera) foragers. Apidologie 41(1): 21 – 28.
[35] Rueppell, O, et al (2010) Altruistic self-removal of health-compromised honey bee workers from their hive. J. Evol. Bio. 23 (7): 1538–1546.
[36] Drum, NH & WC. Rothenbuhler (1983) Non-stinging aggressive responses of worker honeybees to hivemates, intruder bees and bees affected with Chronic Bee Paralysis. Jour Apic Res (22:4): 256-260.
[37] Baracchi, D, et al (2012) Evidence for antiseptic behaviour towards sick adult bees in honey bee colonies. Journal of Insect Physiology 58: 1589–1596.
[38] Poulin, R (2010) Parasite manipulation of host behavior: an update and frequently asked questions. In H. Jane rockmann, editor: Advances in the Study of Behavior, Vol. 41, Burlington: Academic Press. https://pdfs.semanticscholar.org/6135/71a29484f3e4be59233f01edf46a82bd6eae.pdf
[39] Reiber, C, et al (2010) Change in human social behavior in response to a common vaccine. Annals of Epidemiology 20(10): 729–733.
[40] Rajabaskar, D, et al (2014) Preference by a virus vector for infected plants is reversed after virus acquisition. Virus Res 186:32–37
Moreno-Delafuente, A, et al (2013) A plant virus manipulates the behavior of its whitefly vector to enhance its transmission efficiency and spread. PLoS ONE8(4): e61543.
[41] Li, Z, et al. (2013) Viral infection affects sucrose responsiveness and homing ability of forager honey bees, Apis mellifera L. PLoS ONE8(10): e77354.
[42] Yue, C and E Genersch (2005) RT-PCR analysis of Deformed wing virus in honeybees (Apis mellifera) and mites (Varroa destructor). Journal of General Virology 86: 3419–3424.
[43] Shah, KS, et al (2009) Localization of deformed wing virus (DWV) in the brains of the honeybee, Apis mellifera Linnaeus. Virol J. 6:182.
[44] Fujiyuki, T, et al (2005) Kakugo virus from brains of aggressive worker honeybees. Adv Virus Res 65:1–27.
[45] Snodgrass, RE (1910) The Anatomy of the honey bee. US Government Printing Office.
[46] Pfeiffer (1998) op cit. also found that most bee drift went to an adjacent hive.
[47] Gary, NE, et al (1978) Distribution and foraging activities of honeybees during almond pollination. J. Apic. Res. 17(4): 188-194.
[48] Rueppell (2010) op cit.
First published in: American Bee Journal, March 2018
Contents
Quick summary. 1
First assessment—early July. 1
Breeder disappointment. 2
Second through fourth assessments. 3
The final tally. 3
The Cost of the selective breeding program.. 4
what’s next. 4
Control of matings. 5
Analysis of the late-season Failure to Maintain low mite levels. 5
Could the spikes have come from mite reproduction?. 11
Am I selecting for bees that don’t rob?. 12
Acknowledgements. 12
References. 12
Selective Breeding for Mite Resistance:
1000 hives, 100 hours
Randy Oliver
ScientificBeekeeping.com
First published in ABJ March 2018
This spring I seriously stepped up my game in attempting to breed bees resistant to varroa. On these pages I’ll share my successes and failures, as well as keep track of the costs involved.
Quick summary
There is now plenty of evidence that unmanaged honey bee populations can evolve resistance to varroa, and several groups have also had various degrees of success with managed bees. What we now need is for the commercial bee breeders to all start joining in. To that end, I’ve suggested a simple and workable program for them to follow [[1]].
Selective breeding is nothing other than human-directed evolution. In the case of bee breeding, the human applies additional selection pressure above and beyond that imposed by the environment. Thus, selective breeding is a process of “bottlenecking” the genetic diversity of the “wild type,” in order to favor traits that the human prefers. In my case, I prefer gentle bees that are well-adapted to my ecoregion and income stream (almond pollination, nuc and honey sales). I’m now adding one more hurdle for them to clear—to maintain low levels of varroa. How they manage to do it is of interest, but not important to me at this time.
If you tell the bees how to do the job, you limit them. But if you just tell them the desired final outcome, they may come up with solutions that you had never thought of [[2]].
I then began my “Walking the Walk” demonstration project [[3]] in 2017 with 1000 nucs—made over a period of several weeks–headed by freshly-mated queens grafted from low-mite queen mothers from 2016, open mated in yards flooded with drones from my operation.
First assessment—early July
The selection process is based upon the elimination of “loser” colonies from the potential breeder pool by monthly mite wash assessments; any hives failing to make grade are immediately treated for mites, so no colonies are lost in the process.
We performed the first round of mite washes between 25 June and 15 July, in the same order in which the nucs had been made. Most colonies were now in double deeps, and had grown to around 15 frames of bees. At this point of time, our spot checking indicated that, as normal, our average mite wash count was approaching 6 mites per half-cup sample of bees (2 mites per 100 bees)—our usual action threshold (which, at this time of season, would be for us to apply a formic acid treatment while extractable honey was still on the hives). The results are shown in Table 1.
Table 1. The first assessment separates out both the potential breeders as well as the “mite bombs.”
| Beginning potential breeder pool (number of hives mite washed at first assessment) |
1028 |
| Average mite wash count (per 1/2 cup of bees), for all colonies at this time point |
5.5 |
| Range of yard-average mite wash counts |
1–19 |
| Range of highest individual mite wash counts in a yard |
4–109 |
| Overall percent of hives exhibiting a count of 3x the yard average |
10% |
The last row in the table above is an assessment of potential “mite bomb” colonies—those whose mite wash counts were above an arbitrary three times the yard average. What I’m finding is that if one can identify and eliminate those “bombs” early on, mite management becomes much easier overall. We treat and requeen the bombs [[4]].
Practical application: I want to point out something important that I’ve learned from my extensive mite monitoring—that it’s easy to be unaware of the “mite bombs” lurking in your yards (note that one of those “bombs” already had a mite count of 109). By mid July, although our average mite count was less than 6, one out of ten of my hives exhibited a mite count of at least 15, indicating that even with our normal treatments, those hives would have become a problem. Take home message: spot checking is likely to miss the bombs.
Breeder disappointment
I’m not trying to sell you anything, so I will share my disappointments as well as my successes. The queens for the thousand nucs were grafted from 15 different breeder queen mothers. Each breeder colony exhibited very low mite levels after almonds, and one–queen “S”–came from a survivor colony rescued from another beekeeper’s long-abandoned apiary. Queen Zero was in her third year with only minimal treatment.
After grafting off those promising mothers, I maintained those colonies in my crowded home yard, and tracked their subsequent varroa buildup. Most failed the June assessment (perhaps due to a high rate of mite drift), so I tracked only three through August (Table 2).
Table 2. Mite counts per half cup of bees from three favored breeders.
| |
Assessment date and mite count/sample |
| Breeder name |
7-Jun |
19-Jul |
17-Aug |
| Zero |
29 |
27 |
23 |
| S |
8 |
35 |
28 |
| L |
9 |
10 |
12 |
As you may imagine, the above counts were disappointing, especially since Queen Zero’s colony had done so well in previous years (although note that her count was slowly going down as the season progressed). Queen L showed particular promise, since the colony was extremely gentle and productive, and exhibited a mite count of zero after almonds, so I had made a number of late grafts from her.
Practical application: just because a colony exhibits a very low mite count at first assessment, don’t assume that it will necessarily be able to continue to do so [[5]].
So let’s see how the daughter colonies did:
Second through fourth assessments
The thousand daughter colonies by this time had been placed in some 50 different yards. I gave the hives in each yard time to build up and grow a mite population before assessment, so some yards got four assessments, some only three. I eliminated from consideration any colonies that were performing poorly, or that appeared to have requeened. As you can see in Table 3 below, the selection process was brutal—only 5% of the original thousand colonies were still in the running come November.
Table 3. Results for the season’s elimination process. Any hive not making grade at any time point was immediately treated for mites—thus no colonies were lost in the selection process.
| Assessment
date |
Number of hives with counts of <6 mites/sample*** |
Percent of starting number of hives remaining* |
| Early July |
289 |
28% |
| Mid Aug and or mid Sept** |
98 |
10% |
| Late Oct |
52 |
5% |
| * Percent of the original 1028 hives
** In most yards we took 4 counts, but for the last-made nucs we took only 3 counts
*** The late October count includes a few exceptionally strong colonies with mite counts of up to 8, which is below a commonly-accepted treatment threshold for that time of year. |
Practical application: the first round of mite washes was tedious, since we needed to sample a thousand hives. But it quickly became easier, requiring sampling of only 300 hives in the next round, and only 100 in the fourth round (which we could do in a day).
By the September assessment, nearly all of the remaining potential breeders had been consolidated into three yards. We’d been feeding all colonies pollen sub and syrup to encourage late-season broodrearing, and they had mostly finished off their last patties.
Practical application: all hives in our operation were managed the same; the only difference for the potential breeders is that they didn’t get treated for varroa. Thus, there was no loss in productivity or colony strength due to the selection process.
The final tally
I started with over 1000 hives, and ended up in November with 52 that still exhibited mite counts below the treatment threshold. I’m quite happy with the low number of colonies remaining, since I want to apply a strong degree of selective pressure. If even a dozen colonies still make grade come next spring, that will give me enough diversity of bloodlines for next season’s queen mothers.
I’m guardedly optimistic, since it’s heartening to identify colonies that appear to be able to manage varroa on their own. I’m completely aware that a selective breeding program is a long-term process, and that I will need to continue to perform at least 1500 mite washes every season. But if I can demonstrate the feasibility of breeding locally-adapted mite-resistant stock, it will be well worth it.
Practical application: having 1000 hives in a breeding program for mite resistance puts one in the top tier of such programs worldwide. I encourage other large-scale beekeepers to join me in this effort!
Although I was disappointed in the performance of the queen mother colonies (Table 2), I’m guardedly optimistic about some of their daughters–as of November (after a full season without any treatments), there were still 16 colonies that exhibited mite counts of 1 mite per hundred bees or lower, despite being in crowded yards with plenty of mite immigration occurring.
Practical application: I’m not trying to sell anything nor making any predictions—I’m simply documenting the results from applying strong selective pressure for apparent mite resistance. The success of any breeding program is completely dependent upon the degree of heritability of the traits selected for—in this case, resistance to varroa buildup. Next year’s results will be the test of that heritability.
The Cost of the selective breeding program
The first question that I know you’ll ask was how much did it cost me to engage in this program? Since all of the 1000 colonies were managed exactly the same, save for withholding mite treatments from those that made grade at each assessment, there was no loss in productivity or colony health, nor any extra labor cost for management. Thus, I can summarize the only two added costs to our normal management—the labor of doing the mite washes and the cost of the rubbing alcohol (Table 4).
Table 4. Summary of the additional labor and materials involved.
| Total # of washes |
1463 |
| Total man hours |
98 |
| Cost of alcohol |
$150 |
That’s it—a hundred additional man hours—chump change for a large operator.
Practical application: although I’ll be the first one to say that performing 1500 mite washes is a bit tedious, it also unblinded me as to the “state of varroa” in our operation, saved the rest of the crew time (since each hive got marked in July with a mite count and any notes on action items), and eliminated all the mite bombs before they hurt the rest of the operation. The most time was involved in the first wash, which we did in July when the colonies were mostly in doubles. A helper and I could easily perform 100 mite washes in a short day, including driving between yards. I’d strongly suggest that you perform your first wash prior to putting on any honey supers.
What’s Next
I’m not about to claim success this early in the game. We’ll see how my remaining 52 potential breeders do over the winter. Remember, I’m only selecting strong, productive, gentle colonies, with the mite wash being the last hurdle. I was disappointed by how the mite counts climbed in my breeder queen colonies from this spring, so I’m very realistic about how this may take a while. It largely depends upon the degree of heritability of whatever traits these colonies are using to fight the mite, whether all the hives are using the same traits, whether those bloodlines can all work together, and whether I can maintain control of the matings in my breeding population. And on that note…
Control of matings
Unless you practice instrumental insemination, it’s unlikely that you will achieve complete control of your matings. A very nice practical experiment by Szabo in Canada [[6]] indicated that queens will get mated if a drone source colony is within 5 miles; it takes 10 miles of isolation to completely control your matings. In many parts of the country, it may be difficult to find an area without any other hives within a 10-mile radius.
So unless you can find a truly isolated mating yard (such as used by Brother Adam), your best bet may be to do what I’m doing—flooding my mating yards with drones, and offering free queen cells each spring to any other beekeepers in the area.
Analysis of the late-season failure to maintain low-mite levels
After tracking the rates of mite increase over the course of the season (four washes for many hives), I was really surprised by the huge and unexpected jump in mite counts in a number of the potential breeders between mid September and the end of October. And that brings us to the bugaboo of many beekeepers—the apparent late-season drifting of mites from high-mite hives to low-mite hives. Check out the graph below for the successive mite wash counts for the potential breeders in one of the yards (Fig. 1):
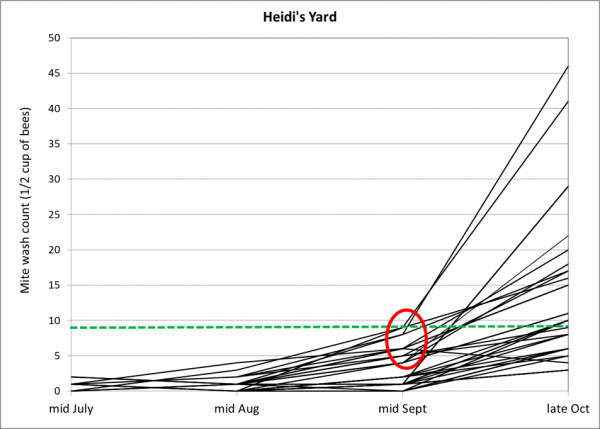
Figure 1. Mite counts for individual potential breeder colonies in one consolidation yard, plotted over time. The green dotted line indicates the commonly-recommended treatment threshold of 3 mites per 100 bees. Note the spike in mite counts in roughly half the hives at the last assessment. On the other hand, the other half were able to maintain mite levels below the treatment threshold of 3 mites per 100 bees. Not a single hive had collapsed from mites in this yard of 34 hives—so any mite immigration would have needed to come from elsewhere.
I’m well aware that as colonies reduce their amount of broodrearing late in the season, that a greater proportion of the mites are forced into phoresy, and that alcohol wash counts will increase. But these colonies were actually increasing the sizes of their broodnests due to us feeding pollen sub, so we can’t blame the spike in mite counts upon that.
In the above graph I’ve circled the inflection point for several hives in red. A number of them showed indications between the mid-Aug and mid-Sept counts that they were barely holding their mites in check, so I can understand that they’d likely have a problem later, but not to the degree indicated. In my experience, untreated hives from similar nucs would typically show mite counts in the 20’s to 30’s by mid September (Fig. 2), so any hive that had maintained a mite count below 10 by mid September would certainly appear to be exhibiting some degree of resistance to mite buildup.
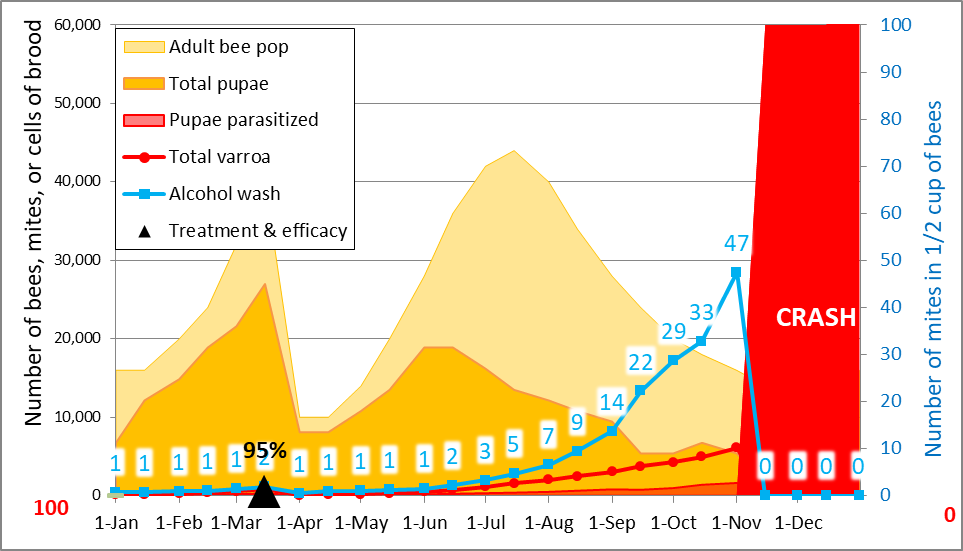
Figure 2. The typical expected mite rate of mite buildup for an untreated hive created from a nuc (at black triangle) in my operation. For the above simulation, I factored in a mite immigration of 500 to reflect the average mite buildup rate that we actually observe if we don’t treat. As of mid September, that count would typically be well over 15—much higher than any hive remaining in the breeder pool.
The potential breeders in Heidi’s yard (Fig. 1) had held their mites to half that count of 15. So what happened between then and the end of October?
When I run the numbers, I come to the same conclusion as did DeGrandi-Hoffman [[7]]—that “the rapid growth of the mite populations could not be accounted for… by mite reproduction alone,” and that “the combination of field data and simulations suggest that [foragers with mites] were drifting in from other colonies and contributing to the growth of varroa populations in our colonies particularly in the fall.”
This apparent late-season inundation of some colonies is a hot topic of late, but was already reported and quantified some 25 years ago [[8]]. Allow me to run a couple more simulations to illustrate the effect of mite immigration. By the way, I’m getting positive feedback on my mite model from beekeepers in countries all over the world—if you’ve got Excel on your computer, give it a try! This time, the simulations will be for colonies exhibiting a good degree of mite resistance, by decreasing (in the model) the average number of daughters per foundress from 1.5 down to 1.15, resulting in an April-Sept r value for the mites of 0.015 independent of immigration (Fig. 3).
| A note on r-values. My modeling suggests that for regions with a 3-month brood break over winter, that colonies that somehow manage to restrict the overall varroa daily rate of increase from April through September to 0.014 would never need any mite treatments if they were split or swarmed each year. In areas where colonies seldom go broodless, that rate for sustainability would need to be in the 0.003 – 0.004 range. So we know the target that we’re aiming for! To compare these daily r values to those from studies by others, see the table in the end notes. |
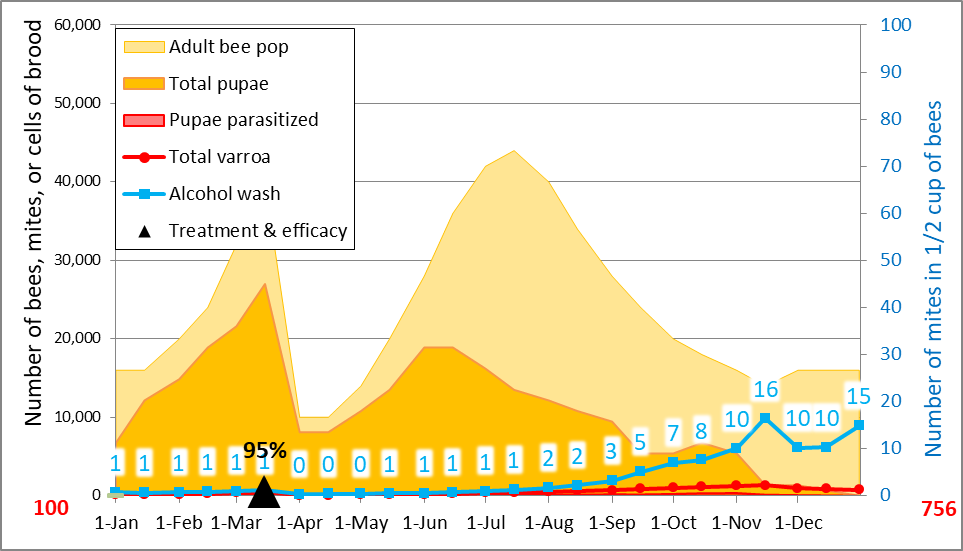
Figure 3. A simulation to match the observed alcohol wash counts for the potential breeders for the July through September assessments. I allowed for the same total immigration of 500 mites. Note, however, that this simulation also predicts that the counts wouldn’t have spiked beyond 10 by the end of October, indicating that the amount of immigration was much higher than 500 mites.
So let’s increase that late-season mite immigration from 500 to 2000 (Fig. 4).
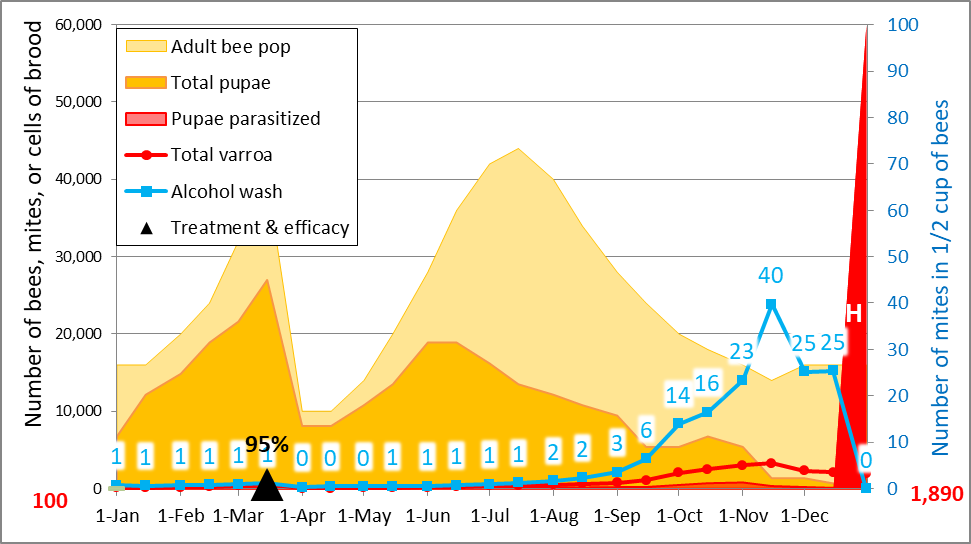
Figure 4. Same simulation as above, but with a late-season immigration of 2000 mites. Now we’re getting somewhere–the predicted mite wash counts now closely match what occurred in the Heidi’s yard (Fig. 1), with the suggestion that immigration was even higher in some hives.
And it wasn’t just in that yard (Fig. 5).
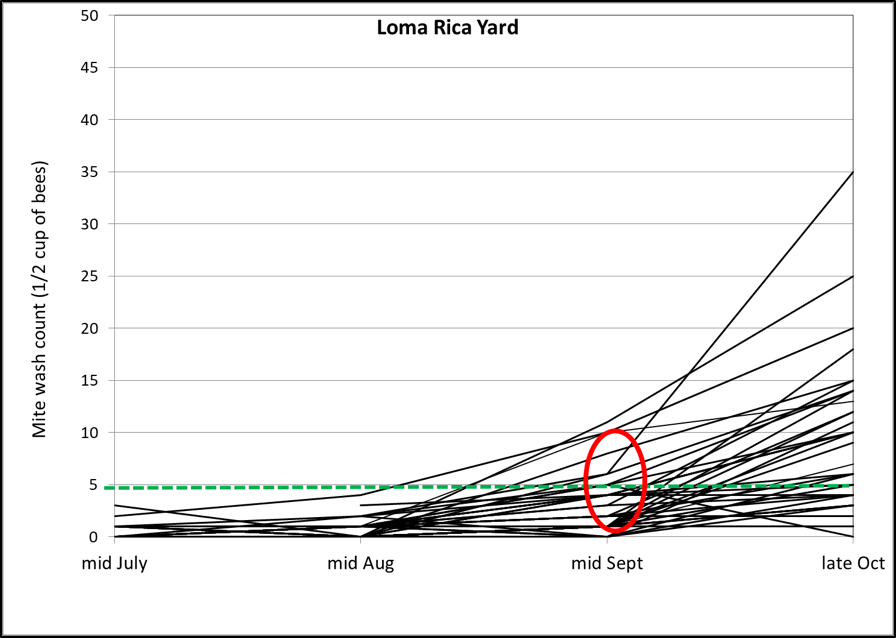
Figure 5. Same thing in the second breeder consolidation yard. This yard contained about 100 hives in total, but all had their mites well under control, and none had collapsed—so any mite immigration must have come from outside the yard.
By this time I was scared. Would this spike be occurring in our 1500 other hives that we had treated in August with Apiguard (thymol)? So I spot-checked 3 non-breeder colonies each in 5 yards (including one of the breeder holding yards). Results: their average mite count was only 4 (completely acceptable to us, since they’d soon be getting an oxalic dribble), although there was one outlier with a count of 20.
Practical application: although there were acceptable mite counts in 14 out of 15 tested hives, there was still that danged high-mite outlier, despite the fact that all hives had been treated equally in August. Since the late-season spike is so erratic, I can only guess that a proportion of the hives in each yard are robbing collapsing hives away from my yards. Since there are only a few hobby beekeepers within flight range, I’m strongly suspecting that the mite influx is coming from escaped swarms.
So assuming that all hives were exposed to some degree of mite drift, how could I account for the control hives not spiking as much as the potential breeders that did? Below (Fig. 6) are the actual counts for the last breeder consolidation yard (which was close to the Loma Rica yard), in black. I’ve overlaid four different simulations:
- The red dotted line would be representative of non-resistant hives that had been treated in August, with an expected mite increase r value of 0.017 for that time of season, with a late-season immigration of 500 mites. Because their pre-immigration mite levels had been greatly reduced by treatment, they would still exhibit low mite counts at the end of October, as I observed.
- The blue dashed line laying almost directly behind the above line represents an untreated mite-resistant colony that kept mite increase from mid April through mid September to an r value of only 0.012, but with an added a 500-mite immigration. This would reflect the breeders that made the final grade.
- Now look at the circled inflection point—I suspect that those untreated potential breeders may not have been quite as resistant as the blue line breeders, so I assigned them a slightly higher baseline r value of 0.014, with an immigration of 3500 mites, mostly occurring during a few days in mid September. Their dashed purple curve accurately matches the observed spikes. But note that even that massive 3500-mite immigration would still not account for the measured mite spikes in the three colonies above that curve.
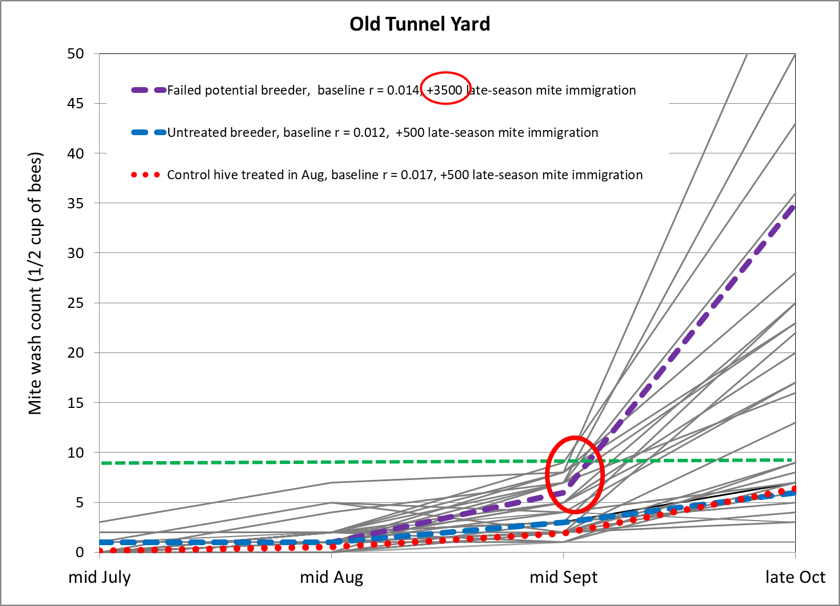
Figure 6. By running the numbers, we can perhaps better understand the causes for the late-season mite spikes that many beekeepers complain of. Here I compare actual mite wash counts to the three simulations described above.
Hold on, you say, did you really mean 3500 mites? Hard as it is to believe, that appears to be the case. But mite immigration of that magnitude has been well documented [[9]].
Could the spikes have come from mite reproduction?
I feel fortunate to have friends who challenge me to support any claim that I make. One, Charlie Linder, asked me whether the mite spike in autumn could result from mite and bee population dynamics within the hive—without an influx of mites from outside. I’ve pointed out in a previous article [[10]] that alcohol wash counts can be expected to spike in fall, but could they do so to this extent without additional mites drifting in from outside?
For those interested I’ll do the math as a footnote [[11]]. The math indicates that neither mite reproduction nor colony dynamics could possibly account for those observed late-season spikes—the same conclusion as reached by Dr. DeGrandi-Hoffman’s USDA team.
Update: it now looks as though that if some of my colonies indeed started out with 20 mites or fewer, that the fall spike could have come about from simple reproduction along with minor drift. I will discuss the need to tweak the protocol of my suggested breeding program to account for this.
I asked breeder John Keefuss about his resistant colonies. He calls some of them “mite black holes”—colonies seem to be able to swallow those mites and somehow make them disappear. I have yet to figure out a plausible way for the bees to make that happen [[12]].
Am I selecting for bees that don’t rob?
A mite-resistant colony may be able to suppress the buildup of varroa, but then get overwhelmed with mites later in the season when it robs out a collapsing colony in the vicinity. Note that only half the colonies in each yard exhibited those sudden spikes in mite counts. Could it have been that they were the only ones that robbed out collapsing escaped swarms?
Practical application: Prior to varroa, it was evolutionarily adaptive for a colony to practice late-season robbing. That may no longer be the case, because along with that serving of free honey comes a side order of mites. Since I eliminated any mite-spiking colonies from the breeder pool in this last round, perhaps I’m inadvertently also selecting for colonies that are averse to robbing. Remember, I’m not telling the bees how to do the job, but that they do have to make it all the way through the season with low mite levels. Perhaps avoidance of robbing is necessary to make the grade.
COMING UP: I plan to elaborate on the subject of mite drift in my next article.
Acknowledgements
Thanks to my hard-working helpers Tara McKinnon, Rachel Woodward, and Josh Sewell—they made the tedium of mite washing much more enjoyable. And to my sons Eric and Ian, who are working with me and around me during our learning curve to make this breeding program work. And thanks to the donors who help to support my research.
References
[1] Bee Breeding for Dummies https://scientificbeekeeping.com/the-varroa-problem-part-6a/ and
Smokin’-Hot Mite Washin’ https://scientificbeekeeping.com/the-varroa-problem-part-10/
I’ve also provided a user-friendly mathematical model for use with a breeding program:
https://scientificbeekeeping.com/randys-varroa-model/
[2] Paraphrased from the movie Tortilla Soup.
[3] Walking the Walk https://scientificbeekeeping.com/the-varroa-problem-part-7/
[4] We want to remove any highly mite-susceptible colonies, so that they won’t be producing drones next season.
[5] The ARS is hoping that POL-line mite-resistant queens will be more widely available as breeding stock within a year.
[6] Szabo, TI (1986) Mating distance of the honeybee in North-Western Alberta Canada. Journal of Apicultural Research 25(4): 227-233.
[7] DeGrandi-Hoffman, G, et al (2016) Population growth of Varroa destructor (Acari: Varroidae) in honey bee colonies is affected by the number of foragers with mites. Exp Appl Acarol 69:21–34
[8] Greatti,M, et al (1992) Reinfestation of an acaricide-treated apiary by Varroa jacobsoni Oud. Experimental & Applied Acarology 16: 279-286.
[9] Greatti,M, ibid
[10] Using The Mite Model https://scientificbeekeeping.com/the-varroa-problem-part-13/
[11] Assuming that 50% of the mites were phoretic (indicating that the phoretic count would be proportional to the total mite population) at the mid Sept and 1 Nov time points, going from a wash count of 5 to 35 in 45 days would be a daily r value of 0.043. Even if you assume only 3 days of phoresy (unlikely due to the low brood:bee ratio), to obtain a daily r of 0.043 would require that every foundress produced 1 successfully-mated daughter, and that there was zero mortality (over 15 days) for either the foundress or that daughter. But since those colonies up to that point had exhibited a far lesser rate of reproductive success, I find this explanation untenable. Compare the 0.043 r value to those from the literature:
|
|
|
|
| Source |
Year |
r(day) |
|
|
|
|
|
|
|
|
|
| Harris, Harbo, Villa,Danka 2003 |
1993 |
0.031 |
|
| DeGuzman 2007 Baton Rouge Italians |
2007 |
0.027 |
|
| To double the mite pop each month |
|
0.023 |
|
| Harbo, Harris 1999 worst colony |
1999 |
0.023 |
|
| Harris, Harbo, Villa,Danka 2014 |
2002 |
0.023 |
|
| Harris, Harbo, Villa,Danka 2004 |
1994 |
0.021 |
Typical range for com-mercial stocks |
| Harris, Harbo, Villa,Danka 2008 |
1997 |
0.021 |
| Danka 1999 16 day |
1999 |
0.021 |
| DeGuzman 2007 Baton Rouge Italians |
2007 |
0.021 |
| Harris, Harbo, Villa,Danka 2007 |
1996 |
0.020 |
| DeGuzman 2007 Baton Rouge Russians |
2007 |
0.020 |
| Randy’s typical California hive |
2016 |
0.019 |
| Harris, Harbo, Villa,Danka 2005 |
1995 |
0.019 |
| DeGuzman 2007 Baton Rouge Italians |
2007 |
0.017 |
| Vandame Mexico EHB |
2000 |
0.017 |
| Harris, Harbo, Villa,Danka 2015 |
2002 |
0.014 |
|
| Harris, Harbo, Villa,Danka 2006 |
1995 |
0.011 |
|
| Harbo, Harris 1999 average colony |
1999 |
0.010 |
|
| Vandame 2000 EHB in Mexico |
2000 |
0.010 |
|
| DeGuzman 2007 Baton Rouge Russians |
2007 |
0.009 |
|
| Harris, Harbo, Villa,Danka 2013 |
2001 |
0.007 |
|
| Harris, Harbo, Villa,Danka 2009 |
1999 |
0.005 |
|
| Harbo, Harris 1999 average of resistant colonies |
1999 |
0.004 |
Our goal |
| Harris, Harbo, Villa,Danka 2012 |
2000 |
0.003 |
| Harris, Harbo, Villa,Danka 2010 |
1999 |
0.003 |
| DeGuzman 2007 Baton Rouge Russians |
2007 |
0.003 |
| Harris, Harbo, Villa,Danka 2011 |
2000 |
0.002 |
| Harbo, Harris 1999 best resistant colony |
1999 |
-0.008 |
[12] I’m be skeptical that the bees can manage to kill incoming phoretic mites at a high enough rate to avoid the spike, since varroa are so amazingly good at avoiding being groomed from a bee once they’re attached.


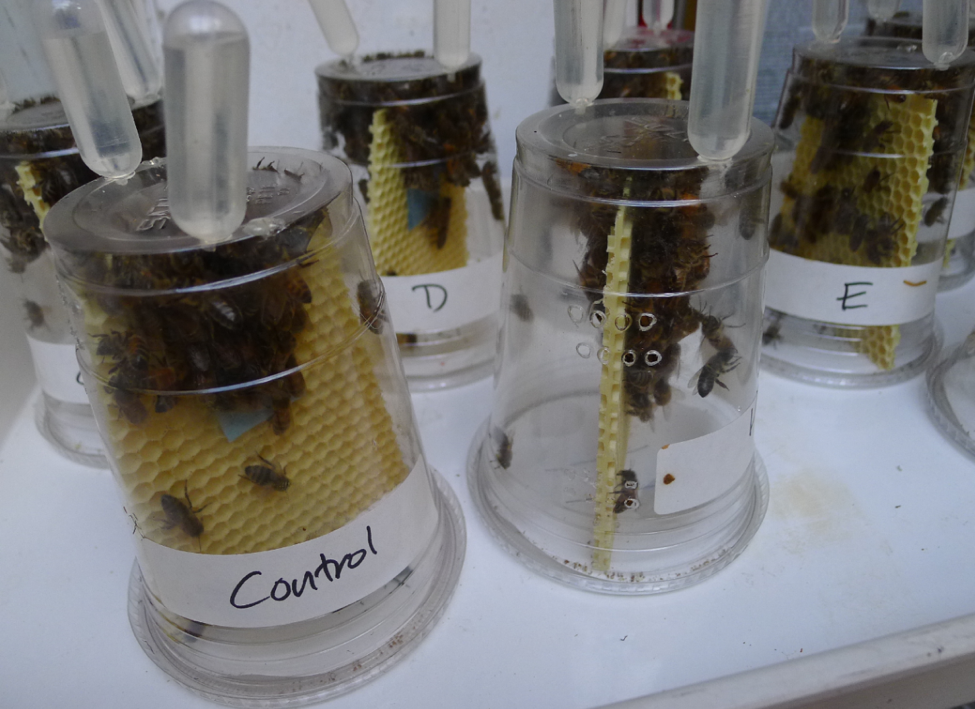
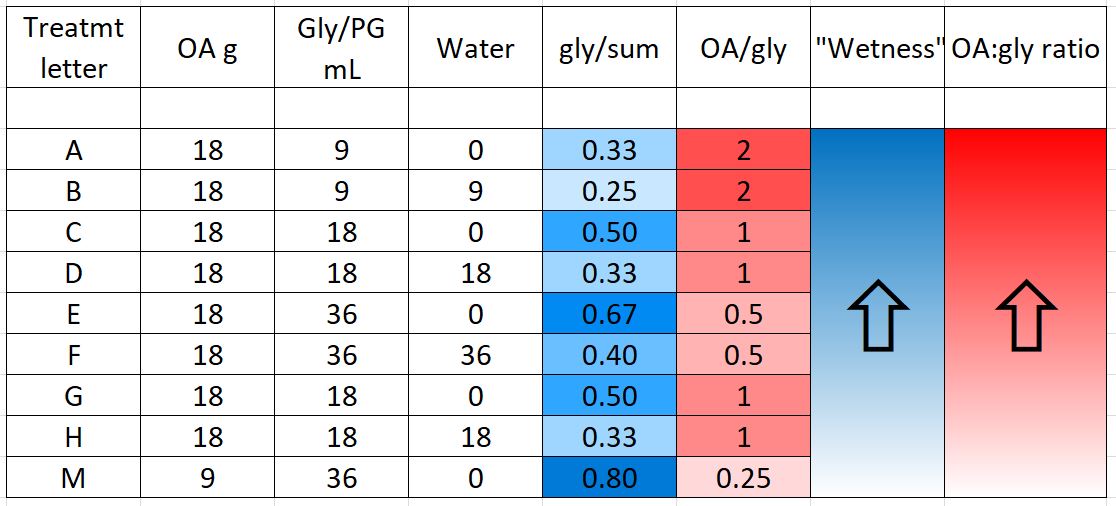

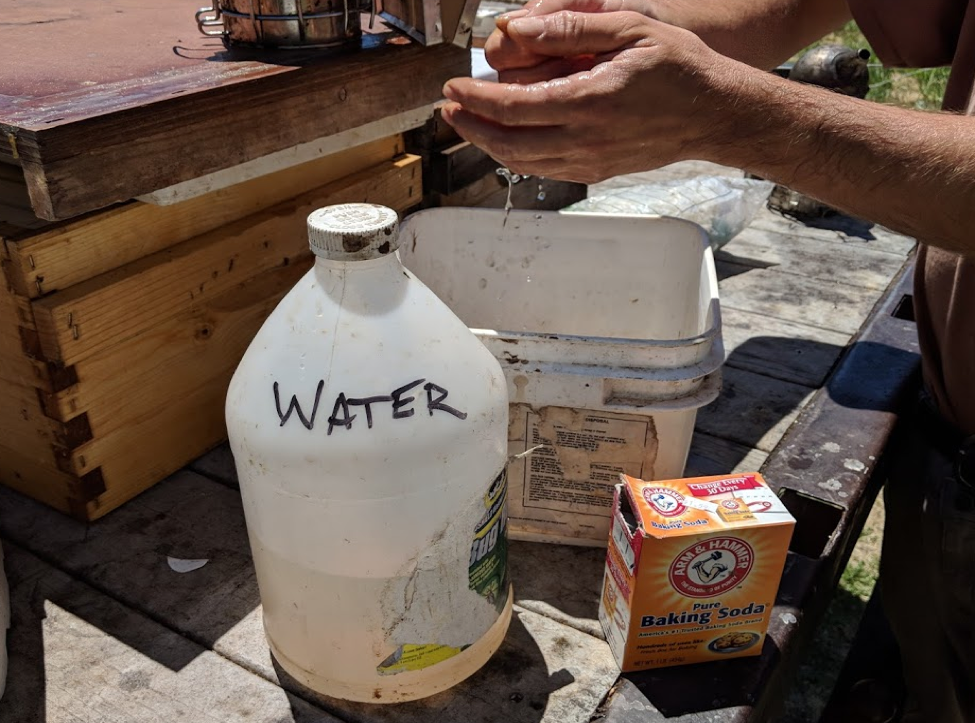
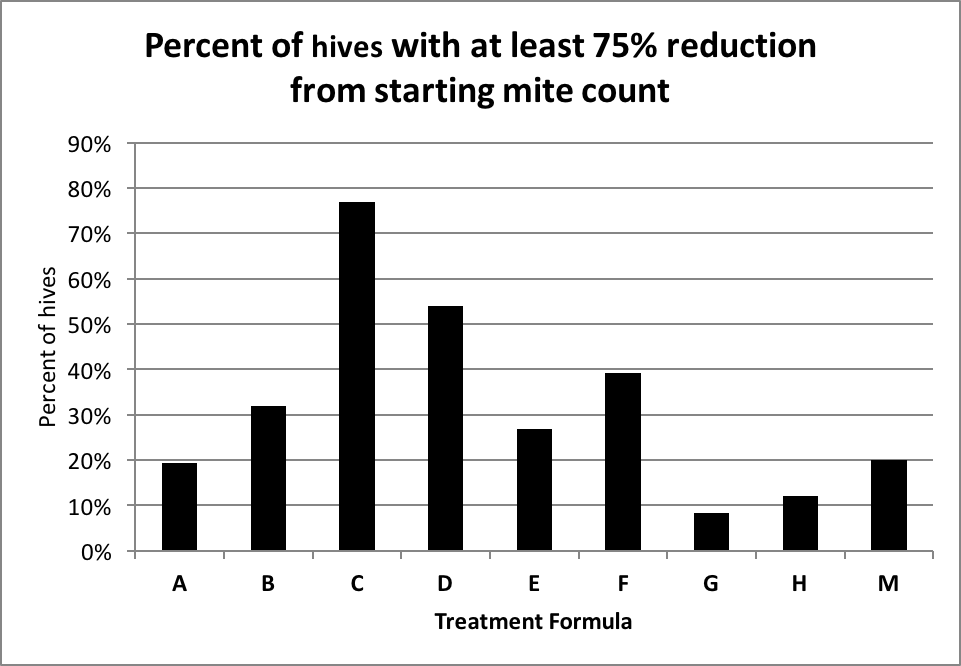
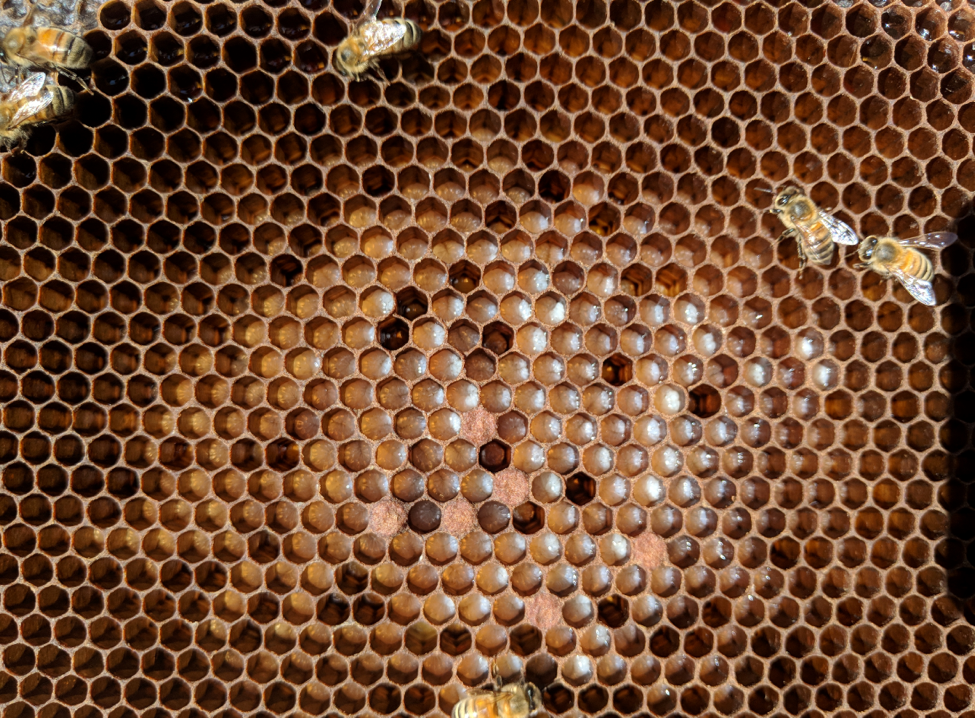

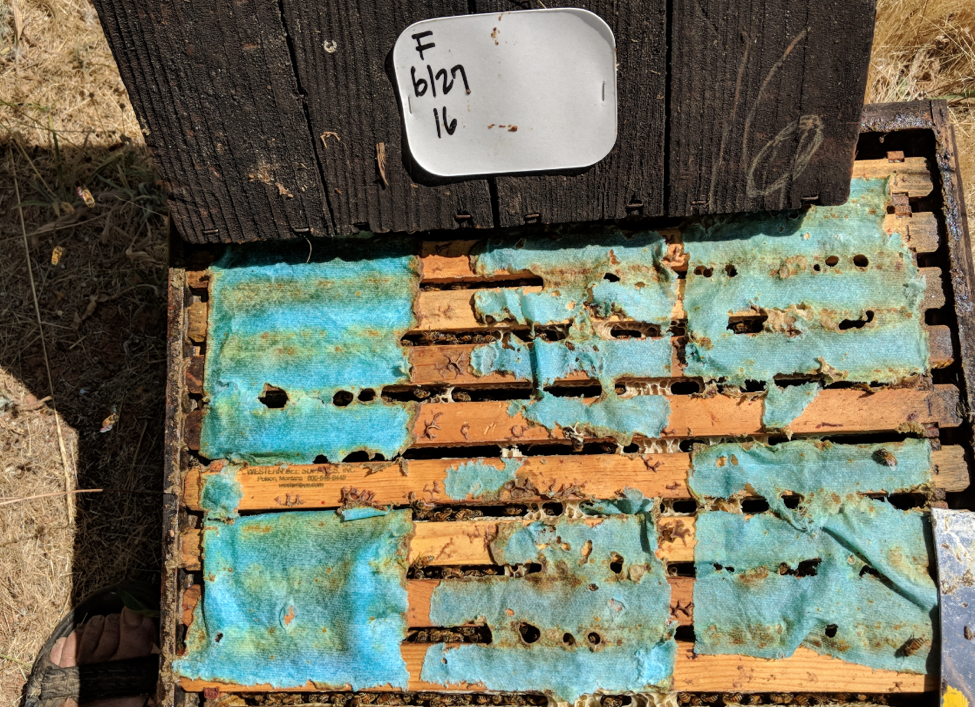


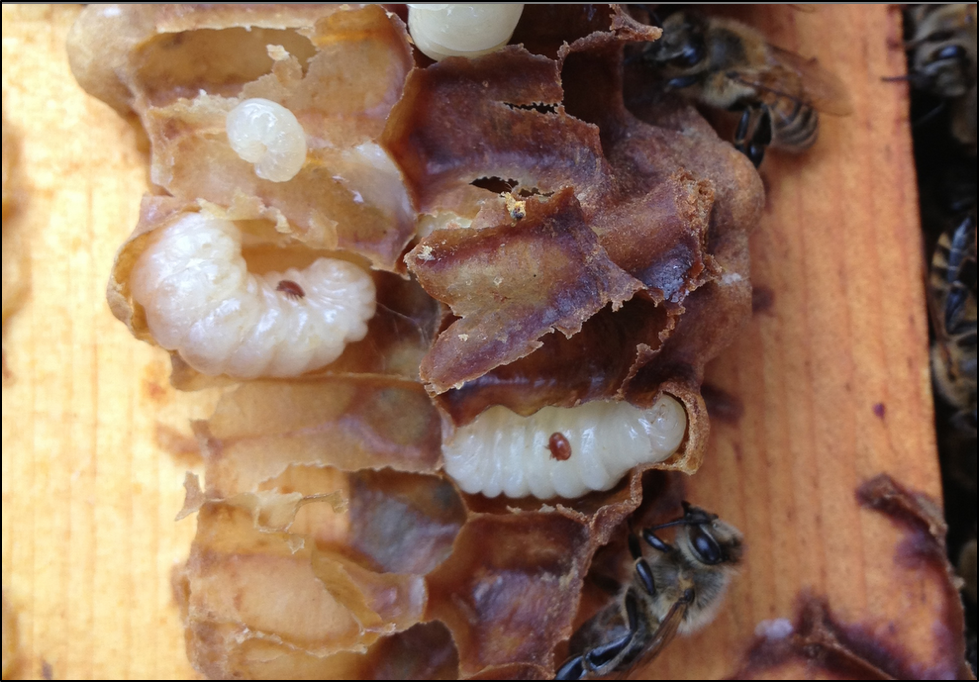

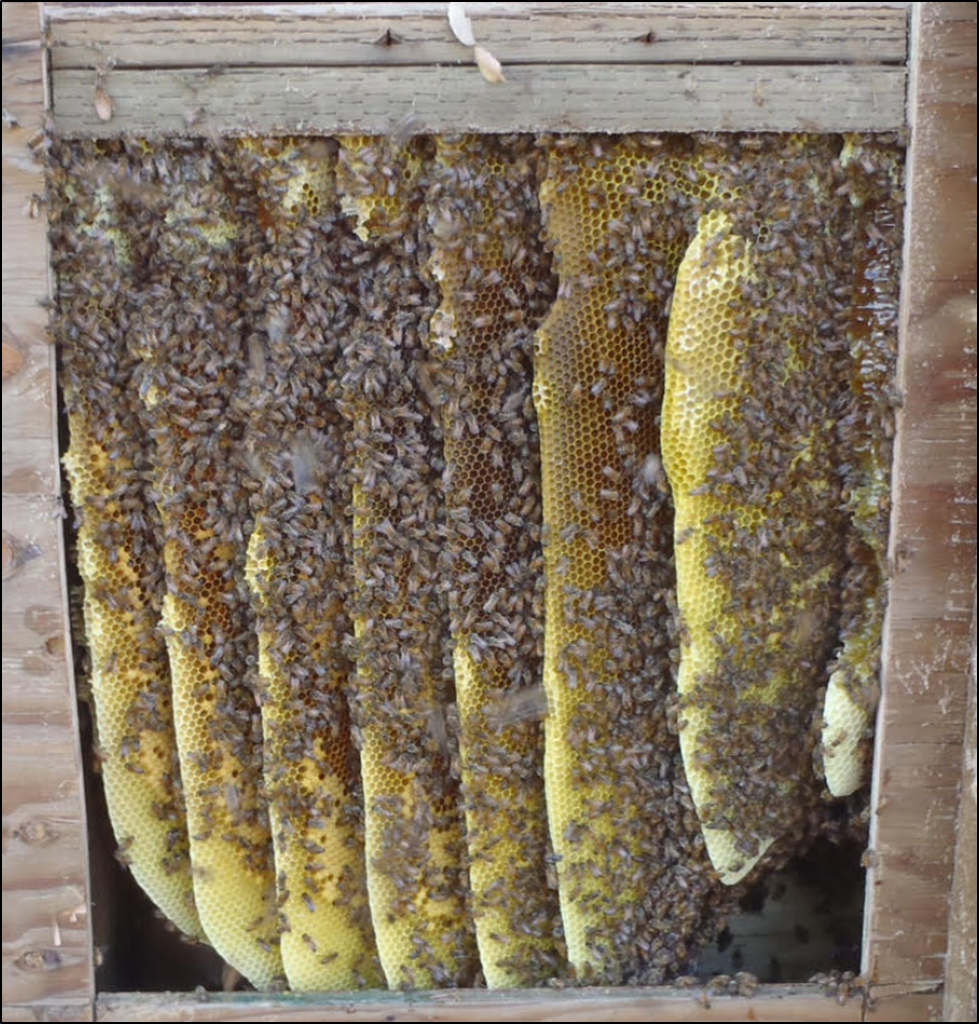
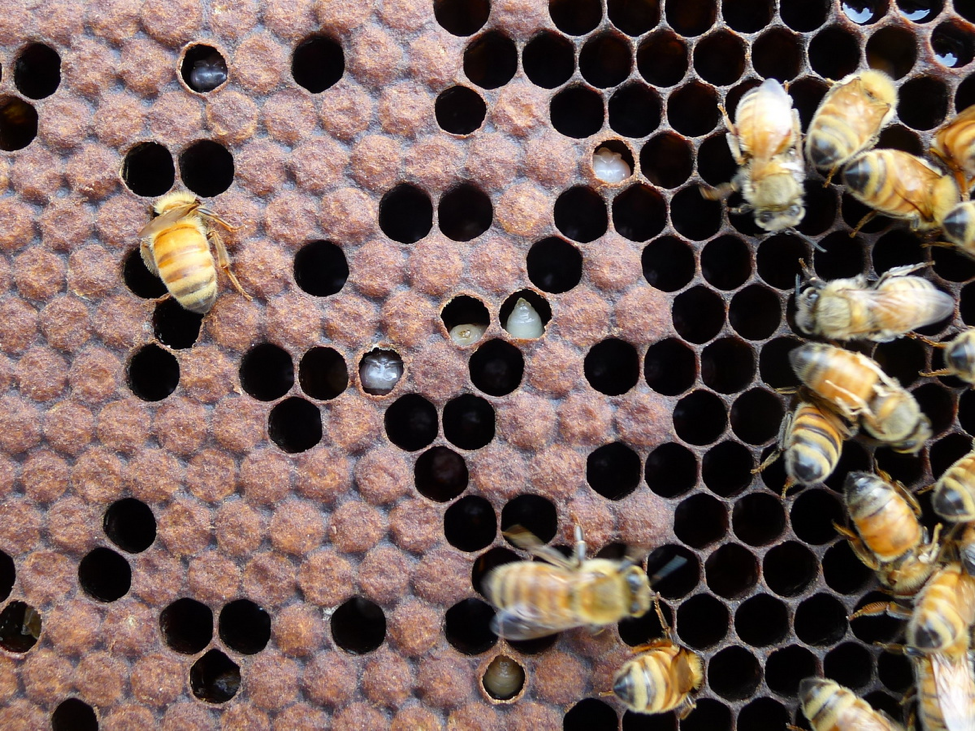
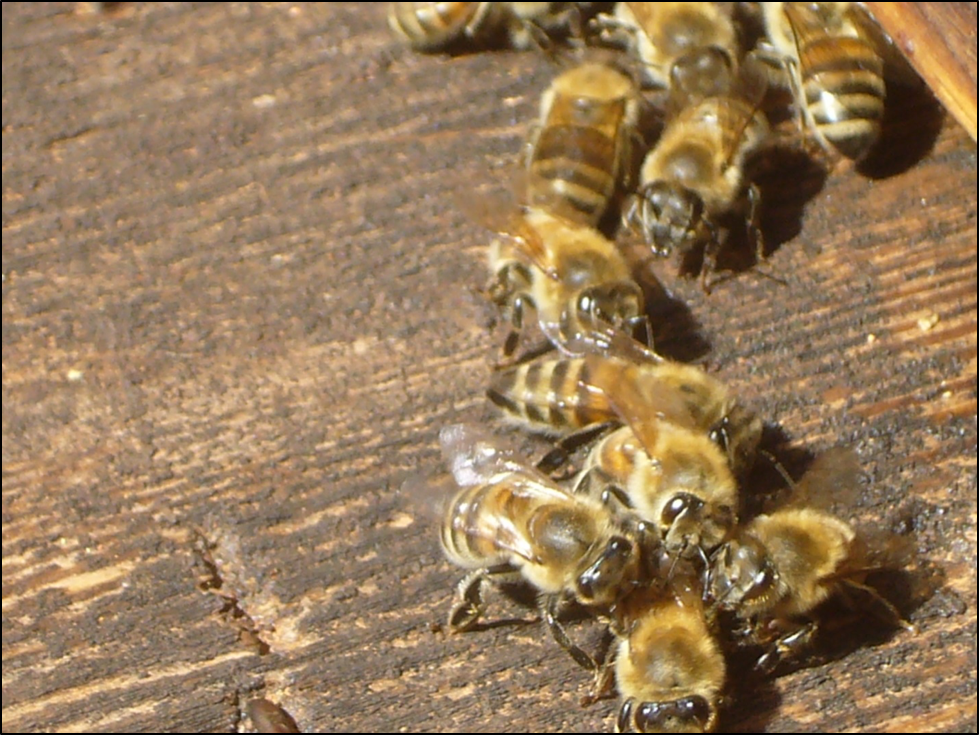
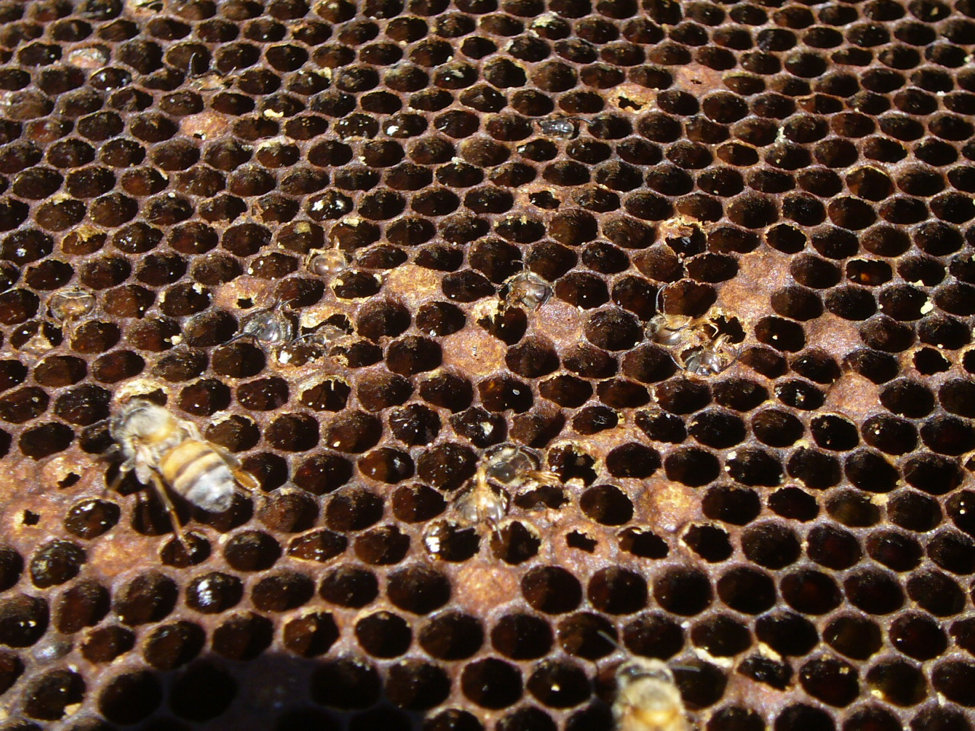
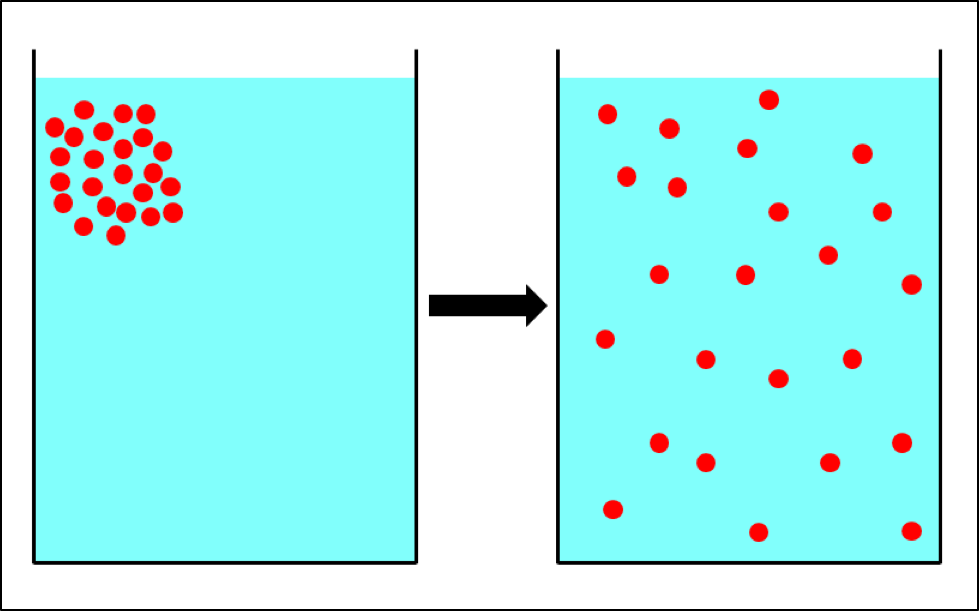
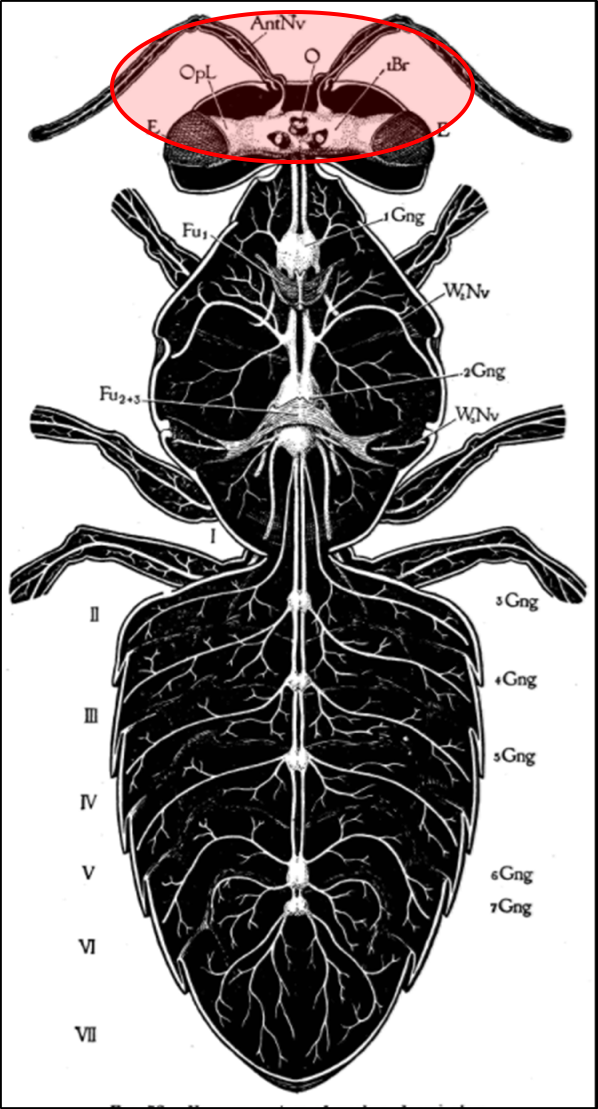

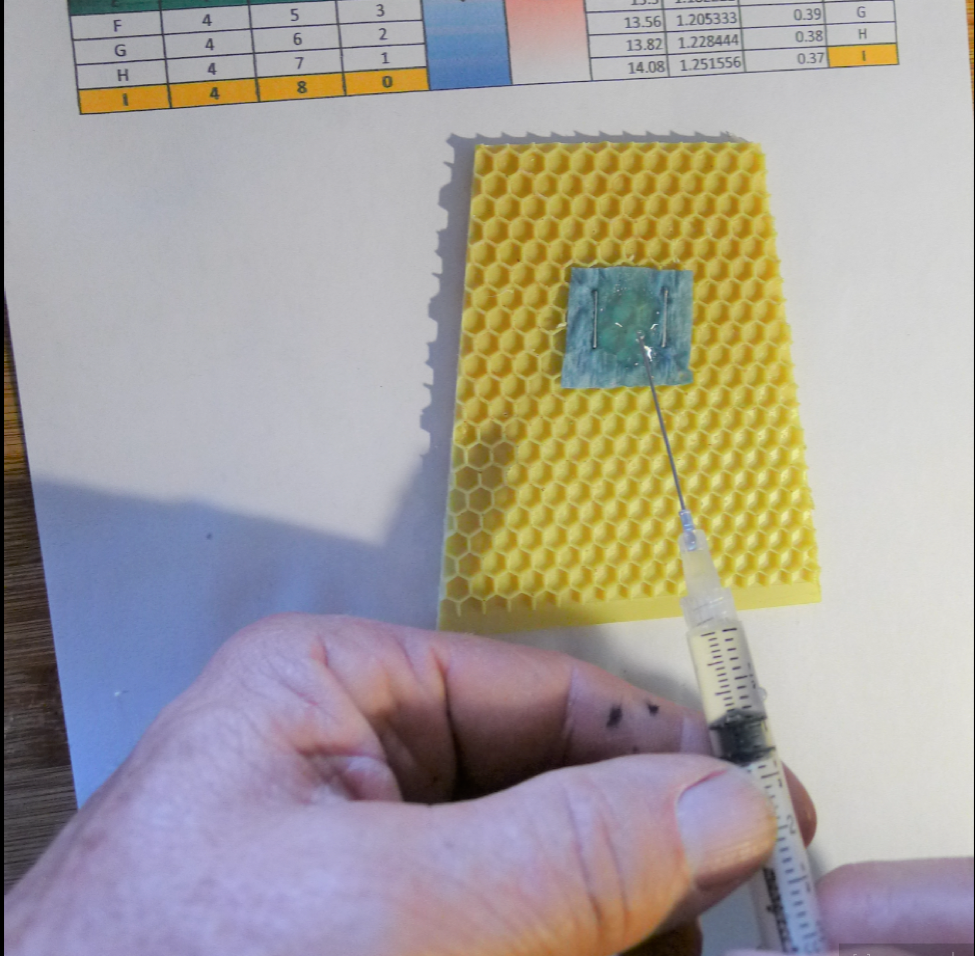
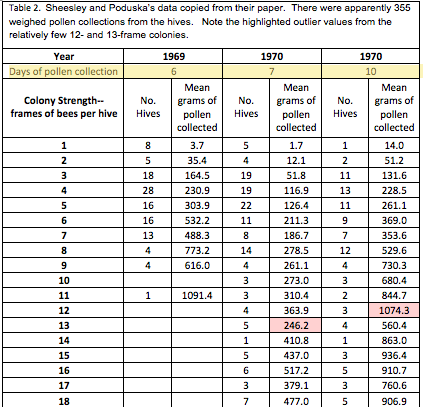